


目录
由于原文公式较多,所以本文部分内容以截图的形式分享给大家,word文档和相关代码可以通过下面的连接下载

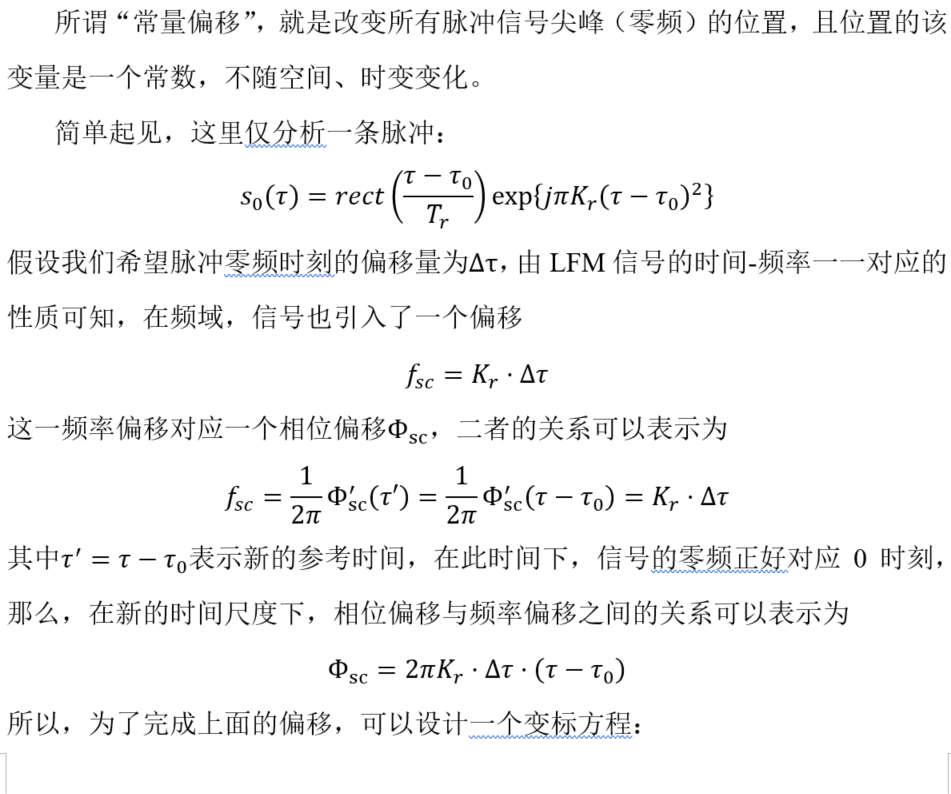
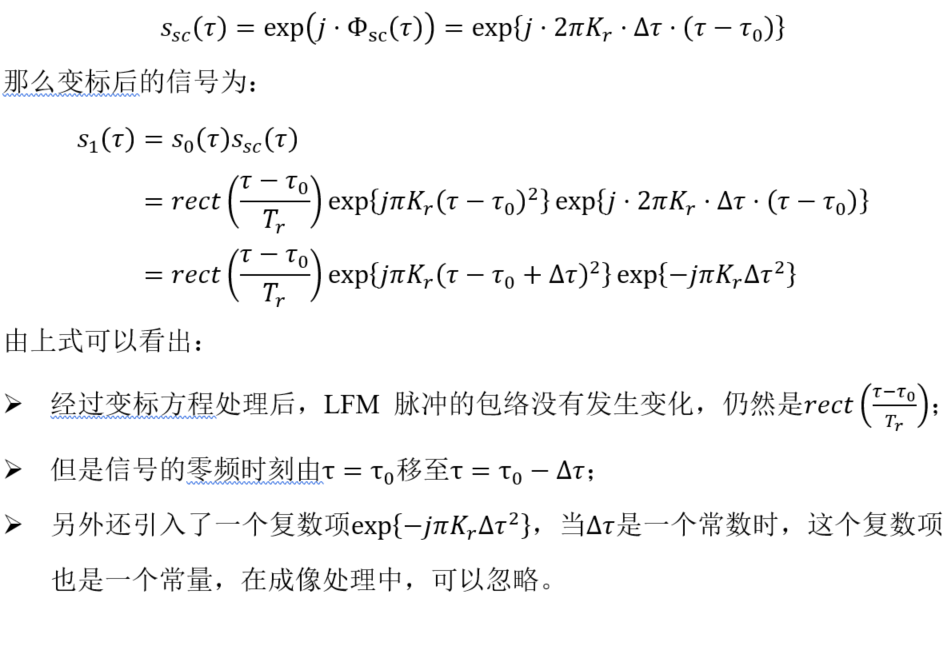
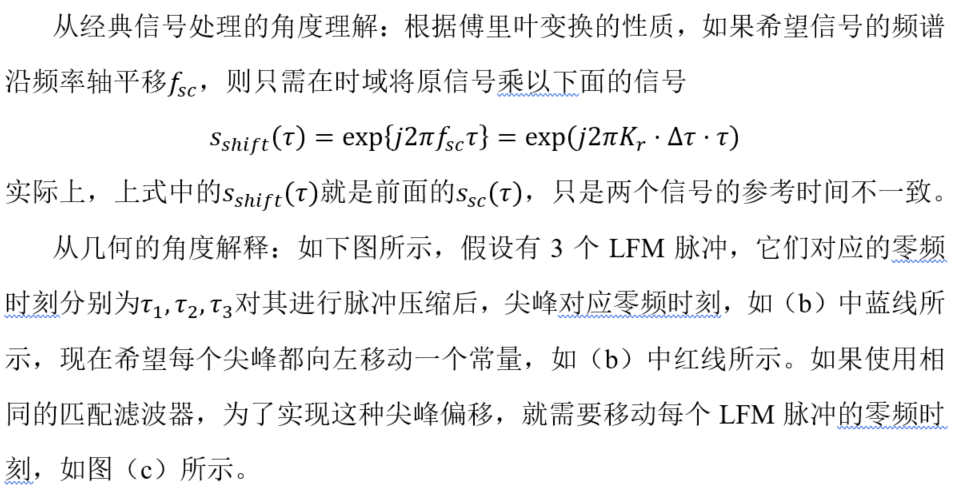
常量漂移
上图对应的matlab代码:
% Chirp Scaling基本原理:常量偏移
close all;clear all;clc;
%% 参数设置
Kr = 100; % 调频率
Fr = 1000; % 采样率
Br = 100; % 信号带宽
Tr = Br/Kr; % 信号持续时间
deltaT = 50/Fr; % 偏移参数
Nr = ceil(Tr/(1/Fr)); % 采样点数
alpha = 0.02; % 变标偏移率
%% 生成信号
t0 = linspace(-Tr/2,Tr/2,Nr); % 时间轴
s0 = exp(1i*pi*Kr*t0.^2); % 原始信号
space1 = zeros(1,Nr/10); % 补零信号
space2 = zeros(1,Nr); % 补零信号
s = [space1,s0,space2,s0,space2,s0,space1]; % 合成信号
N = length(s); % 信号长度
t = linspace(-N/Fr/2,N/Fr/2,N); % 时间轴
f = linspace(-Fr/2,Fr/2-Fr/N,N); % 频率轴
n = 0:N-1; % 采样点轴
s_sc = exp(1i*2*pi*Kr*t*deltaT); % 变标方程
s1 = s.*s_sc; % 变标相乘
%% 脉冲压缩
S = fftshift(fft(fftshift(s))); % 合成信号做fft
S1 = fftshift(fft(fftshift(s1))); % 变标后的信号做fft
Hf = exp(1i*pi*f.^2/Kr); % 频率滤波器
out = fftshift(ifft(fftshift(S.*Hf))); % 原始信号的压缩结果
out1 = fftshift(ifft(fftshift(S1.*Hf))); % 变标后信号的压缩结果
figure(1),set(gcf,'Color','w');
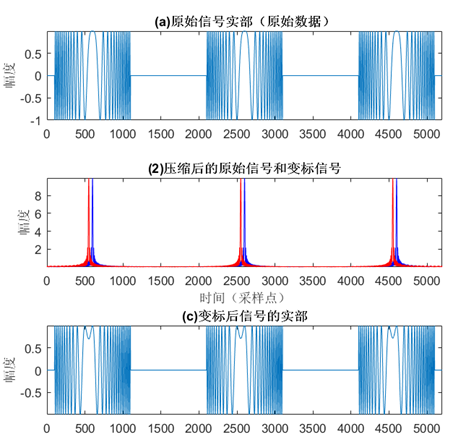
subplot(4,1,1),plot(n,real(s)),axis tight
title('(a)原始信号实部(原始数据)');ylabel('幅度');
subplot(4,1,4),plot(n,real(s_sc)),axis tight
title('(d)变标方程实部');ylabel('幅度');
subplot(4,1,3),plot(n,real(s1)),axis tight
title('(c)变标后信号的实部');ylabel('幅度');
subplot(4,1,2),plot(n,abs(out),'b',n,abs(out1),'r'),axis tight
title('(2)压缩后的原始信号和变标信号');xlabel('时间(采样点)');ylabel('幅度');

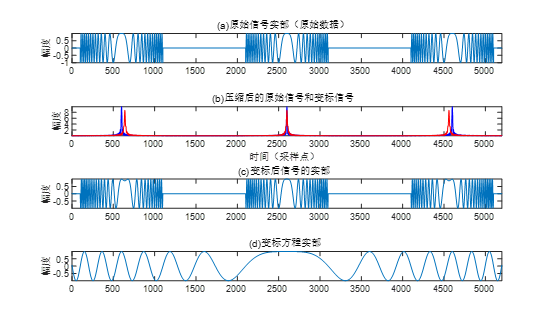
随距离线性变化的漂移


上图对应的代码如下:
%Chirp Scaling基本原理:线性偏移
% SMY 2016.09.08

close all;clear all;clc;

%% 参数设置
Kr = 100;                                   % 调频率
Fr = 1000;                                  % 采样率
Br = 100;                                   % 信号带宽
Tr = Br/Kr;                                 % 信号持续时间
deltaT = 50/Fr;                             % 偏移参数
Nr = ceil(Tr/(1/Fr));                       % 采样点数
alpha = 0.02;                               % 变标偏移率

%% 生成信号
t0 = linspace(-Tr/2,Tr/2,Nr);               % 时间轴
s0 = exp(1i*pi*Kr*t0.^2);                   % 原始信号
space1 = zeros(1,Nr/10);                    % 补零信号
space2 = zeros(1,Nr);                       % 补零信号
s = [space1,s0,space2,s0,space2,s0,space1]; % 合成信号
N = length(s);                              % 信号长度
t = linspace(-N/Fr/2,N/Fr/2,N);             % 时间轴
f = linspace(-Fr/2,Fr/2-Fr/N,N);            % 频率轴
n = 0:N-1;                                  % 采样点轴
s_sc = exp(1i*pi*alpha*Kr*t.^2);            % 变标方程
s1 = s.*s_sc;                               % 变标相乘

%% 脉冲压缩
S = fftshift(fft(fftshift(s)));             % 合成信号做fft
S1 = fftshift(fft(fftshift(s1)));           % 变标后的信号做fft
Hf = exp(1i*pi*f.^2/Kr);                    % 频率滤波器

out = fftshift(ifft(fftshift(S.*Hf)));      % 原始信号的压缩结果
out1 = fftshift(ifft(fftshift(S1.*Hf)));    % 变标后信号的压缩结果

figure(1),set(gcf,'Color','w');
subplot(4,1,1),plot(n,real(s)),axis tight
title('(a)原始信号实部(原始数据)');ylabel('幅度');
subplot(4,1,4),plot(n,real(s_sc)),axis tight
title('(d)变标方程实部');ylabel('幅度');
subplot(4,1,3),plot(n,real(s1)),axis tight
title('(c)变标后信号的实部');ylabel('幅度');
subplot(4,1,2),plot(n,abs(out),'b',n,abs(out1),'r'),axis tight
title('(b)压缩后的原始信号和变标信号');
xlabel('时间(采样点)');ylabel('幅度');
本博客上传的所有原创类资料,仅可用于个人学习、交流等非商业性用途。未经作者同意,不可用于任何商业用途。
如在文献、报告等文字材料中引用本博客发布的原创类资料,请注明出处。


 1880
1880


 被折叠的 条评论
为什么被折叠?
被折叠的 条评论
为什么被折叠?
 到【灌水乐园】发言


