


【C/C++ 集成内存调试、内存泄漏检测和性能分析的工具 Valgrind 】Linux 下 Valgrind 工具的全面使用指南 - 知乎 (zhihu.com)
使用Valgrind工具套件中的Massif监测C++程序堆内存使用-CSDN博客
堆问题分析的利器——valgrind的massif_valgrind massif-CSDN博客
Massif是Valgrind的一个工具,主要用于分析程序在运行过程中的堆内存使用情况。它可以帮助开发者找出程序在运行过程中消耗过多内存的问题,尤其在程序结束后内存能正常释放,但运行过程中内存持续增长的情况下。
Massif的基本使用
massif工具使用
sudo apt install massif-visualizer
运行: massif-visualizer {massiflog} #--massif-out-file=/xxx.log
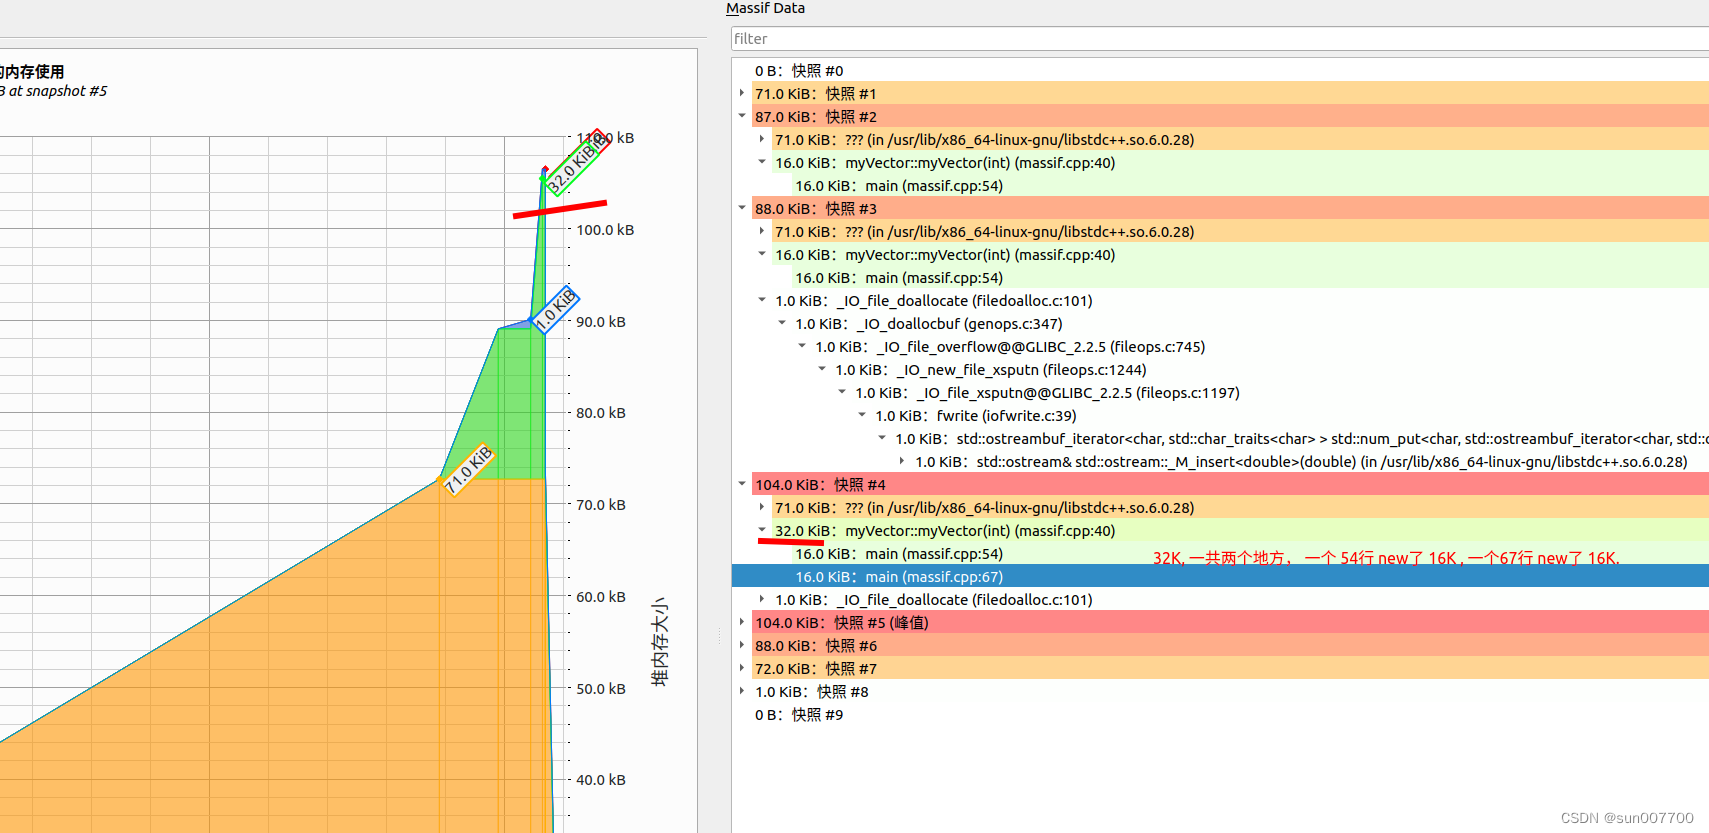
之后会生成一个很炫酷的图片
使用 --pages-as-heap 选项
这个选项会让 Massif 把所有的内存页都当作堆来处理,这可以让你看到所有的内存分配,而不仅仅是通过 malloc、new 等函数分配的内存:
时间轴: i指令为时间轴; ms为时间轴; B:累计涉及内存malloc free的内存都进行累加;
valgrind -v --tool=massif --threshold=0.000001 --time-unit=ms --detailed-freq=1 --massif-out-file=massif-2.log ./memroy
valgrind -v --tool=massif --threshold=0.000001 --time-unit=ms --detailed-freq=1 --massif-out-file=massif-2.log --pages-as-heap=yes ./memroy
valgrind -v --tool=massif --time-unit=ms --detailed-freq=1 --massif-out-file={massif_log_path} {run_exec_cmd}
valgrind -v --tool=massif --time-unit=B --detailed-freq=1 --massif-out-file=/xxx/xxx.log ./xxxx
C++内存使用统计工具(Valgrind之massif)_massif-visualizer-CSDN博客
valgrind -v --tool=massif --threshold=0.000001 --time-unit=ms --detailed-freq=1 --massif-out-file=massif.log --extra-debuginfo-path=/mnt/lib64 --pages-as-heap=yes ./xxx
#windows上查看 需要 安装远程桌面
sudo apt install xrdp

sudo sed -i 's/port=3389/port=3390/g' /etc/xrdp/xrdp.ini  # 将远程桌面端口修改为3390

sudo echo xfce4-session >~/.xsession

sudo service xrdp start  # 每次需要远程连接时,需要执行的命令,可在网上查找设置成自启动命名

sudo apt install xfce4
display manager选择 gdm3 或 lightdm 均可。

valgrind --tool=massif --time-unit=ms ./Xxxx
massif-visualizer massif.out.1132#include <iostream>
using namespace std;
class myVector
{
private:
double *ele;
int size;
public:
myVector(int sz);
~myVector();
double& operator[](int i)
{
if (i < 0 || i >= size)
{
throw "Index out of range";
}
return ele[i];
}
double operator[](int i) const
{
if (i < 0 || i >= size)
{
throw "Index out of range";
}
return ele[i];
}
int getSize() const
{
return size;
}
};
myVector::myVector(int sz) : size(sz)
{
ele = new double[size];
for (int i = 0; i < size; i++)
{
ele[i] = 0;
}
}
myVector::~myVector()
{
delete[] ele;
}
int main()
{
myVector v(2048);
v[0] = 1.0;
v[1] = 2.0;
v[2] = 3.0;
v[3] = 4.0;
v[4] = 5.0;
for (int i = 0; i < 5; i++)
{
cout << v[i] << " ";
}
cout << endl;
myVector v2(2048);
cout << v2.getSize() << endl;
return 0;
}
注:如果程序是长时间持续运行的,可考虑终端命令行中,向该进程发送SIGINT(ctrl+c)信号。
kill -SIGINT pid
valgrind massif 详解(内存分配释放分析)_valgrind --tool=massif-CSDN博客
# 是否对 malloc, new, free, delete 等动态分配内存的函数进行采样? 默认采样;
--heap=<yes|no> [default: yes]
Specifies whether heap profiling should be done.

# 如何指定内存分配对齐
--heap-admin=<size> [default: 8]
If heap profiling is enabled, gives the number of administrative bytes per block to use. This should be an estimate of the average, since it may vary. For example, the allocator used by glibc on Linux requires somewhere between 4 to 15 bytes per block, depending on various factors. That allocator also requires admin space for freed blocks, but Massif cannot account for this.

# 栈上内存是否也进行跟踪: 临时变量内存分配释放;
--stacks=<yes|no> [default: no]
Specifies whether stack profiling should be done. This option slows Massif down greatly, and so is off by default. Note that Massif assumes that the main stack has size zero at start-up. This is not true, but doing otherwise accurately is difficult. Furthermore, starting at zero better indicates the size of the part of the main stack that a user program actually has control over.


--pages-as-heap=<yes|no> [default: no]
Tells Massif to profile memory at the page level rather than at the malloc'd block level. See above for details.

# 最大堆栈数量
--depth=<number> [default: 30]
Maximum depth of the allocation trees recorded for detailed snapshots. Increasing it will make Massif run somewhat more slowly, use more memory, and produce bigger output files.

# 添加其他内存分配函数: 分配函数实际是 brk 系统调用, 也可以自己写一个分配器; 不用 glibc 的 malloc, free
--alloc-fn=<name>
Functions specified with this option will be treated as though they were a heap allocation function such as malloc. This is useful for functions that are wrappers to malloc or new, which can fill up the allocation trees with uninteresting information. This option can be specified multiple times on the command line, to name multiple functions.

Note that the named function will only be treated this way if it is the top entry in a stack trace, or just below another function treated this way. For example, if you have a function malloc1 that wraps malloc, and malloc2 that wraps malloc1, just specifying --alloc-fn=malloc2 will have no effect. You need to specify --alloc-fn=malloc1 as well. This is a little inconvenient, but the reason is that checking for allocation functions is slow, and it saves a lot of time if Massif can stop looking through the stack trace entries as soon as it finds one that doesn't match rather than having to continue through all the entries.

Note that C++ names are demangled. Note also that overloaded C++ names must be written in full. Single quotes may be necessary to prevent the shell from breaking them up. For example:

--alloc-fn='operator new(unsigned, std::nothrow_t const&)'
--ignore-fn=<name>
Any direct heap allocation (i.e. a call to malloc, new, etc, or a call to a function named by an --alloc-fn option) that occurs in a function specified by this option will be ignored. This is mostly useful for testing purposes. This option can be specified multiple times on the command line, to name multiple functions.

Any realloc of an ignored block will also be ignored, even if the realloc call does not occur in an ignored function. This avoids the possibility of negative heap sizes if ignored blocks are shrunk with realloc.

The rules for writing C++ function names are the same as for --alloc-fn above.

# 控制输出详细信息的阈值
--threshold=<m.n> [default: 1.0]
The significance threshold for heap allocations, as a percentage of total memory size. Allocation tree entries that account for less than this will be aggregated. Note that this should be specified in tandem with ms_print's option of the same name.

--peak-inaccuracy=<m.n> [default: 1.0]
Massif does not necessarily record the actual global memory allocation peak; by default it records a peak only when the global memory allocation size exceeds the previous peak by at least 1.0%. This is because there can be many local allocation peaks along the way, and doing a detailed snapshot for every one would be expensive and wasteful, as all but one of them will be later discarded. This inaccuracy can be changed (even to 0.0%) via this option, but Massif will run drastically slower as the number approaches zero.

# x轴的单位: i: 指令, 一行指令 x + 1; ms 按毫秒 + 1, B: 按malloc free的总字节数 + 1, 某个节点的 x 坐标位置表示当前采样前 malloc 和 free的内存总量, 如下案例;
--time-unit=<i|ms|B> [default: i]
The time unit used for the profiling. There are three possibilities: instructions executed (i), which is good for most cases; real (wallclock) time (ms, i.e. milliseconds), which is sometimes useful; and bytes allocated/deallocated on the heap and/or stack (B), which is useful for very short-run programs, and for testing purposes, because it is the most reproducible across different machines.

# 详细采样频率: 默认10; 每次都采样可以设置为 1, 更多的内容, 但是有很多可能重复的, 但是更加详细, 推荐;
--detailed-freq=<n> [default: 10]
Frequency of detailed snapshots. With --detailed-freq=1, every snapshot is detailed.

# 最大采样数量: 超过会丢弃之前的, 可以设置大一点;
--max-snapshots=<n> [default: 100]
The maximum number of snapshots recorded. If set to N, for all programs except very short-running ones, the final number of snapshots will be between N/2 and N.

# 输出文件名; 不推荐修改, 推荐默认;
--massif-out-file=<file> [default: massif.out.%p]
Write the profile data to file rather than to the default output file, massif.out.<pid>. The %p and %q format specifiers can be used to embed the process ID and/or the contents of an environment variable in the name, as is the case for the core option --log-file.


 9962
9962


 被折叠的 条评论
为什么被折叠?
被折叠的 条评论
为什么被折叠?
 到【灌水乐园】发言


