


 超级会员免费看
一、基础饼图绘制(Matplotlib)
1. 环境准备
pip install matplotlib numpy2. 基础饼图代码
import matplotlib.pyplot as plt
# 数据准备
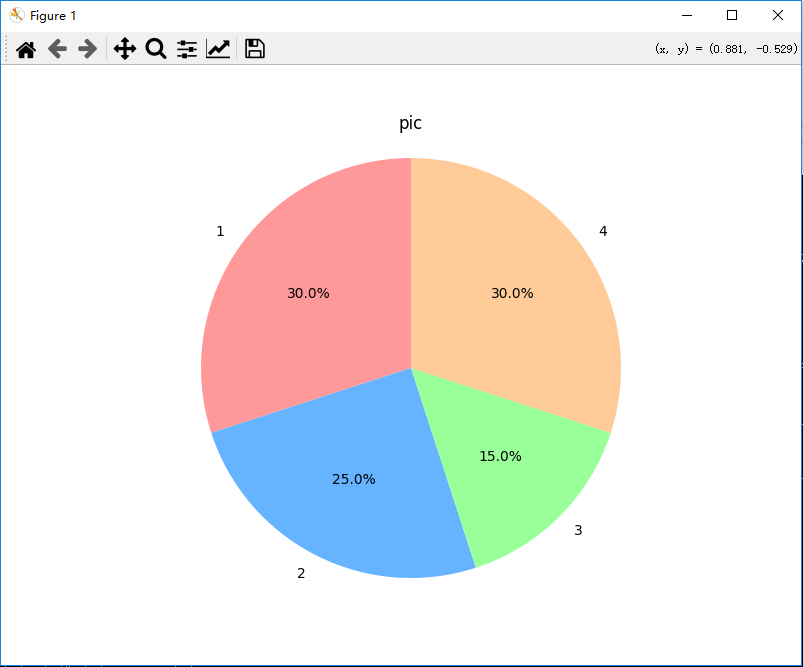
labels = ['1', '2', '3', '4']
sizes = [30, 25, 15, 30] # 各部分占比(总和建议100)
colors = ['#ff9999','#66b3ff','#99ff99','#ffcc99'] # 自定义颜色
plt.figure(figsize=(8, 6)) # 设置画布大小
# 绘制饼图
plt.pie(
sizes,
labels=labels,
colors=colors,
autopct='%1.1f%%', # 显示百分比格式
startangle=90 # 起始角度
)
plt.title("pic
 订阅专栏 解锁全文


 3270
3270

 被折叠的 条评论
为什么被折叠?
被折叠的 条评论
为什么被折叠?
 到【灌水乐园】发言


