Demo主要实现了一下几点功能
1.折线图 + stroke动画 + 可左右滚动
2.虚线标注
3.渐变蒙层填充
4.小圆点展示 + 点击放大动画
如果以上效果有满足您当前需要请往下看
拆分界面
调用示例
- (NXLineChartView * )chartView{
if (!_chartView) {
_chartView = [[NXLineChartView alloc]init]
_chartView.backgroundColor = [UIColor whiteColor]
_chartView.center = CGPointMake([UIScreen mainScreen].bounds.size.width/2, [UIScreen mainScreen].bounds.size.height/2)
_chartView.bounds = CGRectMake(0, 0, [UIScreen mainScreen].bounds.size.width-100, 200)
_chartView.lineChartXLabelArray = @[@"魅族",@"华为",@"中兴",@"小米",@"苹果",@"一加",@"乐视",@"音乐",@"电视",@"体育"]
_chartView.lineChartYLabelArray = @[]
_chartView.LineChartDataArray = @[@100,@40,@60,@45,@100,@55,@33,@120,@40,@100]
}
return _chartView
}
#import <UIKit/UIKit.h>
@interface NXLineChartView : UIView
@property (nonatomic, strong) NSArray * lineChartYLabelArray;
@property (nonatomic, strong) NSArray * lineChartXLabelArray;
@property (nonatomic, strong) NSArray * LineChartDataArray;
@end
1.画折线,这里通过UIBezierPath和CAShapeLayer结合绘图
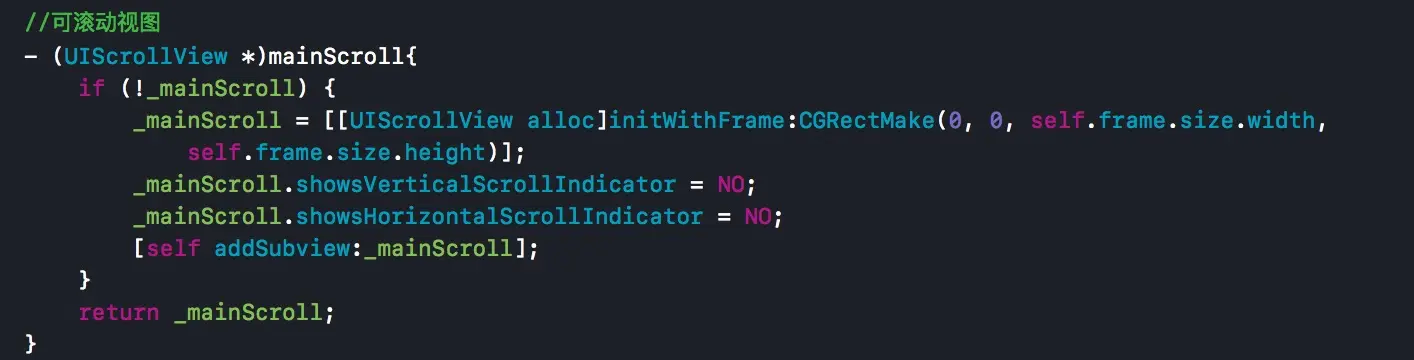
- (UIScrollView *)mainScroll{
if (!_mainScroll) {
_mainScroll = [[UIScrollView alloc]initWithFrame:CGRectMake(0, 0, self.frame.size.width, self.frame.size.height)];
_mainScroll.showsVerticalScrollIndicator = NO;
_mainScroll.showsHorizontalScrollIndicator = NO;
[self addSubview:_mainScroll];
}
return _mainScroll;
}
通过LineChartDataArray获得的数据,进行绘制
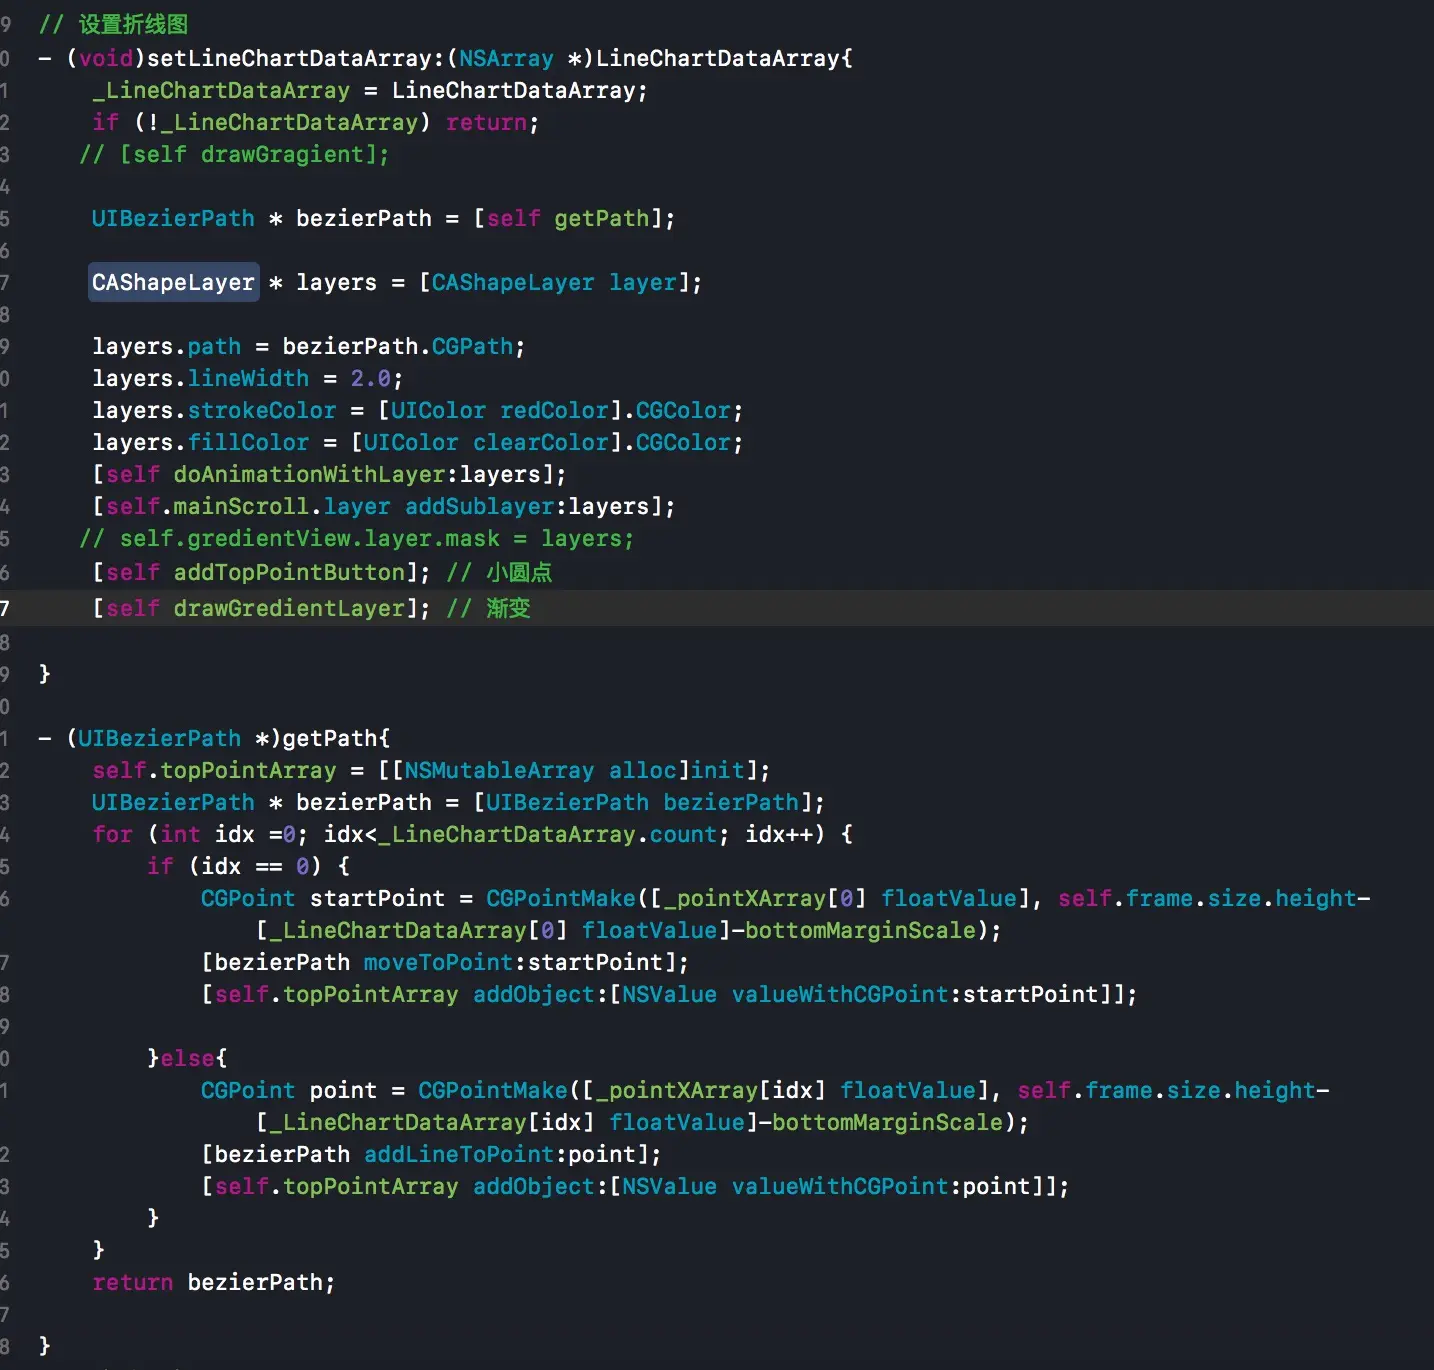
- (void)setLineChartDataArray:(NSArray *)LineChartDataArray{
_LineChartDataArray = LineChartDataArray;
if (!_LineChartDataArray) return;
UIBezierPath * bezierPath = [self getPath];
CAShapeLayer * layers = [CAShapeLayer layer];
layers.path = bezierPath.CGPath;
layers.lineWidth = 2.0;
layers.strokeColor = [UIColor redColor].CGColor;
layers.fillColor = [UIColor clearColor].CGColor;
[self doAnimationWithLayer:layers];
[self.mainScroll.layer addSublayer:layers];
[self addTopPointButton];
[self drawGredientLayer];
}
- (UIBezierPath *)getPath{
self.topPointArray = [[NSMutableArray alloc]init];
UIBezierPath * bezierPath = [UIBezierPath bezierPath];
for (int idx =0; idx<_LineChartDataArray.count; idx++) {
if (idx == 0) {
CGPoint startPoint = CGPointMake([_pointXArray[0] floatValue], self.frame.size.height-[_LineChartDataArray[0] floatValue]-bottomMarginScale);
[bezierPath moveToPoint:startPoint];
[self.topPointArray addObject:[NSValue valueWithCGPoint:startPoint]];
}else{
CGPoint point = CGPointMake([_pointXArray[idx] floatValue], self.frame.size.height-[_LineChartDataArray[idx] floatValue]-bottomMarginScale);
[bezierPath addLineToPoint:point];
[self.topPointArray addObject:[NSValue valueWithCGPoint:point]];
}
}
return bezierPath;
}
线条动画采用核心动画strokeEnd这个效果实现,代码如下
- (void)doAnimationWithLayer:(CAShapeLayer *)layer{
CABasicAnimation * baseAnimation = [CABasicAnimation animationWithKeyPath:@"strokeEnd"]
baseAnimation.duration = 2
baseAnimation.fromValue = @0.0
baseAnimation.toValue = @1.0
baseAnimation.repeatCount = 1
[layer addAnimation:baseAnimation forKey:@"strokeAnimation"]
}
2.虚线标注
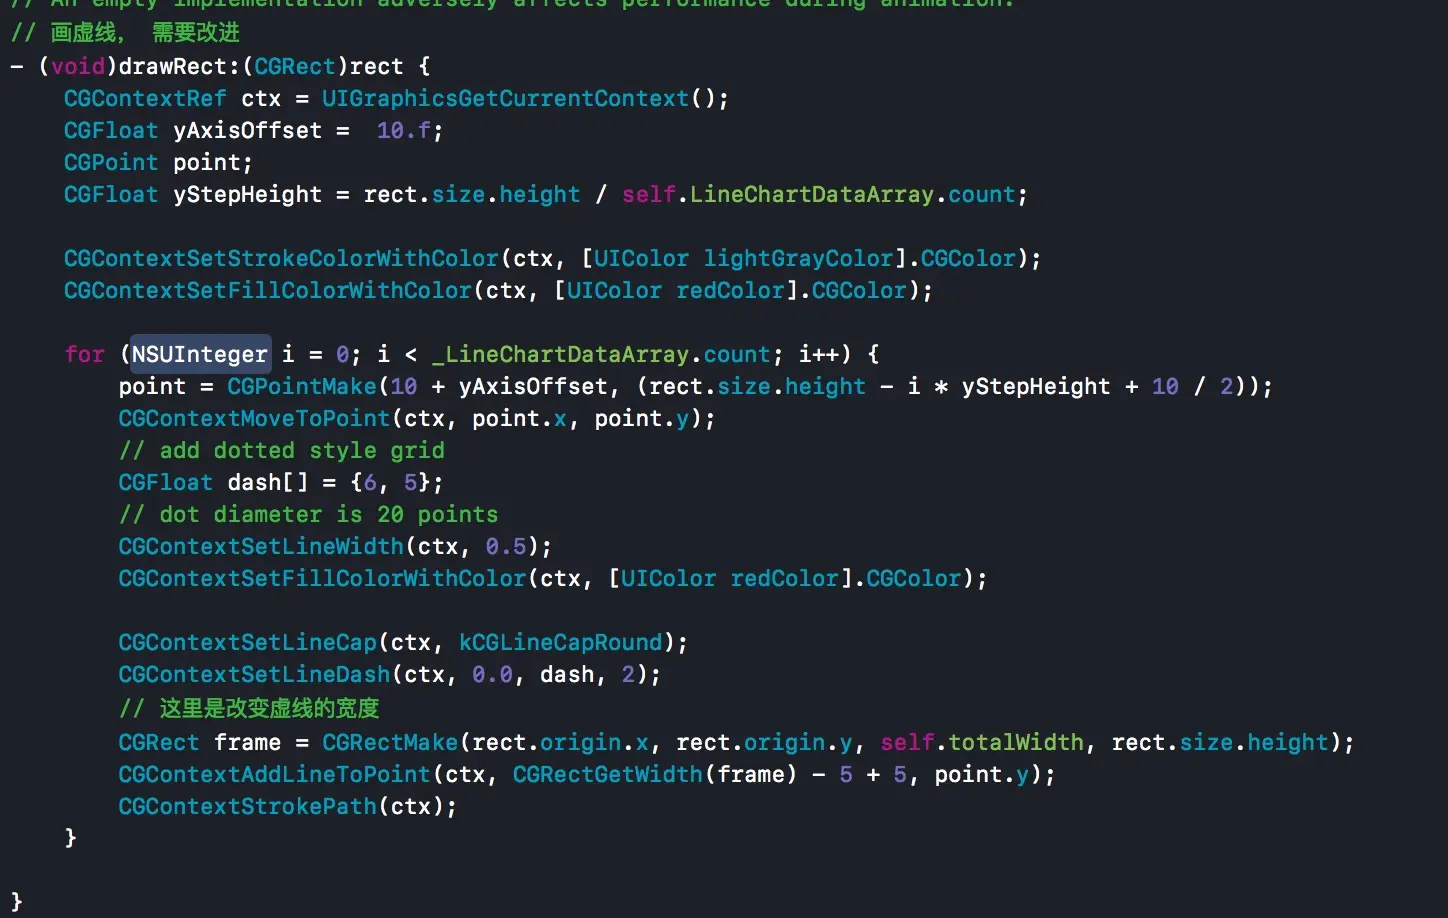
- (void)drawRect:(CGRect)rect {
CGContextRef ctx = UIGraphicsGetCurrentContext()
CGFloat yAxisOffset = 10.f
CGPoint point
CGFloat yStepHeight = rect.size.height / self.LineChartDataArray.count
CGContextSetStrokeColorWithColor(ctx, [UIColor lightGrayColor].CGColor)
CGContextSetFillColorWithColor(ctx, [UIColor redColor].CGColor)
for (NSUInteger i = 0
point = CGPointMake(10 + yAxisOffset, (rect.size.height - i * yStepHeight + 10 / 2))
CGContextMoveToPoint(ctx, point.x, point.y)
// add dotted style grid
CGFloat dash[] = {6, 5}
// dot diameter is 20 points
CGContextSetLineWidth(ctx, 0.5)
CGContextSetFillColorWithColor(ctx, [UIColor redColor].CGColor)
CGContextSetLineCap(ctx, kCGLineCapRound)
CGContextSetLineDash(ctx, 0.0, dash, 2)
// 这里是改变虚线的宽度
CGRect frame = CGRectMake(rect.origin.x, rect.origin.y, self.totalWidth, rect.size.height)
CGContextAddLineToPoint(ctx, CGRectGetWidth(frame) - 5 + 5, point.y)
CGContextStrokePath(ctx)
}
}
3.渐变蒙层填充
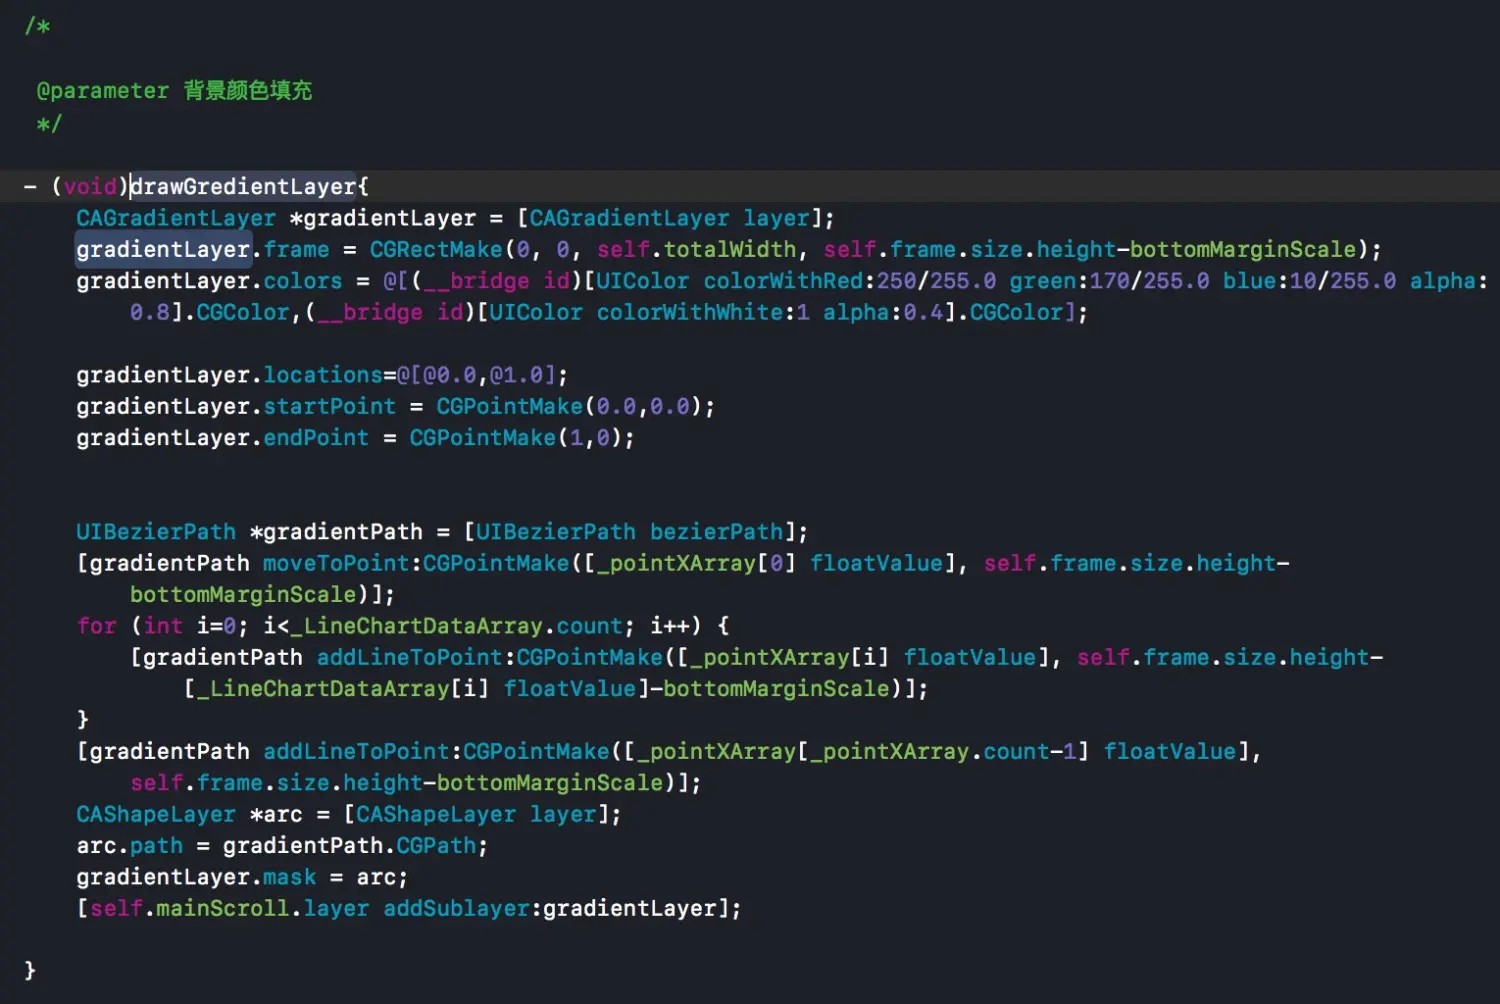
- (void)drawGredientLayer{
CAGradientLayer *gradientLayer = [CAGradientLayer layer]
gradientLayer.frame = CGRectMake(0, 0, self.totalWidth, self.frame.size.height-bottomMarginScale)
gradientLayer.colors = @[(__bridge id)[UIColor colorWithRed:250/255.0 green:170/255.0 blue:10/255.0 alpha:0.8].CGColor,(__bridge id)[UIColor colorWithWhite:1 alpha:0.4].CGColor]
gradientLayer.locations=@[@0.0,@1.0]
gradientLayer.startPoint = CGPointMake(0.0,0.0)
gradientLayer.endPoint = CGPointMake(1,0)
UIBezierPath *gradientPath = [UIBezierPath bezierPath]
[gradientPath moveToPoint:CGPointMake([_pointXArray[0] floatValue], self.frame.size.height-bottomMarginScale)]
for (int i=0
[gradientPath addLineToPoint:CGPointMake([_pointXArray[i] floatValue], self.frame.size.height-[_LineChartDataArray[i] floatValue]-bottomMarginScale)]
}
[gradientPath addLineToPoint:CGPointMake([_pointXArray[_pointXArray.count-1] floatValue], self.frame.size.height-bottomMarginScale)]
CAShapeLayer *arc = [CAShapeLayer layer]
arc.path = gradientPath.CGPath
gradientLayer.mask = arc
[self.mainScroll.layer addSublayer:gradientLayer]
}
4.小圆点展示 + 点击放大动画
小圆点
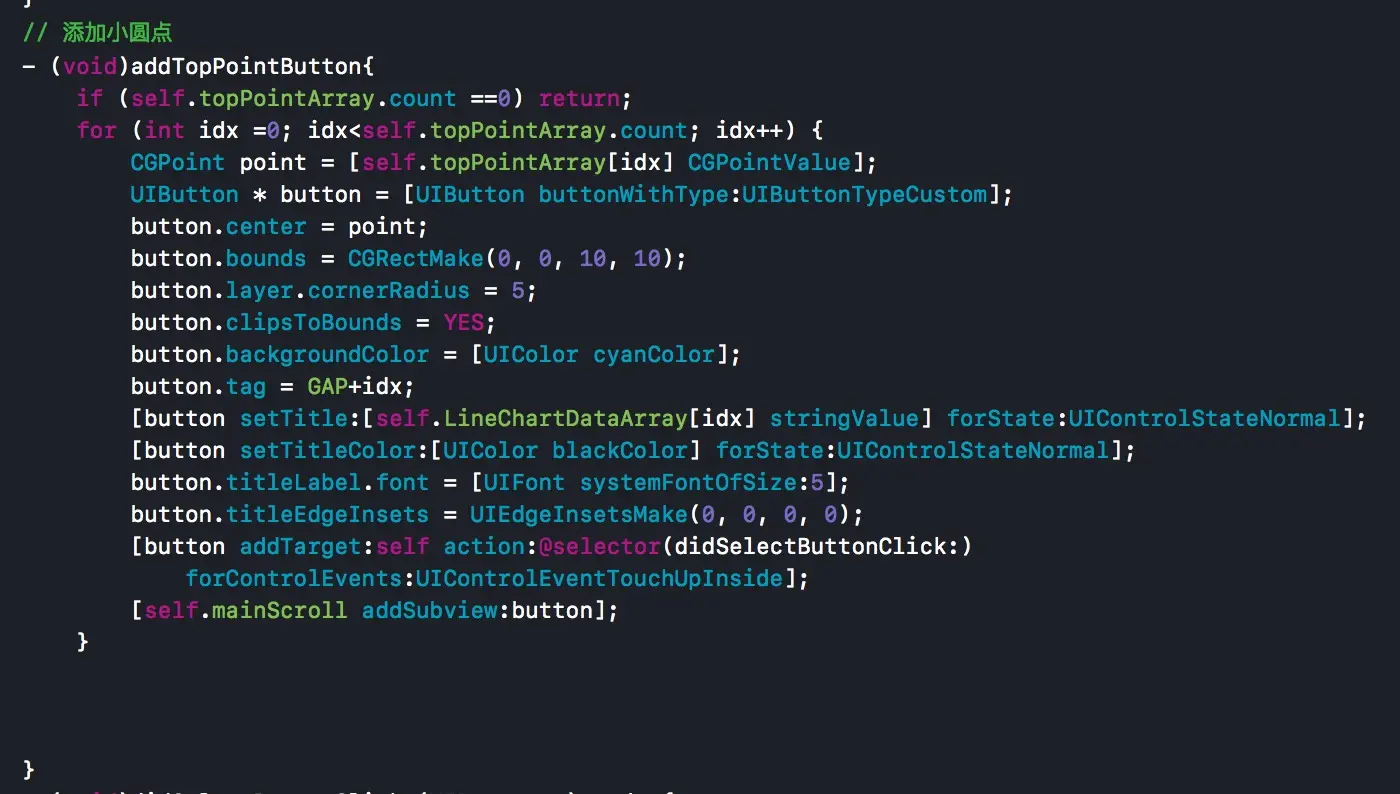
- (void)addTopPointButton{
if (self.topPointArray.count ==0) return;
for (int idx =0; idx<self.topPointArray.count; idx++) {
CGPoint point = [self.topPointArray[idx] CGPointValue];
UIButton * button = [UIButton buttonWithType:UIButtonTypeCustom];
button.center = point;
button.bounds = CGRectMake(0, 0, 10, 10);
button.layer.cornerRadius = 5;
button.clipsToBounds = YES;
button.backgroundColor = [UIColor cyanColor];
button.tag = GAP+idx;
[button setTitle:[self.LineChartDataArray[idx] stringValue] forState:UIControlStateNormal];
[button setTitleColor:[UIColor blackColor] forState:UIControlStateNormal];
button.titleLabel.font = [UIFont systemFontOfSize:5];
button.titleEdgeInsets = UIEdgeInsetsMake(0, 0, 0, 0);
[button addTarget:self action:@selector(didSelectButtonClick:) forControlEvents:UIControlEventTouchUpInside];
[self.mainScroll addSubview:button];
}
}
小圆点点击放大动画采用核心动画scale
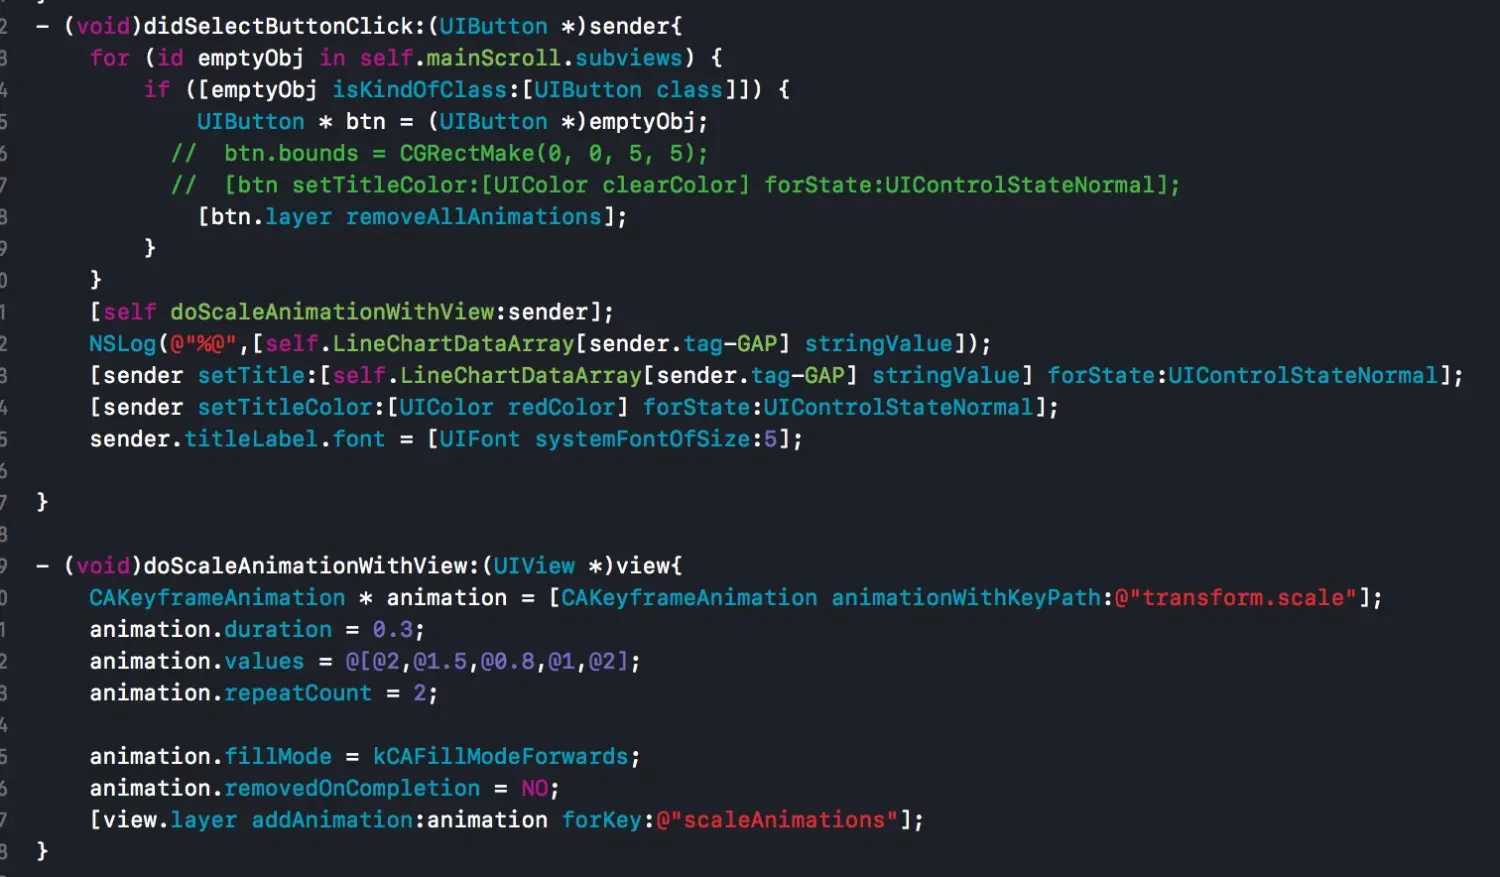
- (void)didSelectButtonClick:(UIButton *)sender{
for (id emptyObj in self.mainScroll.subviews) {
if ([emptyObj isKindOfClass:[UIButton class]]) {
UIButton * btn = (UIButton *)emptyObj
// btn.bounds = CGRectMake(0, 0, 5, 5)
// [btn setTitleColor:[UIColor clearColor] forState:UIControlStateNormal]
[btn.layer removeAllAnimations]
}
}
[self doScaleAnimationWithView:sender]
NSLog(@"%@",[self.LineChartDataArray[sender.tag-GAP] stringValue])
[sender setTitle:[self.LineChartDataArray[sender.tag-GAP] stringValue] forState:UIControlStateNormal]
[sender setTitleColor:[UIColor redColor] forState:UIControlStateNormal]
sender.titleLabel.font = [UIFont systemFontOfSize:5]
}
- (void)doScaleAnimationWithView:(UIView *)view{
CAKeyframeAnimation * animation = [CAKeyframeAnimation animationWithKeyPath:@"transform.scale"]
animation.duration = 0.3
animation.values = @[@2,@1.5,@0.8,@1,@2]
animation.repeatCount = 2
animation.fillMode = kCAFillModeForwards
animation.removedOnCompletion = NO
[view.layer addAnimation:animation forKey:@"scaleAnimations"]
}
底部X坐标轴数据填充
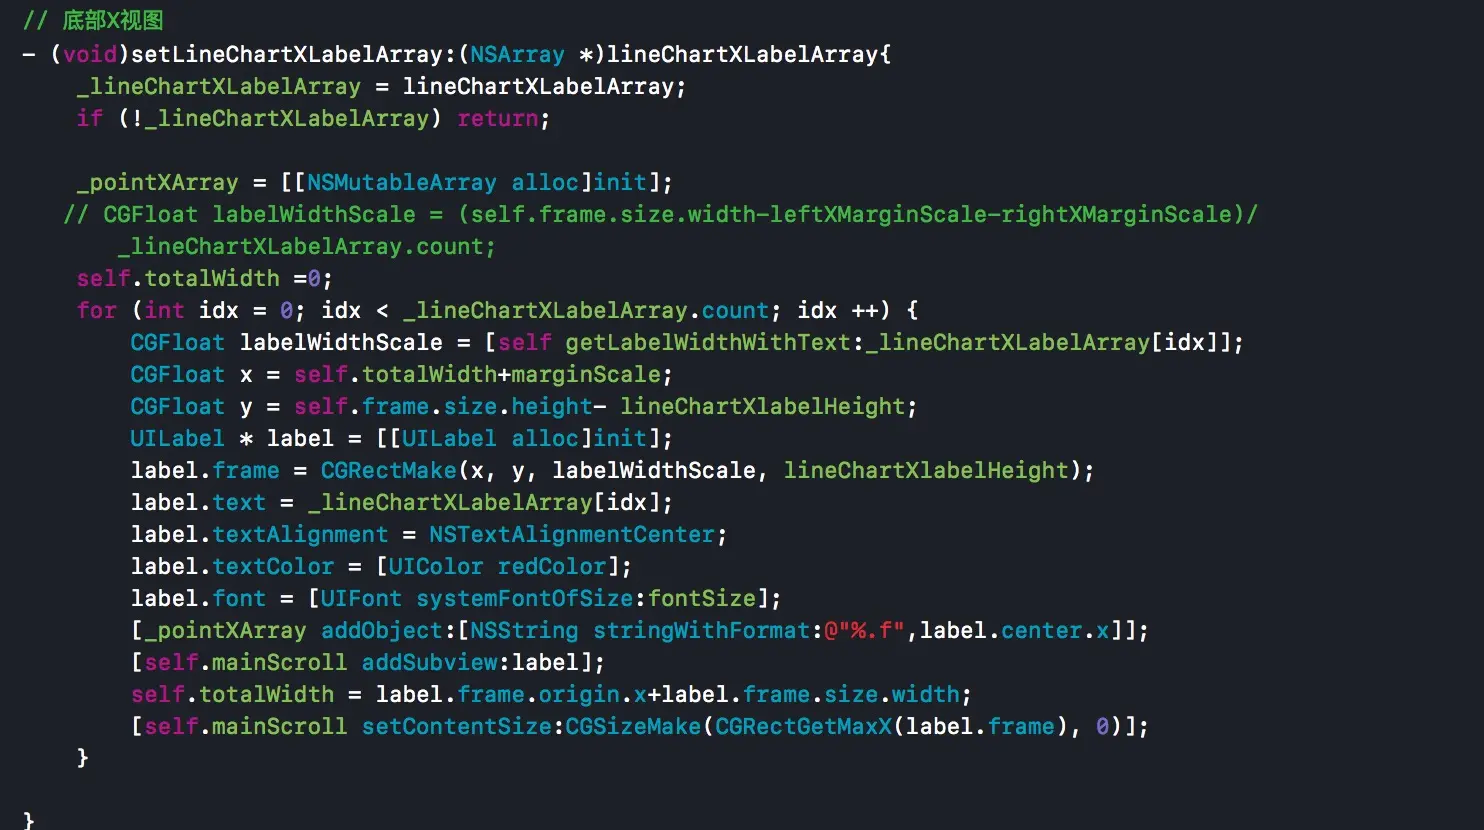
// 底部X视图
- (void)setLineChartXLabelArray:(NSArray *)lineChartXLabelArray{
_lineChartXLabelArray = lineChartXLabelArray
if (!_lineChartXLabelArray) return
_pointXArray = [[NSMutableArray alloc]init]
// CGFloat labelWidthScale = (self.frame.size.width-leftXMarginScale-rightXMarginScale)/_lineChartXLabelArray.count
self.totalWidth =0
for (int idx = 0
CGFloat labelWidthScale = [self getLabelWidthWithText:_lineChartXLabelArray[idx]]
CGFloat x = self.totalWidth+marginScale
CGFloat y = self.frame.size.height- lineChartXlabelHeight
UILabel * label = [[UILabel alloc]init]
label.frame = CGRectMake(x, y, labelWidthScale, lineChartXlabelHeight)
label.text = _lineChartXLabelArray[idx]
label.textAlignment = NSTextAlignmentCenter
label.textColor = [UIColor redColor]
label.font = [UIFont systemFontOfSize:fontSize]
[_pointXArray addObject:[NSString stringWithFormat:@"%.f",label.center.x]]
[self.mainScroll addSubview:label]
self.totalWidth = label.frame.origin.x+label.frame.size.width
[self.mainScroll setContentSize:CGSizeMake(CGRectGetMaxX(label.frame), 0)]
}
}
再看下调用示例比较简单
- (NXLineChartView * )chartView{
if (!_chartView) {
_chartView = [[NXLineChartView alloc]init]
_chartView.backgroundColor = [UIColor whiteColor]
_chartView.center = CGPointMake([UIScreen mainScreen].bounds.size.width/2, [UIScreen mainScreen].bounds.size.height/2)
_chartView.bounds = CGRectMake(0, 0, [UIScreen mainScreen].bounds.size.width-100, 200)
_chartView.lineChartXLabelArray = @[@"魅族",@"华为",@"中兴",@"小米",@"苹果",@"一加",@"乐视",@"音乐",@"电视",@"体育"]
_chartView.lineChartYLabelArray = @[]
_chartView.LineChartDataArray = @[@100,@40,@60,@45,@100,@55,@33,@120,@40,@100]
}
return _chartView
}
Demo地址


 9722
9722

 被折叠的 条评论
为什么被折叠?
被折叠的 条评论
为什么被折叠?
 到【灌水乐园】发言


