


参考来源
https://scikit-learn.org/stable/auto_examples/applications/plot_tomography_l1_reconstruction.html

代码
# -*- coding: utf-8 -*-
"""
Created on Thu Mar 14 12:34:50 2024
@author: 李立宗
公众号:计算机视觉之光
知识星球:计算机视觉之光
"""
import matplotlib.pyplot as plt
import numpy as np
from scipy import ndimage, sparse
from sklearn.linear_model import Lasso, Ridge
def _weights(x, dx=1, orig=0):
x = np.ravel(x)
floor_x = np.floor((x - orig) / dx).astype(np.int64)
alpha = (x - orig - floor_x * dx) / dx
return np.hstack((floor_x, floor_x + 1)), np.hstack((1 - alpha, alpha))
def _generate_center_coordinates(l_x):
X, Y = np.mgrid[:l_x, :l_x].astype(np.float64)
center = l_x / 2.0
X += 0.5 - center
Y += 0.5 - center
return X, Y
def build_projection_operator(l_x, n_dir):
"""Compute the tomography design matrix.
Parameters
----------
l_x : int
linear size of image array
n_dir : int
number of angles at which projections are acquired.
Returns
-------
p : sparse matrix of shape (n_dir l_x, l_x**2)
"""
X, Y = _generate_center_coordinates(l_x)
angles = np.linspace(0, np.pi, n_dir, endpoint=False)
data_inds, weights, camera_inds = [], [], []
data_unravel_indices = np.arange(l_x**2)
data_unravel_indices = np.hstack((data_unravel_indices, data_unravel_indices))
for i, angle in enumerate(angles):
Xrot = np.cos(angle) * X - np.sin(angle) * Y
inds, w = _weights(Xrot, dx=1, orig=X.min())
mask = np.logical_and(inds >= 0, inds < l_x)
weights += list(w[mask])
camera_inds += list(inds[mask] + i * l_x)
data_inds += list(data_unravel_indices[mask])
proj_operator = sparse.coo_matrix((weights, (camera_inds, data_inds)))
return proj_operator
def generate_synthetic_data():
"""Synthetic binary data"""
rs = np.random.RandomState(0)
n_pts = 36
x, y = np.ogrid[0:l, 0:l]
mask_outer = (x - l / 2.0) ** 2 + (y - l / 2.0) ** 2 < (l / 2.0) ** 2
mask = np.zeros((l, l))
points = l * rs.rand(2, n_pts)
mask[(points[0]).astype(int), (points[1]).astype(int)] = 1
mask = ndimage.gaussian_filter(mask, sigma=l / n_pts)
res = np.logical_and(mask > mask.mean(), mask_outer)
return np.logical_xor(res, ndimage.binary_erosion(res))
# Generate synthetic images, and projections
l = 128
proj_operator = build_projection_operator(l, l // 7)
data = generate_synthetic_data()
proj = proj_operator @ data.ravel()[:, np.newaxis]
proj += 0.15 * np.random.randn(*proj.shape)
# Reconstruction with L2 (Ridge) penalization
rgr_ridge = Ridge(alpha=0.2)
rgr_ridge.fit(proj_operator, proj.ravel())
rec_l2 = rgr_ridge.coef_.reshape(l, l)
# Reconstruction with L1 (Lasso) penalization
# the best value of alpha was determined using cross validation
# with LassoCV
rgr_lasso = Lasso(alpha=0.001)
rgr_lasso.fit(proj_operator, proj.ravel())
rec_l1 = rgr_lasso.coef_.reshape(l, l)
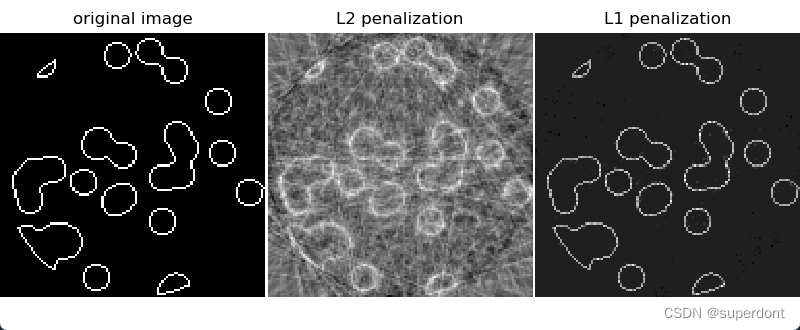
plt.figure(figsize=(8, 3.3))
plt.subplot(131)
plt.imshow(data, cmap=plt.cm.gray, interpolation="nearest")
plt.axis("off")
plt.title("original image")
plt.subplot(132)
plt.imshow(rec_l2, cmap=plt.cm.gray, interpolation="nearest")
plt.title("L2 penalization")
plt.axis("off")
plt.subplot(133)
plt.imshow(rec_l1, cmap=plt.cm.gray, interpolation="nearest")
plt.title("L1 penalization")
plt.axis("off")
plt.subplots_adjust(hspace=0.01, wspace=0.01, top=1, bottom=0, left=0, right=1)
plt.show()
运行结果


 1056
1056


 被折叠的 条评论
为什么被折叠?
被折叠的 条评论
为什么被折叠?
 到【灌水乐园】发言


