


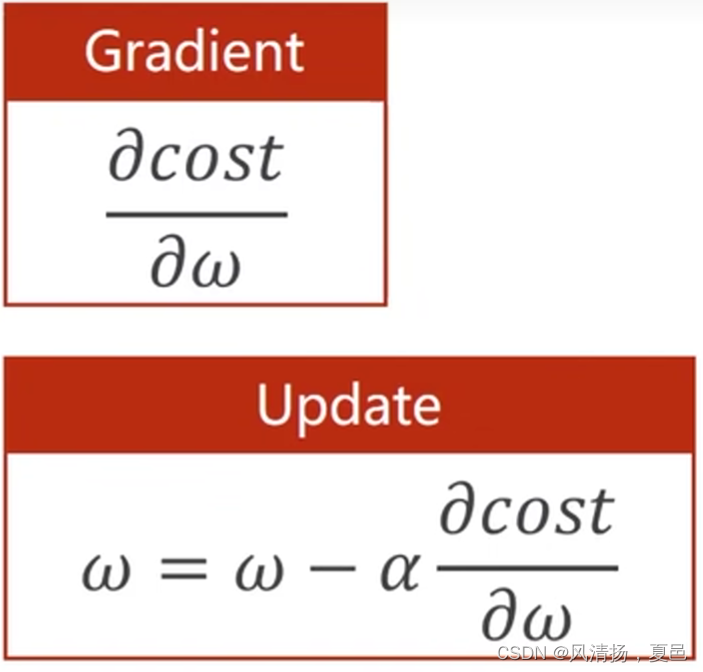
B站刘二大人《PyTorch深度学习实践》第三讲 梯度下降算法 原理以及代码的实现
代码如下:
import matplotlib.pyplot as plt #导入绘图包
x_data = [1.0,2.0,3.0] #初始化数据集
y_data = [2.0,4.0,6.0]
w = 1.0 #定义初始权值w=1.0
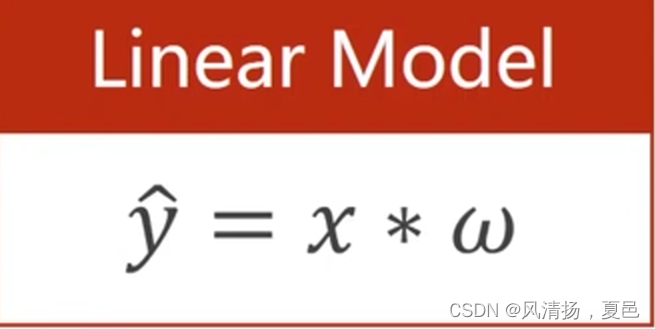
def forward(x):
return x * w #定义线性模型
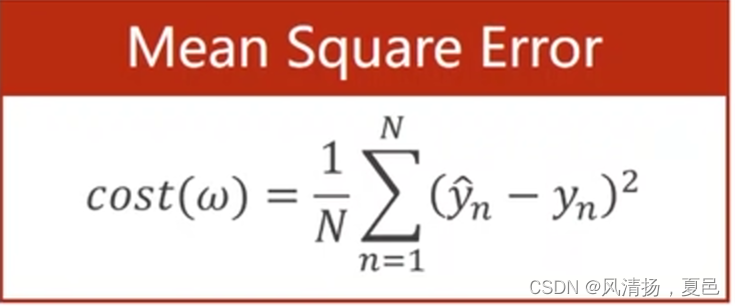
def cost(xs,ys): #定义MSE损失
cost = 0
for x,y in zip(xs,ys): #zip把对应x,y的值进行拼装
y_pred = forward(x)
cost += (y_pred-y) ** 2
return cost/len(xs)
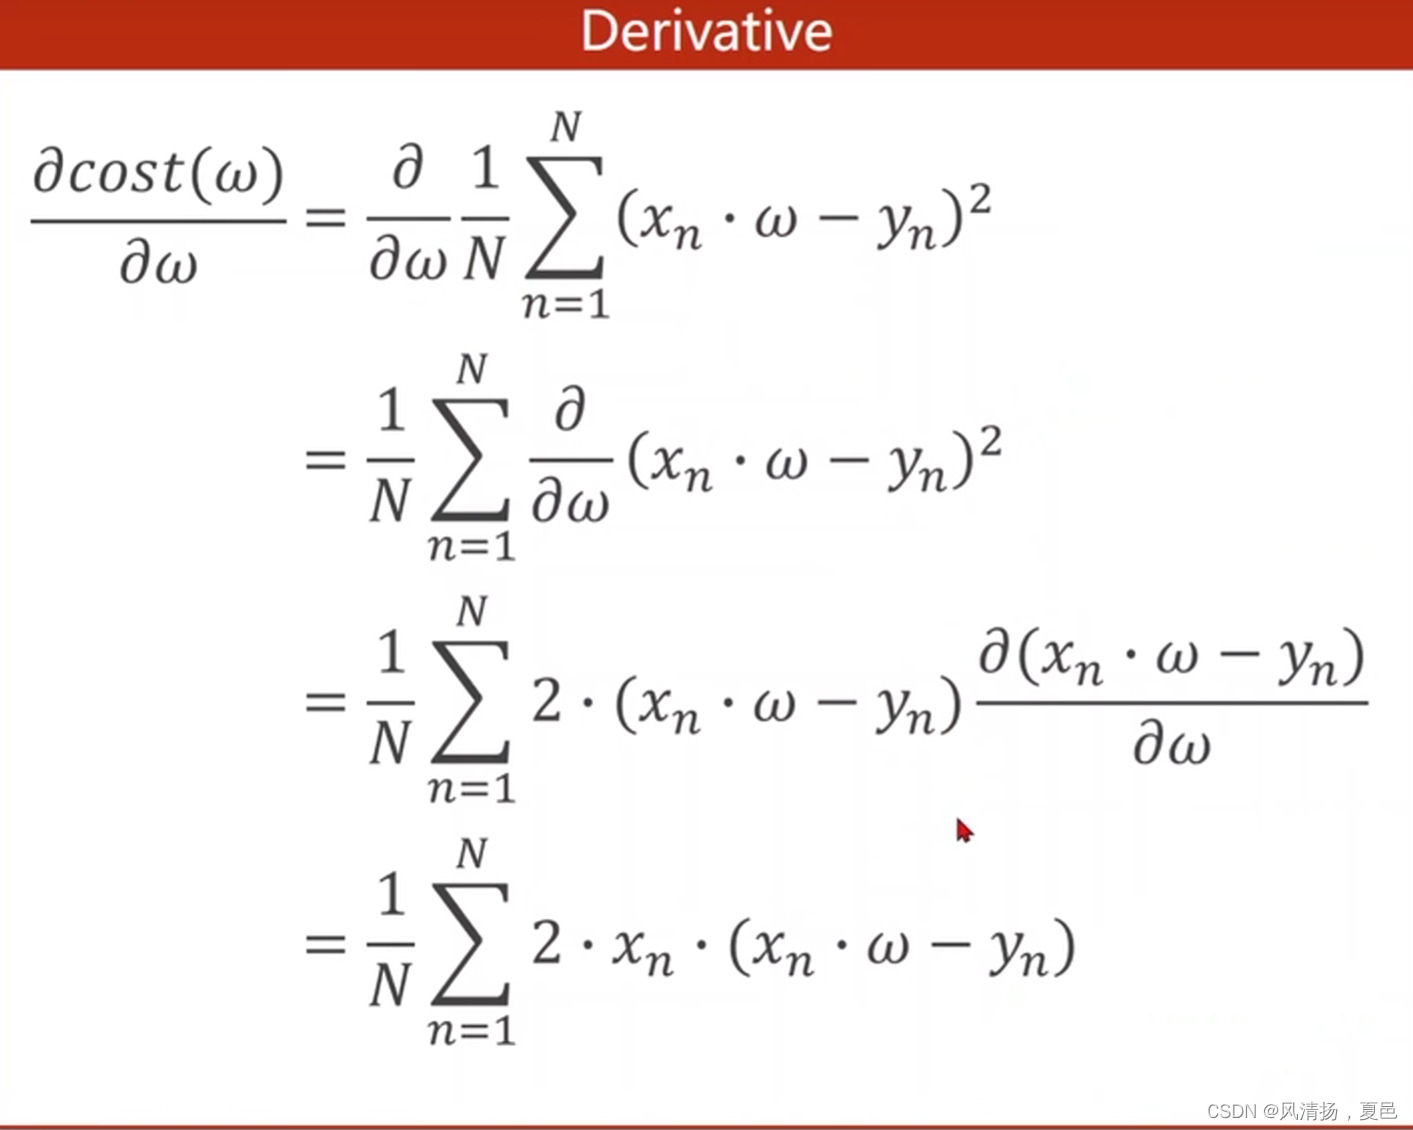
def gradient(xs,ys): #定义梯度函数gd
grad = 0
for x,y in zip(xs,ys):
grad += 2*x*(x*w-y)
return grad/len(xs)
epoch_list = []
cost_list = []
print('predicted (before training)',4,forward(4)) #打印训练之前的预测值
for epoch in range(100): #进行100轮训练
cost_val = cost(x_data,y_data)
grad_val = gradient(x_data,y_data)
w -= 0.01*grad_val #学习率0.01
print('epoch:',epoch,'w=',w,'loss=',cost_val) #训练,打印日志
epoch_list.append(epoch)
cost_list.append(cost_val)
print('predicted (after training)',4,forward(4)) #打印训练之后的预测值
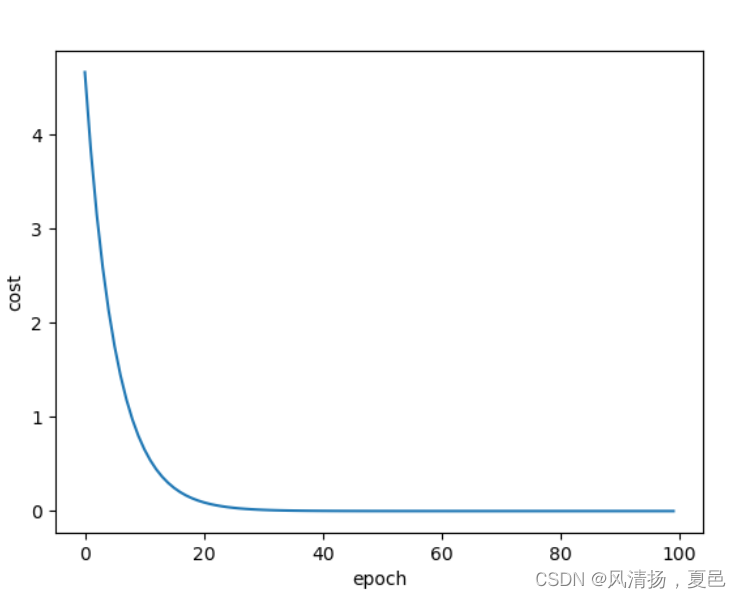
plt.plot(epoch_list,cost_list)
plt.xlabel('epoch')
plt.ylabel('cost')
plt.show()
打印日志及运行结果:
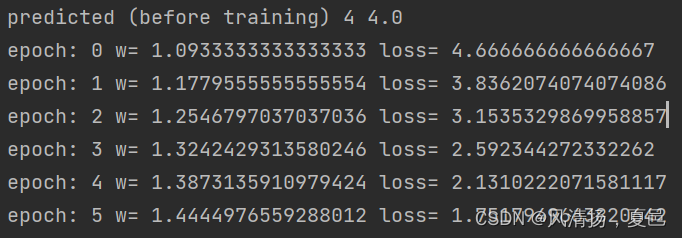
........

随机梯度下降算法:
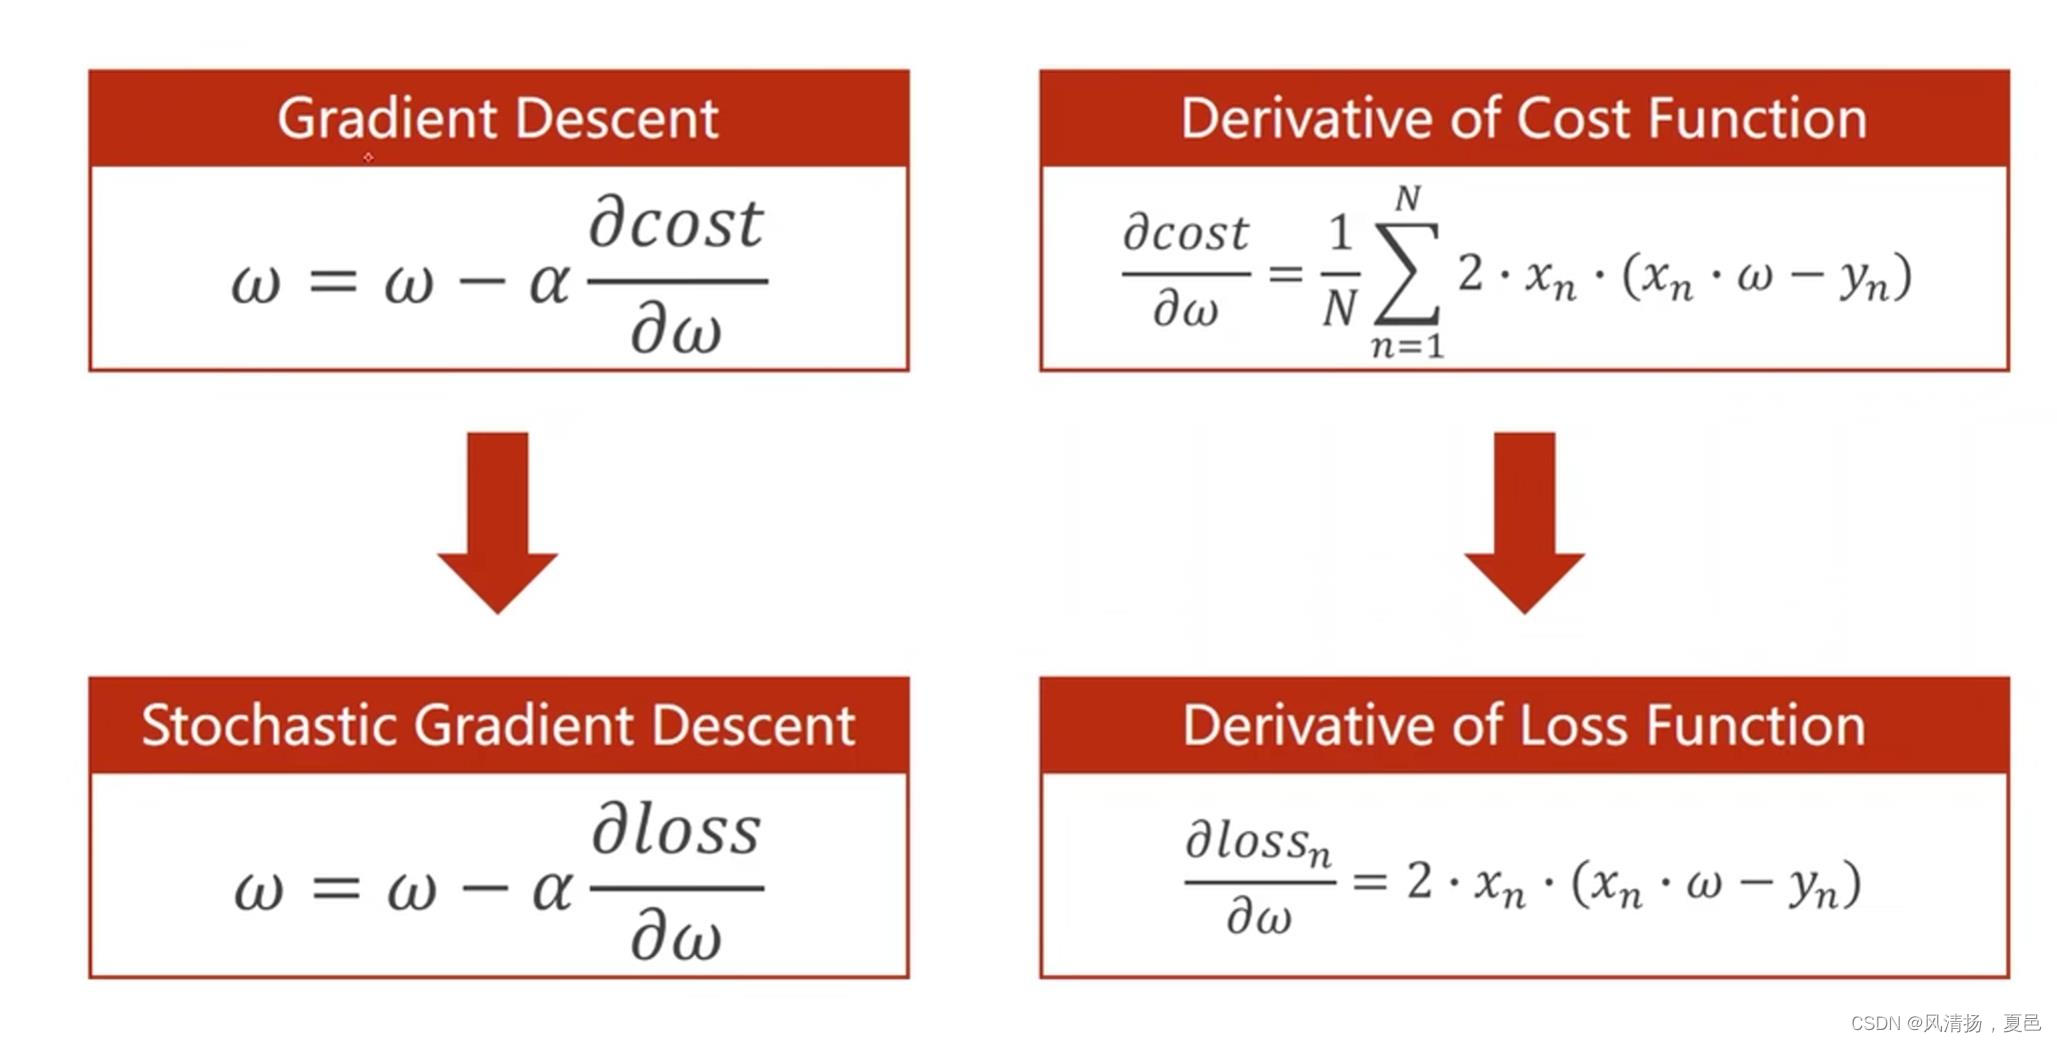
梯度下降算法是对所有的数据损失求平均损失,而随机梯度下降算法是随机取一个数据进行计算求损失。
代码如下:
import matplotlib.pyplot as plt #导入绘图包
x_data = [1.0,2.0,3.0] #初始化数据集
y_data = [2.0,4.0,6.0]
w = 1.0 #定义初始权值w=1.0
def forward(x):
return x * w #定义线性模型
def loss(x,y):
y_pred = forward(x)
return (y_pred-y)**2
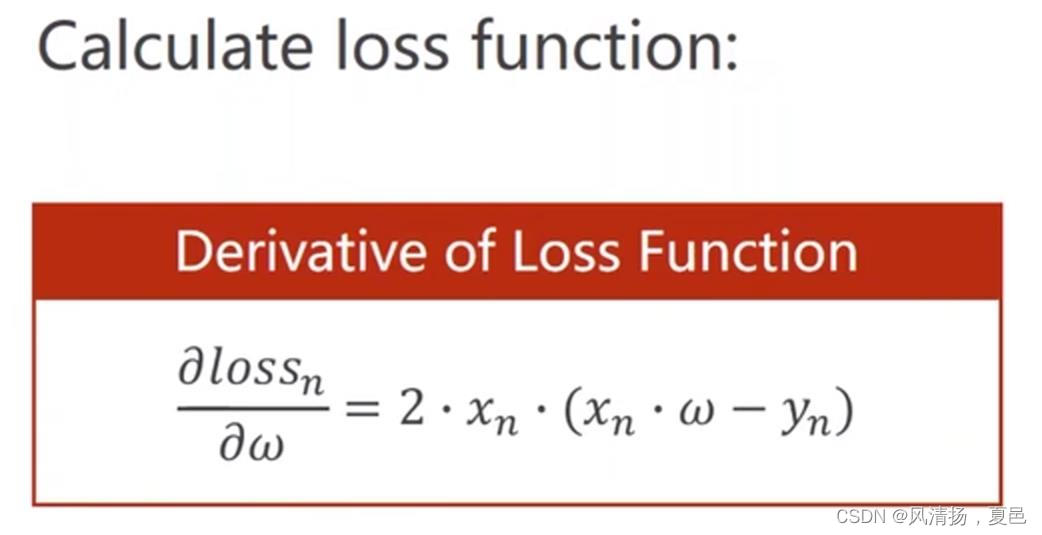
def gradient(x,y):
return 2*x*(w*x-y)
epoch_list = []
loss_list = []
print('predicted (before training)',4,forward(4)) #打印训练之前的预测值
for epoch in range(100): #进行100轮训练
for x,y in zip(x_data,y_data):
grad_val = gradient(x,y)
w -= 0.01*grad_val #学习率0.01
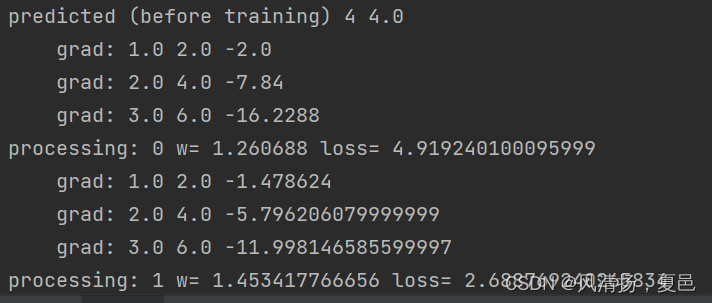
print('\tgrad:',x,y,grad_val) #训练,打印日志
loss_val = loss(x,y)
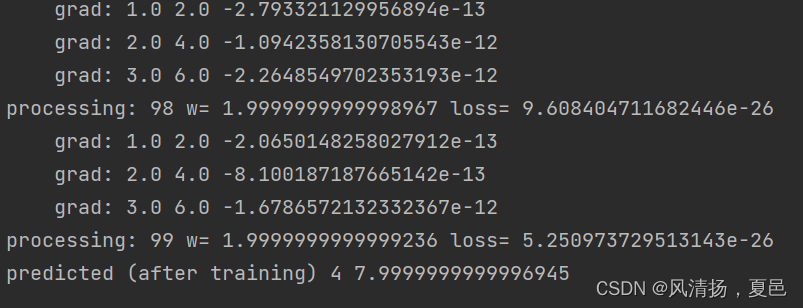
print('processing:',epoch,'w=',w,'loss=',loss_val)
epoch_list.append(epoch)
loss_list.append(loss_val)
print('predicted (after training)',4,forward(4)) #打印训练之后的预测值
plt.plot(epoch_list,loss_list)
plt.xlabel('epoch')
plt.ylabel('loss')
plt.show()
打印日志,运行结果:


 235
235


 被折叠的 条评论
为什么被折叠?
被折叠的 条评论
为什么被折叠?
 到【灌水乐园】发言


