


Abstract—Affective computing is an important subfield of artificial intelligence, and with the rapid development of braincomputer interface technology, emotion recognition based on EEG signals has received broad attention. It is still a great challenge to effectively explore the multi-dimensional information in the EEG data in spite of a large number of deep learning methods . In this paper, we propose a deep model called Attention-based Multiple Dimensions EEG Transformer (AMDET), which can leverage the complementarity among the spectral-spatial-temporal features of EEG data by employing the multi-dimensional global attention mechanism. We transformed the original EEG data into 3D temporal-spectral-spatial representations and then the AMDET would use spectral-spatial transformer encoder layer to extract effective features in the EEG signal and concentrate on the critical time frame with a temporal attention layer. We conduct extensive experiments on the DEAP, SEED, and SEED-IV datasets to evaluate the performance of AMDET and the results outperform the state-of-the-art baseline on three datasets. Accuracy rates of 97.48%, 96.85%, 97.17%, 87.32% were achieved in the DEAP-Arousal, DEAP-Valence, SEED, and SEED-IV datasets, respectively. We also conduct extensive experiments to explore the possible brain regions that influence emotions and the coupling of EEG signals. Remarkably, AMDET can perform as well even with few channels which are identified by visualizing what the trained model learned. The accuracy could achieve over 90% even with only eight channels and it is of great use and benefit for practical applications.
摘要—情感计算是人工智能的一个重要分支,随着脑机接口技术的快速发展,基于脑电信号的情感识别受到了广泛关注。尽管有大量的深度学习方法,但如何有效地挖掘脑电图数据中的多维信息仍然是一个很大的挑战。本文提出了一种基于注意力的多维脑电信号转换器(AMDET)深度模型,该模型利用多维全局注意机制,充分利用脑电信号频谱-时空特征之间的互补性。首先将原始脑电数据转换为三维时-谱-空间表示,然后利用谱-空间变换编码器层提取脑电信号中的有效特征,并利用时间注意层集中在关键时间帧上。我们在DEAP、SEED和SEED- iv数据集上进行了广泛的实验,以评估AMDET的性能,结果在三个数据集上优于最先进的基线。DEAP-Arousal、DEAP-Valence、SEED和SEED- iv数据集的准确率分别为97.48%、96.85%、97.17%和87.32%。我们还进行了大量的实验来探索可能影响情绪和脑电图信号耦合的大脑区域。值得注意的是,即使只有很少的通道,AMDET也能表现得很好,这些通道是通过可视化训练模型所学习的内容来识别的。即使只有8个通道,精度也能达到90%以上,在实际应用中具有很大的用途和效益。
1.介绍
Emotion is a comprehensive psychological and physiological response of human beings to an external event or stimulus.It can greatly impact a person’s behavior and thoughts, and in some cases even affect health and lead to illness. There is no doubt that emotions play an important role in life.Thus, on a matter of such significance, emotion recognition technology has been widely introduced and used in life, such as mental illness detection, fatigue driving detection,and human-computer interaction. Therefore, more and more researchers have devoted to this research.
情感是人类对外界事件或刺激的综合心理和生理反应。它可以极大地影响一个人的行为和思想,在某些情况下甚至影响健康并导致疾病。毫无疑问,情感在生活中扮演着重要的角色。因此,在这样一个意义重大的问题上,情绪识别技术被广泛引入并应用于生活中,如精神疾病检测、疲劳驾驶检测、以及人机交互。因此,越来越多的研究者致力于这方面的研究。
Emotion recognition can be broadly classified into two categories, one of which is based on human external responses, such as facial expressions [1], gestures [2] and voice intonation [3], etc. The other is based on human physiological signals, such as breathing, heart rate, body temperature, electroencephalogram (EEG) and so on [4]. The former is easier to collect but more subjective. To elaborate, people may fake their facial expressions and behavior, or deliberately speak loudly to pretend they are angry. Even in the same mood, different people behave differently. In contrast, EEG detection is more objective because humans struggle to control their physiological signals to fake emotions.
情绪识别大致可以分为两类,一类是基于人类的外部反应,如面部表情[1]、手势[2]、语音语调[3]等。另一种是基于人体生理信号,如呼吸、心率、体温、脑电图(EEG)等[4]。前者更容易收集,但更主观。为了详细说明,人们可能会假装他们的面部表情和行为,或者故意大声说话假装生气。即使是同样的心情,不同的人也会有不同的表现。相比之下,脑电图检测更加客观,因为人类很难控制自己的生理信号来伪装情绪。
EEG is the bioelectric activity detected on the surface of the human scalp. It can be collected by portable and relatively inexpensive devices. The amplitude of EEG signal in normal humans ranges from 10µV -200µV [5], the frequency is 0.2Hz-90Hz [6]. EEG has a high temporal resolution, which allows for the recording of brain activity with a resolution of milliseconds. However, it is limited in its spatial resolution, which refers to the ability to accurately locate brain activity within specific regions of the brain. This limitation is caused by the physical constraints of the EEG collection device, as well as the interference of the electric field between different areas of the brain. Despite these limitations, EEG remains a valuable tool for studying brain activity and has contributed significantly to our understanding of the brain.
脑电图是在人体头皮表面检测到的生物电活动。它可以通过便携式和相对便宜的设备收集。正常人脑电图信号的幅值范围为10µV -200µV[5],频率为0.2Hz-90Hz[6]。脑电图具有很高的时间分辨率,可以记录毫秒级的大脑活动。然而,它在空间分辨率上是有限的,空间分辨率指的是在大脑的特定区域精确定位大脑活动的能力。这种限制是由于EEG采集装置的物理限制以及大脑不同区域之间电场的干扰造成的。尽管存在这些局限性,脑电图仍然是研究大脑活动的一个有价值的工具,并为我们对大脑的理解做出了重大贡献。
Numerous studies have shown that EEG has the ability to accurately reflect an individual’s emotional state to a certain degree. The characteristics of EEG in the time domain, space domain, and frequency domain are all highly correlated with human emotional states. For example, in the frequency domain, alpha waves are enhanced when people are in a calm state, beta waves are intensified when the brain is active and highly focused, and gamma waves are associated with hyperactivity in the brain [7]. Researchers often use the ratio of beta waves to alpha waves as an indication of brain activeness [8], [9], and assess whether a person is in a happy state according to the power of theta waves [10]. Therefore, the power characteristics such as power spectral density (PSD) [11] and differential entropy (DE) [12], [13], are often used as a feature of the EEG signal in many studies of emotion recognition [14].
大量研究表明,脑电图在一定程度上具有准确反映个体情绪状态的能力。脑电图在时间域、空间域和频率域的特征都与人的情绪状态高度相关。例如,在频域中,当人们处于平静状态时,α波会增强,当大脑活跃和高度集中时,β波会增强,而伽马波则与大脑的过度活跃有关[7]。研究人员经常使用β波与α波的比值作为大脑活跃度的指标[8],[9],并根据θ波的强度来评估一个人是否处于快乐状态[10]。因此,功率谱密度(power spectral density, PSD)[11]、差分熵(differential entropy, DE)[12]、[13]等功率特性在许多情绪识别研究中经常被用作EEG信号的特征[14]。
The spatial properties of EEG are reflected in the close correlation between each emotional state and some specific areas of the brain. The brain can be divided into four areas, which are the frontal lobe, parietal lobe, temporal lobe, and occipital lobe. The main functions of the frontal lobe are cognitive thinking and emotional demands.The parietal lobe responds to the tactile sense. It is also related to the body’s balance and coordination. The temporal lobe is mainly responsible for auditory and olfactory sensations as well as associated with emotional and mental activity. Finally, the occipital lobe is in charge of processing visual information [7]. People’s emotions would trigger activities in specific brain areas. For example, the activity of the left frontal lobe of the brain is activated when people feel happy [15] and suppressed when people feel fearful [16]. Li et al combined functional connectivity networks with local activation to validate the activities of local brain regions responsive to emotions and the interaction between the brain regions involved in the activities [17]. It is evident that the EEG signal holds promising characteristics that can be examined in the spatial domain.
脑电的空间特性体现在每种情绪状态与大脑某些特定区域的密切关联上。大脑可以分为四个区域,一个是额叶,一个是顶叶,一个是颞叶,一个是枕叶。额叶的主要功能是认知思维和情感需求。顶叶对触觉有反应。它还与身体的平衡和协调有关。颞叶主要负责听觉和嗅觉,也与情绪和精神活动有关。最后,枕叶负责视觉信息的处理[7]。人们的情绪会触发大脑特定区域的活动。例如,当人们感到快乐时,大脑左额叶的活动被激活[15],当人们感到恐惧时,大脑左额叶的活动被抑制[16]。Li等人将功能连接网络与局部激活相结合,验证了响应情绪的大脑局部区域的活动以及参与活动的大脑区域之间的相互作用[17]。很明显,脑电图信号具有可以在空间域中检查的有前途的特征。
EEG has a high temporal resolution and therefore contains a lot of information in the time domain which should not be neglected. Some studies use statistic features to analyze the EEG signal, such as calculating the mean, standard deviation and difference etc. over a time window. These characteristics can indicate whether the EEG has oscillated smoothly or changed drastically during the time window period. In the field of emotion recognition, EEG’s the first difference (1ST) is commonly used as a feature, which is defined as the mean of absolute values of the first second of the raw signal [18].Stationarity is also worth being considered when analyzing sequential signals. One of the measurements is the Lyapunov exponents, which are used to determine the stability of any steady-state behavior, including chaotic solutions [19]. Fourier transform is a common way to analyze the frequency domain.However, it does not exhibit any time-domain characteristic, so researchers have proposed the Short Time Fourier Transform to compensate for this defect. Wavelet transform is another solution to the lack of time domain information, which is also commonly applied to analyze EEG. It employs wavelets of different scales to model the signal that maximizes the preservation of time-domain information. These extended transform methods precisely illustrate the necessity of the EEG temporal features.
脑电图具有很高的时间分辨率,因此在时域中包含了大量不可忽视的信息。一些研究利用统计特征对脑电信号进行分析,如计算一个时间窗内的均值、标准差和差值等。这些特征可以表明脑电图在时间窗期间是平稳振荡还是剧烈变化。在情绪识别领域,EEG的第一差(1ST)常被用作特征,定义为原始信号的第一秒绝对值的平均值[18]。在分析序列信号时,平稳性也值得考虑。其中一种测量是Lyapunov指数,它被用来确定任何稳态行为的稳定性,包括混沌解[19]。傅里叶变换是分析频域的一种常用方法。然而,它没有表现出任何时域特征,因此研究人员提出了短时傅里叶变换来弥补这一缺陷。小波变换是解决时域信息不足的另一种方法,也常用于脑电分析。它采用不同尺度的小波对信号进行建模,最大限度地保留了时域信息。这些扩展变换方法很好地说明了脑电信号时间特征的必要性。
As mentioned above, EEG contains a potential abundance of information in the frequency, space and time domains.Therefore, how to extract and make full use of this information becomes the greatest challenge. The main contributions of this paper are described below.
如上所述,脑电图在频率、空间和时间域包含潜在的丰富信息。因此,如何提取和充分利用这些信息成为最大的挑战。本文的主要贡献如下。
1) We proposed a model named AMDET which is excellent at extracting features of EEG signals by employing the multi-dimensional global attention mechanism. AMDET outperforms other state-of-the-art methods on DEAP , SEED, and SEED-IV datasets. We also conducted an ablation experiment to demonstrate the necessity to use all the information in the three domains of time, space, and frequency.
2) We conducted extensive visualization experiments using a Grad-CAM based algorithm to reveal the focus of the model on channels and figure out the brain region that contributes more to emotion recognition.
3) We further investigated the redundancy of EEG signals by reducing the number of channels in the experiment.And we also validate the effectiveness of our model with only a few EEG channels. AMDET can achieve high performance even when using less than 20 percent of the EEG channels, which offers the possibility of practical applications.
1)提出了一种利用多维全局注意机制提取脑电信号特征的AMDET模型。AMDET在DEAP、SEED和SEED- iv数据集上优于其他最先进的方法。我们还进行了消融实验,以证明在时间、空间和频率三个域中使用所有信息的必要性。
2)我们使用基于Grad-CAM的算法进行了大量的可视化实验,揭示了模型对通道的关注,并找出了对情绪识别贡献更大的大脑区域。
3)通过减少实验中的通道数进一步研究了脑电信号的冗余性。并在少量脑电信号通道下验证了该模型的有效性。即使使用不到20%的EEG通道,AMDET也可以实现高性能,这为实际应用提供了可能性。
The remainder of this article is organized as follows. Related works are described in Section II. Then, Section III introduces the details of the proposed AMDET, including EEG signal preprocessing, multidimensional features extraction and the classification algorithm. The experiments presented in Section IV are designed to prove the effectiveness of the proposed AMDET. Section V shows the experiment results and discussion. Section VI draws conclusions and future work.
本文的其余部分组织如下。第二节描述了相关工作。然后,第三部分详细介绍了所提出的AMDET,包括脑电信号预处理、多维特征提取和分类算法。第四节中提出的实验旨在证明所提出的AMDET的有效性。第五节给出了实验结果和讨论。第六节提出结论和今后的工作。
2.相关工作
The current EEG-based emotion recognition will be divided into two main methods. One of them is to extract distinguishable features first, and then use the traditional machine learning method for classification. Another is to use the end-to-end deep learning method, which completes feature extraction and classification simultaneously. Deep learning has outperformed traditional machine learning methods in some areas, such as computer vision and natural language processing.
目前基于脑电图的情感识别主要分为两种方法。其中一种方法是先提取可区分的特征,然后使用传统的机器学习方法进行分类。另一种是使用端到端深度学习方法,同时完成特征提取和分类。深度学习在某些领域已经超越了传统的机器学习方法,比如计算机视觉和自然语言处理。
Atkinson et al combined statistical-based feature selection methods and support vector machine (SVM) emotion classifiers and achieved decent results [20]. Wavelet transform is a widely used method for time-frequency domain analysis as well as feature extraction of EEG [21]. Li et al used Discrete Wavelet Transform to divide EEG signals into four frequency bands and calculated their entropy and energy as the features of the k-nearest neighbor classifier (KNN) [22]. Subasi et al.also employed Tunable Q Wavelet Transform (TQWT) as a feature extractor and then exercised rotation forest ensemble as a classifier, which utilized different classification algorithms such as KNN, SVM, artificial neural network, random forest, and other four different types of decision tree algorithms [23].
Atkinson等人将基于统计的特征选择方法与支持向量机(SVM)情感分类器相结合,取得了不错的结果[20]。小波变换是一种广泛应用于EEG时频域分析和特征提取的方法[21]。Li等人利用离散小波变换将脑电信号划分为4个频带,并计算其熵和能量作为k近邻分类器(KNN)的特征[22]。subbasi等人还采用了可调Q小波变换(Tunable Q Wavelet Transform, TQWT)作为特征提取器,然后用旋转森林集成(rotation forest ensemble)作为分类器,采用了KNN、SVM、人工神经网络、随机森林等四种不同类型的决策树算法[23]。
It is difficult to find representative and valid features in complex cognitive processes due to the great differences among subjects. Compared to traditional machine learning algorithms, deep learning does not require prior knowledge and manual feature extraction allowing it to directly extract features from complex data. Within Deep Learning, Convolution Neural Networks (CNN) can extract local characteristics of the data, recurrent neural networks (RNN) excel at extracting information from time-series data, and Transformer focuses its attention on the more influential parts of the data.Designing the network structure for the model to fully extract the information from the EEG signal is a critical step. Du et al employed self-attention mechanism in time and space domains to extract the critical EEG features [24]. Li et al first extracted the DE features of each channel and then arranged these features into a two-dimensional signal according to their position on the brain surface, then utilized a hierarchical convolutional neural network (HCNN) to extract and classify the spatial representation [25]. In some research, Long-Short Term Memory (LSTM) was used to learn temporal features from EEG signals [26]. Tao et al introduced the self-attention mechanism into their network model to assign weights to each channel and used CNN and RNN to obtain the time-domain and space-domain features of EEG, respectively, and finally achieved good results [27]. Jia et al designed a 3D attention mechanism to realize the complementarity among the spatialspectral-temporal features and discriminative local patterns in all features [28]. Xiao et al proposed a four-dimensional attention-based neural network, which fuses information on different domains and captures discriminative patterns in EEG signals [29].
在复杂的认知过程中,由于被试之间的巨大差异,很难找到具有代表性和有效性的特征。与传统的机器学习算法相比,深度学习不需要先验知识和手动特征提取,可以直接从复杂数据中提取特征。在深度学习中,卷积神经网络(CNN)可以提取数据的局部特征,递归神经网络(RNN)擅长从时间序列数据中提取信息,而Transformer则专注于数据中更有影响力的部分。设计模型的网络结构以充分提取脑电信号中的信息是关键的一步。Du等人利用时间和空间域的自注意机制提取脑电关键特征[24]。Li等人首先提取每个通道的DE特征,然后根据它们在脑表面的位置将这些特征排列成二维信号,然后利用层次卷积神经网络(HCNN)对空间表征进行提取和分类[25]。在一些研究中,长短期记忆(LSTM)被用来学习脑电信号的时间特征[26]。Tao等人在其网络模型中引入自注意机制,对各通道赋予权重,并分别使用CNN和RNN获取EEG的时域和空域特征,最终取得了较好的效果[27]。Jia等人设计了一种三维注意机制,实现了时空特征之间的互补性和所有特征中的判别局部模式[28]。Xiao等人提出了一种基于四维注意力的神经网络,该网络融合了不同领域的信息,并捕获了脑电信号中的判别模式[29]。
3.方法
To fully capture the EEG signals’ abundant information in the frequency, space, and time domains, we introduce the global attention mechanism [30] into our model. Fig. 1 shows an overview of AMDET. It contains a spatial attention block, a spectral attention block, a temporal attention block, and a classification layer. The preprocessing of the EEG signal will be first introduced.
为了充分捕捉脑电图信号在频率、空间和时间域的丰富信息,我们在模型中引入了全局注意机制[30]。图1显示了AMDET的概述。它包含空间注意块、光谱注意块、时间注意块和分类层。首先介绍脑电信号的预处理。
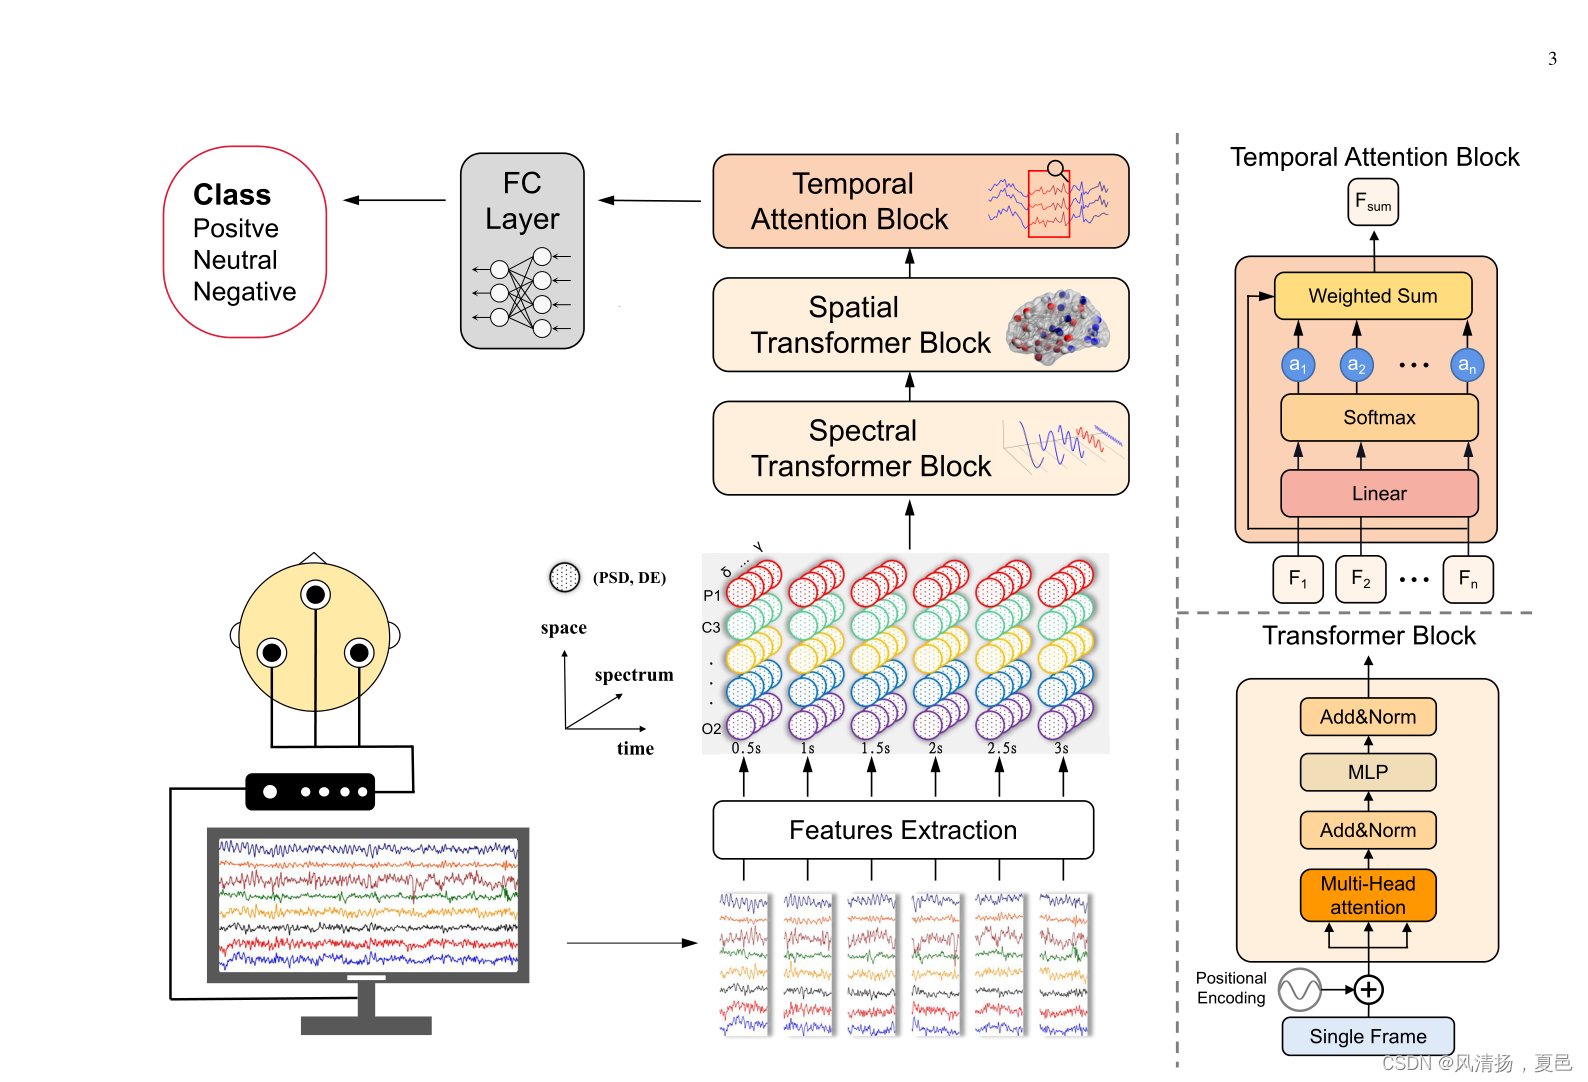
图1所示。我们的脑电情感识别AMDET模型框架由频谱转换块、空间转换块、时间注意块和全连接层(FC)组成。模型的输入是在theta[4-8Hz]、alpha[8-14Hz]、beta[14-31Hz]、gamma1[31-50Hz]、gamma2[50-75Hz]等多个频带中,从每个脑电信号通道和不同时间段提取的包含微分熵(DE)和功率谱密度(PSD)的三维张量。利用谱域变压器块和空间变压器块分别在谱域和空间域中发现和聚焦输入张量的有效部分。同样,时间注意块会将所有的帧聚合起来,并找出关键帧。最后,使用FC层进行分类。图形描述由BrainNet Viewer工具包制作[31]
A.预处理
As shown in Fig. 2, the original EEG data need to be preprocessed to generate EEG samples with three dimensions.To exploit the time-domain information of the EEG data, a 3-second window is first used to perform a non-overlapping segmentation of the raw EEG data to generate samples. Then, each sample is divided without overlap using a 0.5-second window, and the EEG signal in each window is considered as a frame in the sample. A single EEG sample contains multiple consecutive frames to preserve the time-domain characteristics of the EEG signal. In addition, since EEG signals are collected from multiple channels, and different channels represent different brain regions, we reserve the EEG channels to retain spatial information. Moreover, it has been shown that the high-frequency part of the EEG signal has a greater effect on emotion recognition than the other frequency parts. [32].Therefore, we divide the EEG signal into multiple frequency bands and extract features on each band. For each frame in a sample, it is filtered on theta[4-8Hz], alpha[8-14Hz], beta[1431Hz], gamma1[31-50Hz], gamma2[50-75Hz], respectively.Since PSD and DE features have been shown to be effective in EEG emotion identification [12], [33], we extract PSD and DE features for each frame on all five frequency bands for each channel separately. The PSD is defined as:
如图2所示,需要对原始脑电数据进行预处理,生成三维脑电样本。为了充分利用脑电数据的时域信息,首先利用3秒窗口对原始脑电数据进行无重叠分割生成样本。然后,利用0.5秒的窗口对每个样本进行无重叠分割,每个窗口内的脑电信号作为样本中的一帧。单个脑电信号样本包含多个连续帧,以保持脑电信号的时域特征。此外,由于脑电信号是多通道采集的,不同的通道代表不同的脑区,因此我们保留脑电信号通道来保留空间信息。此外,脑电图信号的高频部分比其他频率部分对情绪识别的影响更大。[32]。因此,我们将脑电信号分成多个频带,并在每个频带上提取特征。对于样本中的每一帧,分别对theta[4-8Hz]、alpha[8-14Hz]、beta[1431Hz]、gamma1[31-50Hz]、gamma2[50-75Hz]进行滤波。由于PSD和DE特征已被证明在EEG情绪识别中是有效的[12],[33],我们提取PSD和DE在每个通道的所有五个频带上分别为每个帧提供功能。PSD的定义为:  其中x为随机信号,即一帧内的脑电信号。
DE is a generalized form of Shannon’s information entropy on continuous variables and can be used to measure the amount of information. DE is defined as:
DE是连续变量上香农信息熵的一种广义形式,可以用来度量信息量。DE定义为:
式中p(x)为信号的概率密度函数。当随机变量近似服从高斯分布N(µ,σ2)时,DE计算可简化为: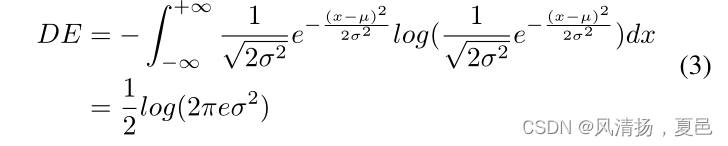
其中µ和σ分别表示信号x的均值和标准差,e表示欧拉常数。
Therefore, each sample x ∈ R2T ×2f×C has three dimensions after feature extraction. Where T represents the time length of the sample, f represents the number of frequency bands, and C represents the number of channels of the EEG data. Finally, z-score normalization is employed for each sample.
因此,每个样本x∈R2T ×2f×C经过特征提取后都有三个维度。其中,T表示样本的时间长度,f表示频带数,C表示EEG数据的通道数。最后,对每个样本采用z-score归一化。
B.频谱注意块
We extracted the PSD and DE features of the EEG signals at different frequency bands. The EEG signals on different frequency bands reflect different physiological states of human beings. For example, low-frequency EEG signals are often seen when humans are sleeping or resting, while high-frequency EEG signals are usually seen when people are anxious or subject to strong emotional fluctuations [7].Therefore, EEG signals can be discriminative for emotion in the frequency domain. To extract the spectral characteristics, we perform cross-band and cross-feature attention calculations on the features extracted on different frequency bands in the spectral attention block. The spectral attention block can be expressed as:
提取不同频段脑电信号的PSD和DE特征。不同频段的脑电图信号反映了人的不同生理状态。例如,低频脑电图信号通常出现在人类睡眠或休息时,而高频脑电图信号通常出现在人们焦虑或情绪波动强烈时[7]。因此,脑电图信号在频域上可以对情绪进行判别。为了提取光谱特征,我们对光谱注意块中不同频带提取的特征进行了跨带和跨特征的关注计算。光谱注意块可表示为:
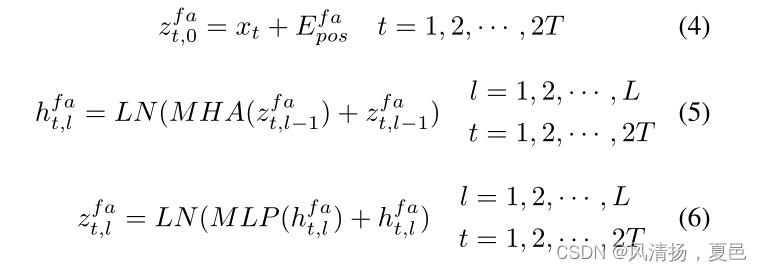
式中Efa pos∈R2f×C为频域特征的位置编码,t为样本中的帧,l为层数。如图1所示,我们采用多头注意(multiple -head attention, MHA)[30]对脑电信号进行注意计算,然后在变压器编码器中加入多层感知器(multilayer perceptron, MLP)。MHA和MLP块均采用残差连接[34]和层归一化(LN)[35]来加速网络训练。为了学习不同时间段脑电图信号的共同特征,我们使用相同的频谱注意块来训练不同的帧。同时,这也可以大大减少模型的参数数量。换句话说,对于同一采样中的不同帧,频谱注意块中的变压器编码器共享相同的参数。
C.空间注意块
The channel of the EEG signals represents the location of the brain sampled by the electrodes. Similar to EEG frequency characteristics reflecting the different physiological states of humans, each brain region is also responsible for different functions. For example, the frontal part of the cerebral cortex is generally responsible for human physiological emotions [7]. Correlation between EEG signals from different channels reflects the functional connectivity between different brain regions. Therefore, we perform self-attention calculations on channels to explore the functional connectivity of the brain which contains available information in space. The spatial attention block can be expressed as:
脑电图信号的通道代表了电极采样的大脑位置。与反映人类不同生理状态的脑电图频率特征类似,每个脑区也负责不同的功能。例如,大脑皮层的额叶部分通常负责人类的生理情绪[7]。不同通道脑电信号之间的相关性反映了脑区之间的功能连通性。因此,我们对通道进行自我注意计算,以探索包含了空间中可用的信息的大脑的功能连接。空间注意块可以表示为: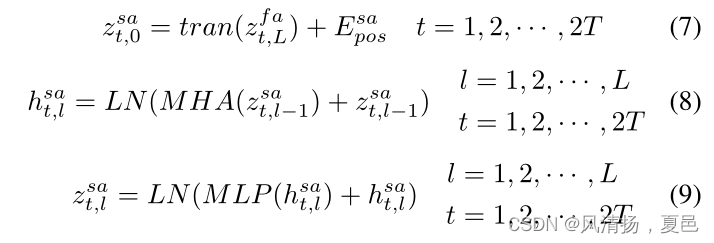
式中,Esa pos∈RC×2f表示空间信息的位置编码,tran()表示转置运算。与频谱注意块类似,该块采用了变压器编码器,并且该块中编码器的参数对于同一样本中的不同帧是共享的。
D.时间注意块
EEG signals are time-series and acquired by sampling at different times. When humans are stimulated or have emotional fluctuations, it can be reflected in the changes in EEG signals over time. Therefore, EEG signals also carry a large amount of useful information in the time domain. Since emotional fluctuations may only occur at a specific period, not each frame in the sample is critical to the analysis. Hence, in the temporal block, the model assigns an attention score to frames within the sample to reflect the importance of each frame, as shown in Fig. 1. The critical frames are then emphasized and retained by having a large weight in the weighted summation. To calculate the attention score of each frame, the output of the previous spatial attention block is flattened from ZsaL ∈ R2T ×2f×C to Zta ∈ R2T ×2f C. The computation is as follows:
脑电信号是时间序列,通过不同时间的采样获取。当人受到刺激或情绪波动时,可以反映在脑电图信号随时间的变化上。因此,脑电信号在时域上也携带着大量有用的信息。由于情绪波动可能只发生在特定时期,因此并不是样本中的每一帧都对分析至关重要。因此,在时间块中,模型为样本内的帧分配一个注意力分数,以反映每个帧的重要性,如图1所示。然后通过在加权求和中具有较大的权重来强调和保留关键帧。为了计算每一帧的注意力得分,将之前的空间注意力块的输出从ZsaL∈R2T ×2f×C平摊到Zta∈R2T ×2f c,计算如下:
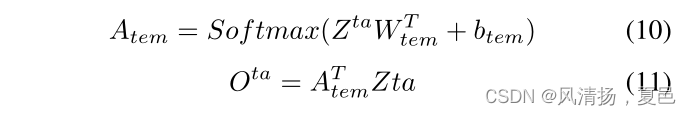
其中,WT tem和btem为可学习参数,Ota为时间注意块的输出。
E.分类层
After the raw EEG signals have been passed through the spectral attention block, the spatial attention block, and the temporal attention block, the output is a representation that integrates all the available information on multiple dimensions.In order to fuse the global information of the representation and output a final classification result, a classifier layer is employed. The classification layer is a single layer of a fully connected neural network. After flattening the output of the temporal attention block into a 1D vector, the classification layer is used to obtain the final results, and the whole neural network is optimized with the cross-entropy loss function:
原始脑电图信号经过频谱注意块、空间注意块和时间注意块后,输出的是多维度上综合所有可用信息的表征。为了融合表示的全局信息并输出最终的分类结果,采用了分类器层。分类层是全连接神经网络的单层。将时间注意力块的输出扁平化为一维向量后,使用分类层获得最终结果,并使用交叉熵损失函数对整个神经网络进行优化:

其中N为批量大小的数量,C为类别的数量。Ycn和~Ycn分别为对应类别的单热标签和预测概率。
4.实验
A.数据集
DEAP is a public dataset for EEG emotion recognition [36].32 Subjects were asked to watch 40 1-minute music videos and record their emotion level of valence and arousal from 1 to 9 based on an online self-assessment. Depending on the above level, we divided the dataset into two classes with a threshold value of 5. The EEG signals were acquired according to the 10/20 system at 512 Hz with 32 channels of EEG. Then the data was downsampled to 128Hz and passed to a filter between 4 and 45 Hz. It is worth noting that each trial consists of 3-second pre-trial baseline and 60-second emotion related signals. Following the previous work [29], we calculated DE features by subtracting baseline DE features from pre-trial signals.
DEAP是EEG情感识别的公共数据集[36]。32名受试者被要求观看40个1分钟的音乐视频,并根据在线自我评估记录他们的情绪水平,从1到9。根据上述水平,我们将数据集分为两类,阈值为5。在512 Hz下,采用10/20制采集32通道脑电信号。然后将数据下采样到128Hz,并传递到4到45 Hz之间的滤波器。值得注意的是,每次试验由3秒的预试基线和60秒的情绪相关信号组成。根据之前的工作[29],我们通过从预审信号中减去基线DE特征来计算DE特征。
The SEED [33] and SEED-IV [37] datasets were collected by the BCMI lab at Shanghai Jiao Tong University and have been widely used in emotion recognition research. The SEED dataset contains three emotions: positive, negative, and neutral.Subjects were asked to watch videos of the three emotions to capture the corresponding EEG signals. A total of 15 subjects participated in the experiment. Each subject watched 15 videos, 5 videos for each emotion, and each video was about 4 minutes long. There was a 45-second self-assessment period and a 15-second break set between videos. The data was collected with the 62-channel ESI NeuroScan System, downsampled to 200Hz and filtered with a bandpass frequency filter from 0-75Hz.
SEED[33]和SEED- IV[37]数据集由上海交通大学BCMI实验室收集,已广泛应用于情绪识别研究。SEED数据集包含三种情绪:积极、消极和中性。受试者被要求观看这三种情绪的视频,以捕捉相应的脑电图信号。共有15名受试者参加了实验。每个被试观看15个视频,每种情绪5个视频,每个视频长约4分钟。视频之间有45秒的自我评估时间和15秒的休息时间。数据由62通道ESI 神经扫描系统收集,下采样至200Hz,并使用0-75Hz的带通频率滤波器进行滤波。
SEED-IV contains the emotions of happy, sad, neutral, and fear. In the same way, 15 subjects participated in the experiment and were asked to watch corresponding emotional film clips. Each subject’s experimental task contained 24 trails, each consisting of a 5-second hint of start, a 2-minute video, and a 45-second self-assessment. As with SEED, the EEG signals were acquired using the ESI NeuroScan System, which consists of 62 channels and downsampled to 200 Hz. After downsampling, a 1-75 Hz bandpass filter was employed to remove noises.
SEED-IV包含快乐、悲伤、中性和恐惧的情绪。同样,15名受试者参加了实验,并被要求观看相应的情感电影片段。每个实验对象的实验任务包含24条线索,每条线索由5秒的开始提示、2分钟的视频和45秒的自我评估组成。与SEED一样,EEG信号是使用ESI神经扫描系统获取的,该系统由62个通道组成,下行采样至200 Hz。下采样后,采用1-75 Hz带通滤波器去除噪声。
B.实验设计
In order to evaluate our model in the emotion recognition task, we designed the following experiments for a comprehensive comparison. Firstly, we compared AMDET with other current state-of-the-art models. Then, we designed ablation experiments to explore the effect of each part of our model. At last, a visualization experiment was conducted to investigate the characteristic of EEG data. Below is a description of our experiments:
为了评估我们的模型在情绪识别任务中的效果,我们设计了以下实验进行全面比较。首先,我们将AMDET与其他当前最先进的模型进行了比较。然后,我们设计了消融实验来探索模型各部分的影响。最后,通过可视化实验研究了脑电数据的特征。下面是我们的实验描述:
1) Baseline models:
• SVM [38]: A generalized linear classifier that solves the maximum margin hyperplane for samples
• BiHDM [39]: A recurrent neural network-based model of left- and right-hemisphere differences for EEG emotion recognition
• RGNN [40]: A regularized graph neural network considering the biological topology among different brain regions to capture both local and global relations among different EEG channels.
• 4D-CRNN [41]: A convolutional recurrent neural network that extracts spatial, spectral and temporal domain features of EEG signals for emotion recognition.
• SST-EmotionNet [28]: An attention-based two-stream CNN that simultaneously integrates spatial-spectraltemporal features in a single network framework.
• 4D-aNN [29]: A 4D attention-based neural network consisting of a CNN and a bidirectional LSTM.
1)基线模型:
•SVM[38]:一种解决样本最大边界超平面的广义线性分类器
•BiHDM[39]:一种基于循环神经网络的EEG情绪识别左、右半球差异模型
•RGNN[40]:一种考虑不同脑区间生物拓扑结构的正则化图神经网络,以捕获不同脑电信号通道之间的局部和全局关系。
•4D-CRNN[41]:一种提取EEG信号的空间、频谱和时域特征用于情绪识别的卷积递归神经网络。
•SST-EmotionNet[28]:一种基于注意力的双流CNN,在单一网络框架中同时集成了空间-频谱-时间特征。
•4D- aNN[29]:一种由CNN和双向LSTM组成的基于4D注意力的神经网络。
2) Ablation Experiment: In our approach, we customize the model with different structures in each of the three dimensions to capture the abundant features of the EEG signal. In order to investigate the role of each part of the model, we conducted ablation experiments to explore the performance of the model by removing the spectral attention block, the spatial attention block, and the temporal attention block, respectively.
2)消融实验:在我们的方法中,我们在三个维度上定制不同结构的模型,以捕获脑电图信号的丰富特征。为了研究模型各部分的作用,我们分别通过去除光谱注意块、空间注意块和时间注意块进行消融实验,探索模型的性能。
3) Visualization and EEG channel selection: We design our model based on attention mechanism which makes the model learn and focus on the significant part in spectral, spatial and temporal domains. As a result, the AMDET achieve state-ofthe-art performance. But in the meantime, it is of value to know what the trained model has learned for EEG emotion recognition, i.e., the interpretability of the deep model, for instance, to explore the correlation between emotions and each channel or each frequency band, or to find some specific time domain characteristics of EEG. We adopt Grad-CAM [42] to visualize where the model attention is. Grad-CAM (Gradientweighted Class Activation Mapping) uses gradient to measure the influence of the elements in feature extracted by the model on the prediction results. It is able to highlight the important regions in the image for predicting the concept.
3)可视化和脑电信号通道选择:基于注意机制设计模型,使模型学习和关注频谱、空间和时间域的重要部分。因此,AMDET实现了最先进的性能。但与此同时,了解训练后的模型对脑电情绪识别学到了什么,即深度模型的可解释性,例如,探索情绪与每个通道或每个频带的相关性,或者找到脑电的一些特定的时域特征,都是有价值的。我们采用Grad-CAM[42]来可视化模型注意力的位置。梯度加权类激活映射(gradient - weighted Class Activation Mapping, Grad-CAM)利用梯度来衡量模型提取的特征中元素对预测结果的影响。它能够突出显示图像中的重要区域,以预测概念。
Different channels in EEG data represent different regions of the cerebral cortex, and different brain regions are responsible for different physiological functions. On the SEED dataset, the number of channels is 62, which were obtained from different brain positions. However, an excessive number of channels not only increases the computational effort but also makes the practical application of brain-computer interaction difficult. Therefore, it is of great importance to reduce the number of channels used when analyzing EEG data. We aim to identify crucial brain regions or channels for emotion recognition. Based on this, we further made a selection of EEG channels. We reduced the number of EEG channels used for model training, from 62 to 32, 16, and 8 channels, respectively, and discussed the effects of the number of channels on the recognition performance.
脑电数据的不同通道代表大脑皮层的不同区域,不同的脑区负责不同的生理功能。在SEED数据集上,通道数为62个,这些通道来自不同的大脑位置。然而,过多的信道不仅增加了计算量,而且给脑机交互的实际应用带来了困难。因此,在分析脑电数据时,减少通道数是非常重要的。我们的目标是确定情绪识别的关键大脑区域或通道。在此基础上,进一步对脑电信号通道进行了选择。我们将用于模型训练的脑电信号通道数量分别从62个减少到32个、16个和8个,并讨论了通道数量对识别性能的影响。
C.实验细节
All experiments in this paper were conducted on an NVIDIA TITAN Xp GPU. The number of layers in the spectral attention block and the number of layers in the spatial attention block are set to 1 and 1, respectively. The number of heads in the spectral attention block and the number of heads in the spatial attention block are set to 2 and 2, respectively. The number of frequency bands are set to 4 for DEAP dataset (theta[4-8Hz], alpha[8-14Hz], beta[1431Hz], gamma1[31-50Hz]) and set to 5 for SEED dataset and SEED-IV dataset (theta[4-8Hz], alpha[8-14Hz], beta[1431Hz], gamma1[31-50Hz], gamma2[50-75Hz]). We use the AdamW optimizer with learning rate, weight decay, and batch size of 1e-3, 1e-6, and 16, respectively, to optimize the neural network. For DEAP dataset, we used only DE feature. We conducted experiments on each subject. For SEED and SEED-IV datasets, we calculated the average accuracy of each subject in the 3 experiments. We used five-fold cross-validation for all experiments.
本文的所有实验都是在NVIDIA TITAN Xp GPU上进行的。将光谱注意块的层数和空间注意块的层数分别设置为1和1。光谱注意块中的正面数和空间注意块中的正面数分别设为2和2。DEAP数据集(theta[4- 8hz], alpha[8-14Hz], beta[1431Hz], gamma1[31-50Hz])的频带数设置为4,SEED数据集和SEED- iv数据集(theta[4- 8hz], alpha[8-14Hz], beta[1431Hz], gamma1[31-50Hz], gamma2[50-75Hz])的频带数设置为5。我们使用学习率、权重衰减和批大小分别为1e-3、1e-6和16的AdamW优化器来优化神经网络。对于DEAP数据集,我们只使用DE特性。我们对每个受试者都进行了实验。对于SEED和SEED-IV数据集,我们计算了3个实验中每个受试者的平均准确率。我们对所有实验使用了五折交叉验证。
5.结果与讨论
A.与基线比较
In order to compare our model with baseline models, we conducted experiments on DEAP-Arousal, DEAP-V alence, SEED, and SEED-IV datasets. Table I shows the experimental results. The experimental results show that the deep learning methods are generally better than the traditional machine learning methods, and the accuracy of SVM is only 89.33%, 89.99%, 83.99%, and 56.61%. RGNN and BiHDM explore the spatial properties of EEG signals and achieve 94.24%/79.37% and 93.12%/74.35% accuracy on SEED and SEED-IV datasets respectively. 4D-CRNN does not just focus on the features in the spatial domain, but extracts the spectral-spatial-temporal features in EEG by CNN and RNN, reaching a better accuracy of 94.22% on SEED datasets. In addition, it achieves 94.22% and 94.58% accuracy on DEAP datasets. SST-EmotionNet and 4D-aNN tried to integrate the attention mechanism into their models in combination with CNN and LSTM. They also fused the features of EEG signals on all domains, and finally achieved 96.02%/84.92% and 96.25%/86.77% results on SEED and SEED-IV datasets, respectively. Our proposed model utilizes a transformer-based method to extract the frequency and spatial features of the EEG signal, then uses a temporal attention block to help the model focus on significant frames. The final result outperforms all baseline models and reaches 96.85%, 97.48%, 97.17% and 87.32% on four datasets.It is worth noting that the results of the approaches focusing on multiple domains are superior to those that study only a single domain, which illustrates the value of exploring the multidimensions characteristics of the EEG signal. At the same time, the comparison with the similar attention-based models SST-EmotionNet and 4D-aNN indicates that Transformer is more appropriate than CNN and LSTM for detecting critical and discriminative features on different domains.
为了将我们的模型与基线模型进行比较,我们对DEAP-Arousal、DEAP-V valence、SEED和SEED- IV数据集进行了实验。实验结果如表1所示。实验结果表明,深度学习方法总体上优于传统的机器学习方法,SVM的准确率仅为89.33%、89.99%、83.99%和56.61%。RGNN和BiHDM分别在SEED和SEED- IV数据集上实现了94.24%/79.37%和93.12%/74.35%的准确率。4D-CRNN不只是关注空间域的特征,而是通过CNN和RNN提取EEG的频谱-时空特征,在SEED数据集上达到了94.22%的更好准确率。在DEAP数据集上的准确率达到94.22%和94.58%。SST-EmotionNet和4D-aNN试图结合CNN和LSTM将注意机制整合到他们的模型中。对脑电信号各域特征进行融合,最终在SEED和SEED- IV数据集上分别获得96.02%/84.92%和96.25%/86.77%的结果。我们提出的模型利用基于变压器的方法提取脑电信号的频率和空间特征,然后使用时间注意块帮助模型集中在重要帧上。最终结果优于所有基线模型,在四个数据集上分别达到96.85%、97.48%、97.17%和87.32%。值得注意的是,多域方法的结果优于单域方法,这说明了探索脑电信号的多维特征的价值。同时,通过与相似的基于注意力的模型SST-EmotionNet和4D-aNN的比较表明,Transformer比CNN和LSTM更适合检测不同领域的关键特征和判别特征。
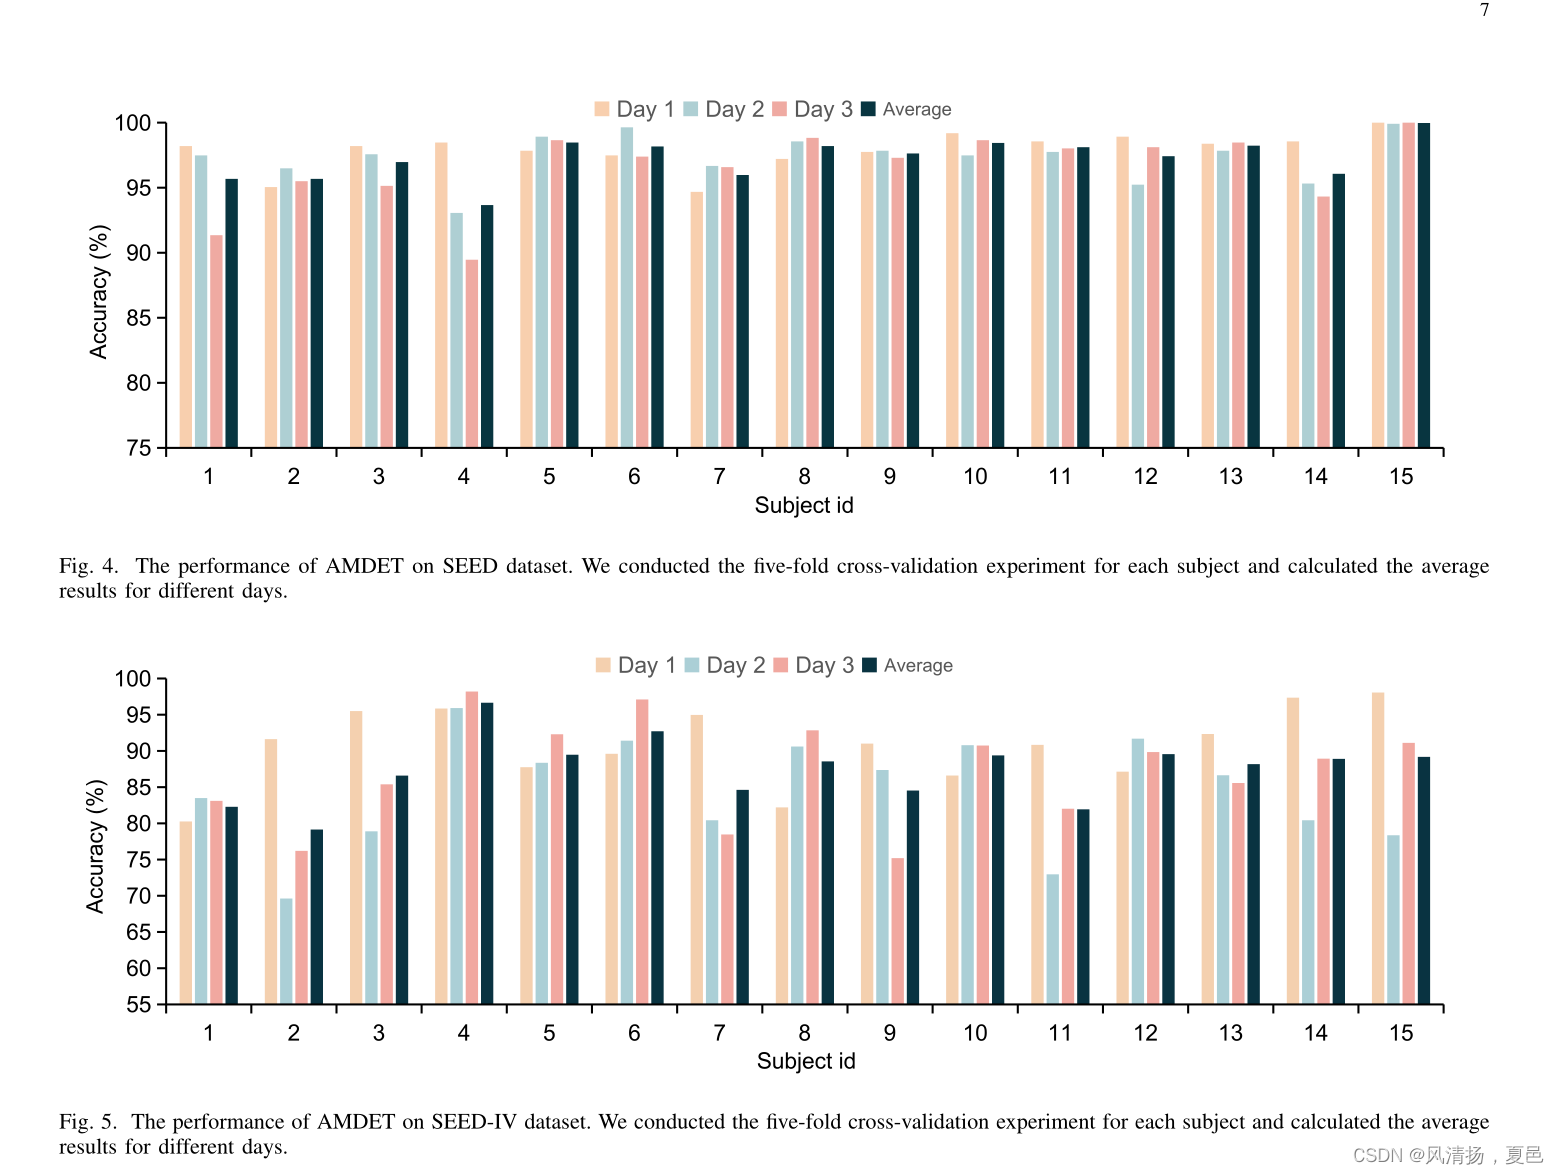
AMDET also has the lowest standard deviation compared to baseline models, which means it is more adaptable to different people. Fig. Fig. 4, and Fig. 5 demonstrate each subject experiment results individually on DEAP, SEED, and SEED-IV datasets. For the DEAP dataset, there are total 32 subjects and 2 experiments, arousal and valence classification, almost all of the accuracy achieve above 95%, except for subject 5, 22, and 32. Their accuracy is 95.5%/92.25%, 92.5%/91.625%, and 94%/94% on arousal and valence classification. The SEED dataset includes 15 subjects, and each subject has three days of experimental data. For classification on SEED dataset, there are 6 subjects, subject 1, 2, 3, 4, 7, and 14, performed below the average accuracy of 97%. As for SEED-IV dataset, it includes 15 subjects and 3 days data as SEED dataset, and has an extra emotion fear for classification. For the classification on SEED-IV dataset, there are 5 subjects whose accuracy is below 85%, and they are subject 1, 2, 7, 9, and 11. In the SEED-IV dataset, the accuracy for the three days varied greatly, with the 2nd day’s accuracy rate being about 6% lower than the 1st day’s and the 3rd day’s being about 4% lower.There may be some accidents during the data collection on the 2nd and 3rd days.
与基线模型相比,AMDET也具有最低的标准偏差,这意味着它更适合不同的人。图4和图5分别展示了各受试者在DEAP、SEED和SEED- iv数据集上的实验结果。DEAP数据集共有32个被试和2个实验,唤醒和效价分类,除被试5、22和32外,几乎所有被试的准确率都在95%以上。对唤醒和效价分类的正确率分别为95.5%/92.25%、92.5%/91.625%和94%/94%。SEED数据集包括15个受试者,每个受试者有3天的实验数据。对于SEED数据集的分类,有6个主题,主题1、2、3、4、7和14,执行的平均准确率低于97%。对于SEED- iv数据集,它包含15个受试者和3天的数据作为SEED数据集,并且有额外的情感恐惧用于分类。对于SEED-IV数据集的分类,准确率低于85%的受试者有5个,分别是受试者1、2、7、9和11。在SEED-IV数据集中,三天的准确率差异很大,第2天的准确率比第1天低约6%,第3天的准确率比第1天低约4%。在第2天和第3天的数据收集过程中可能会出现一些意外。
Experiment results prove that amdet can achieve excellent performance of higher accuracy and lower standard deviation on DEAP, SEED, and SEED-IV datasets. It also indicates the effectiveness and necessity of fusing multiple dimensional information of EEG for classification.
实验结果证明,amdet在DEAP、SEED和SEED- iv数据集上均能达到较高的准确率和较低的标准差。同时也说明了融合脑电图多维信息进行分类的有效性和必要性。
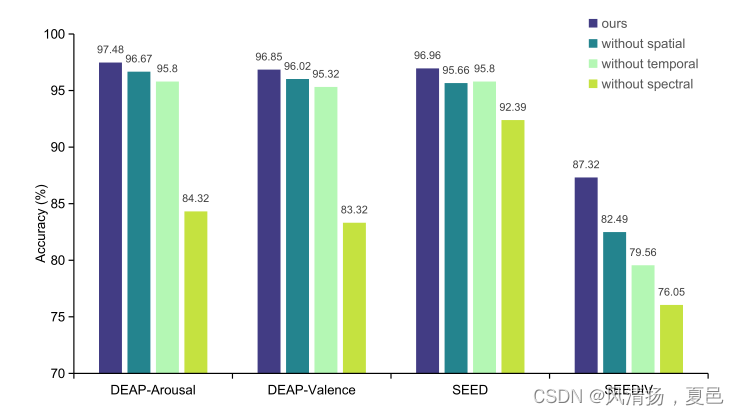
图6所示。deap -唤醒、DEAP-效价、SEED和SEED- iv数据集的消融研究结果。我们分别去除频谱变压器块、空间变压器块和时间注意力块,研究每个模块的作用。
B.消融研究
In our method, the model has three blocks for feature extraction of EEG signals, which are used to calculate attention in three different dimensions. To explore the role of different blocks of our model in the classification, we remove the spectral attention block, the spatial attention block and the temporal attention block, respectively, and reserve only the remaining two blocks. The results are shown in Fig. 6. We found that the spectral layer is more important than the spatial and temporal layers. For arousal and valence classification on the DEAP dataset, the performance of the model decreased significantly when the spectral attention block is removed, by 13.53% and 13.16%, respectively. In comparison, the model accuracy dropped slightly when the spatial attention block is removed, by 0.83% and 0.81%, respectively. Similarly, for the SEED and SEED-IV datasets, the accuracy decreased the most when the frequency attention layer was removed, by 4.57% and 11.28%, respectively. The spatial attention layer affected the accuracy the least on the SEED-IV dataset, with only a 4.83% decrease after removing. On the SEED dataset, the impact of the spatial attention block and the temporal attention block were not significantly different after removal, decreasing by 1.3% and 1.16%, respectively. Therefore, we consider the features on different frequency bands to be the most important for the emotion recognition task. In other words, the model mainly focuses on the frequency domain features to classify different emotions. After extracting DE and PSD features, EEG signals are more discriminative. The spatial and temporal features of EEG data, on the other hand, have less importance in emotion recognition compared to the frequency domain features and do not play a decisive role in emotion recognition.
在我们的方法中,模型有三个块用于脑电信号的特征提取,用于计算三个不同维度的注意力。为了探索模型中不同块在分类中的作用,我们分别去除了光谱注意块、空间注意块和时间注意块,只保留剩下的两个块。结果如图6所示。我们发现光谱层比时空层更重要。对于DEAP数据集上的唤醒和价态分类,当频谱注意块被去除后,模型的性能分别下降了13.53%和13.16%。相比之下,去掉空间注意块后,模型的准确率略有下降,分别下降了0.83%和0.81%。同样,对于SEED和SEED- iv数据集,去除频率关注层后,准确率下降幅度最大,分别为4.57%和11.28%。在SEED-IV数据集上,空间注意层对准确率的影响最小,去除后仅下降4.83%。在SEED数据集上,空间注意块和时间注意块去除后的影响差异不显著,分别下降1.3%和1.16%。因此,我们认为不同频带上的特征对于情绪识别任务是最重要的。换句话说,该模型主要关注频域特征来对不同的情绪进行分类。在提取DE和PSD特征后,脑电信号具有更强的鉴别能力。另一方面,与频域特征相比,脑电数据的时空特征在情绪识别中的重要性较小,在情绪识别中不起决定性作用。
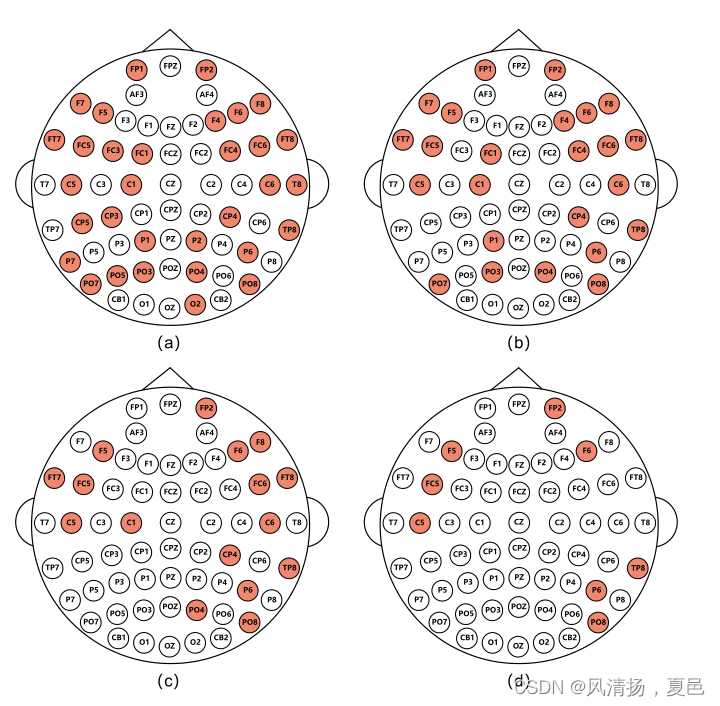
图7所示。根据SEED数据集受试者8的可视化结果,Top 32、24、16、8个通道(共62个)。我们根据热图对频道进行排名,并选择排名靠前的频道。
C.脑电信号通道可视化和通道选择
To explore what the trained model learns, we adopt GradCAM [42] to visualize the concern of the model. We use the features map and gradient to generate a heatmap that shows the import part having a greater impact on the prediction.
为了探索训练后的模型学习了什么,我们采用了GradCAM[42]来可视化模型的关注点。我们使用特征映射和梯度来生成热图,该热图显示了对预测有较大影响的导入部分。
In order to identify the critical channels for emotion recognition, we need to investigate the influence of each channel on the prediction of the trained model. After training the model with all 62 channels, we employed Grad-CAM for visualization. The channels were ranked according to their weights for emotion classification and those with the greater weights were selected for subsequent experiments. Fig. 7 shows the top 32, top 24, top 16 and top 8 channels for the 8th subject on the SEED datasets. It can be seen that the top 8 channels are P6, C5, TP8, F6, FP2, PO8, FC5 and F5, which are roughly concentrated in the temporal lobe and the parietal lobe in terms of cerebral location. The result shows that these regions of the cerebral cortex have a greater effect on the results of emotion recognition than the other parts.
为了确定情绪识别的关键通道,我们需要研究每个通道对训练模型预测的影响。在用所有62个通道训练模型后,我们使用Grad-CAM进行可视化。根据情绪分类的权重对通道进行排序,选择权重较大的通道进行后续实验。图7显示了SEED数据集上第8个主题的前32、前24、前16和前8个通道。可以看出,top8通道有P6、C5、TP8、F6、FP2、PO8、FC5和F5,在大脑位置上大致集中在颞叶和顶叶。结果表明,这些区域对情绪识别结果的影响比其他区域更大。
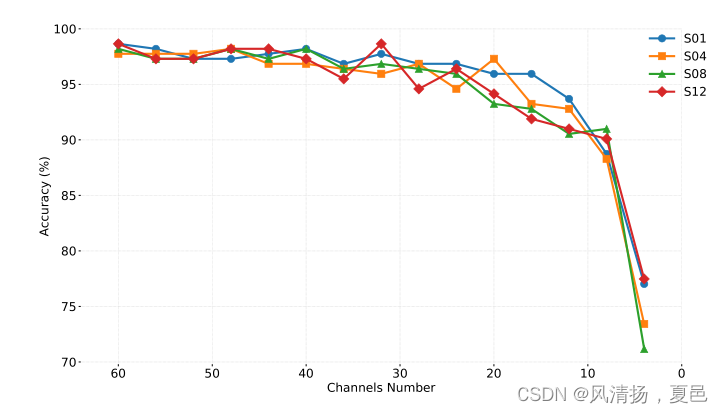
图8所示。受试者1、受试者4、受试者8、受试者12在SEED数据集上的通道缩减实验结果。我们按照热图的顺序将输入张量的通道数从62个通道减少到2个通道。
In addition to the channel visualization of EEG signals, we further investigated the impact of reducing the number of channels. We believe that there may be too much redundant information between EEG channels. On the one hand, reducing the number of channels can make the calculation time shorter; on the other hand, redundant channels for the emotion recognition task can produce noise effects. Therefore, we conducted EEG channel reduction experiments based on previous channel visualization results. We reduced the number of channels sequentially starting from 62 with a stride of 4.The experiment results are shown in Fig. 8. After selecting the 32 channels with the highest importance weights, the accuracy of emotion recognition decreased by only 1% compared to that of all channels used. As a result, it is clear that these selected 32 channels contain the majority of the information needed for the emotion recognition task, while the remaining channels reflect human emotion less and have an inconsiderable effect on the final task. When the number of channels was reduced to 24, 16, and 8, respectively, the accuracy of emotion recognition started to decrease gradually, by 2%, 3%, and 10%. It can be seen that even when the number of channels is reduced to 8, our model could still achieve an accuracy of about 90%.However, reducing the number of channels to less than 8 had a substantial impact on the task, yielding a large decrease in accuracy. It would lower the cost of time and computation when the number of channels is reduced. The number of parameters and FLOPs are 0.30M and 0.03G when using 62 channels, while that of 8 channels are only 0.078M and 0.0039G. In addition, fewer channels in inference are of great importance and use for putting EEG-based applications into reality. It means a smaller and more portable collection device.
除了对脑电信号的通道可视化外,我们还进一步研究了减少通道数量对脑电信号的影响。我们认为在脑电信号通道之间可能存在过多的冗余信息。一方面,减少通道数可以缩短计算时间;另一方面,情感识别任务的冗余通道会产生噪声效应。因此,我们在前人通道可视化结果的基础上进行脑电信号通道缩减实验。我们减少了通道的数量,通道数从62开始,步幅为4。实验结果如图8所示。在选择重要性权重最高的32个通道后,与使用的所有通道相比,情绪识别的准确性仅下降了1%。因此,很明显,这32个通道包含了情感识别任务所需的大部分信息,而剩余的通道反映人类情感较少,对最终任务的影响微不足道。当通道数分别减少到24、16和8个时,情绪识别的准确率开始逐渐下降,分别下降了2%、3%和10%。可以看出,即使通道数减少到8个,我们的模型仍然可以达到90%左右的准确率。然而,将通道数量减少到8以下会对任务产生重大影响,导致准确性大幅降低。减少信道数量可以降低时间和计算成本。使用62通道时,参数和flop数分别为0.30M和0.03G,而使用8通道时,参数和flop数仅为0.078M和0.0039G。此外,较少的推理通道对于实现基于脑电图的应用是非常重要和有用的。这意味着一个更小、更便携的收集设备。
6.结论
In this paper, we propose a transformer-based model, namely AMDET, for EEG emotion recognition. AMDET achieved state-of-the-art results by extracting and fusing temporal-spatial-frequency features in the EEG signal. Without CNN or RNN enhancing the transformer model, our model is based on a self-attention mechanism, which illustrates the potential for transformers in EEG pattern recognition tasks.The results of the ablation experiments show that information in all three domains is necessary to obtain favorable results on the EEG task, while the information in the frequency domain is of particular significance. Finally, we conduct a channel reduction experiment that selects the channels that contribute the most to the results by visualizing the focus of the model. This reduces the computational effort while ensuring the accuracy of the recognition. On the one hand, the experiment results demonstrate the strong feature extraction ability of our model, which has excellent performance even with few channels in the EEG, and on the other hand, this may also indicate the large redundancy of the EEG signal in the channel dimension. Currently, the visualization is implemented based on Grad-CAM, yet deep learning visualization methods that are more appropriate for EEG need to be devoted to more research, which could explore the role of different channels on different EEG paradigms. The improvement in visualization methods will not only make EEG devices more portable by reducing the number of electrodes but also has the potential to contribute to the development of neuroscience.
在本文中,我们提出了一种基于变压器的脑电情绪识别模型,即AMDET。AMDET通过提取和融合脑电信号的时空频率特征,取得了最先进的结果。在没有CNN或RNN增强变压器模型的情况下,我们的模型基于自注意机制,这说明了变压器在脑电模式识别任务中的潜力。消融实验结果表明,要在脑电任务中获得良好的结果,三个域的信息都是必要的,而频率域的信息尤为重要。最后,我们进行了一个通道缩减实验,通过可视化模型的焦点来选择对结果贡献最大的通道。这在保证识别准确性的同时减少了计算量。实验结果一方面证明了我们的模型具有较强的特征提取能力,即使在脑电信号中通道较少的情况下也具有优异的性能,另一方面这也可能说明了脑电信号在通道维度上存在较大的冗余。目前,可视化是基于Grad-CAM实现的,但更适合脑电的深度学习可视化方法还有待深入研究,探索不同通道在不同脑电范式中的作用。可视化方法的改进不仅可以通过减少电极数量使脑电图设备更加便携,而且对神经科学的发展也有潜在的贡献。


 525
525


 被折叠的 条评论
为什么被折叠?
被折叠的 条评论
为什么被折叠?
 到【灌水乐园】发言


