


使用golang进行复杂的组合运算,导致CPU占用率非常高。参考网上一些帖子,自己研究了一下go pprof进行CPU占用率分析和优化。主要使用svg图的方式查看CPU占用率分布。
1、问题现象:
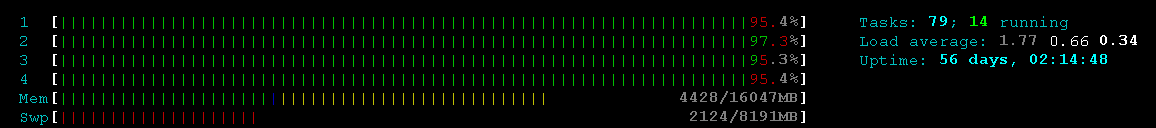
程序在用户量大、运算量多的情况下出现多核CPU占用率均超过99%的情况,用户端出现明显卡顿和消息响应延迟。使用htop命令查看结果如下:
2、调试方法
2.1 引入pprof包
//在import中添加pprof包
_ "net/http/pprof"
2.2 打开pprof包web服务端口
//指定pprof对外提供的http服务的ip和端口,配置为0.0.0.0表示可以非本机访问
go func() {
   http.ListenAndServe("0.0.0.0:9999", nil)
}()
2.3 程序启动后查看pprof服务端口是否启用
netstat -antp|grep 9999
tcp6       0      0 :::9989                 :::*                    LISTEN      28294/program
2.4 使用命令生成CPU profile
// 生成cpu profile的命令
go tool pprof http://192.168.7.11:9999/debug/pprof/profile
默认一次CPU profile包含30秒内的CPU使用情况。注意,如果CPU安全卡死,可能出现生成CPU profile超时失败的情况。
生成cpu profile成功后,会进入pprof命令行。实际上是pprof将生成好的cpu profile打包下载到本地目录,再用pprof打开进行分析
go tool pprof http://192.168.7.11:9999/debug/pprof/profile
Fetching profile over HTTP from http://192.168.7.11:9999/debug/pprof/profile
Saved profile in /root/pprof/pprof.testprog.samples.cpu.067.pb.gz
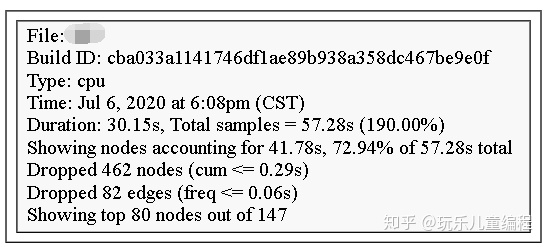
File: testprog
Build ID: cba033a1141746df1ae89b938a358dc467be9e0f
Type: cpu
Time: Jul 6, 2020 at 6:08pm (CST)
Duration: 30.15s, Total samples = 57.28s (190.00%)
Entering interactive mode (type "help" for commands, "o" for options)3. 分析cpu profile
接上一步,进入pprof命令行之后,可以进行一系列的分析操作。
    callgrind        Outputs a graph in callgrind format
    comments         Output all profile comments
    disasm           Output assembly listings annotated with samples
    dot              Outputs a graph in DOT format
    eog              Visualize graph through eog
    evince           Visualize graph through evince
    gif              Outputs a graph image in GIF format
    gv               Visualize graph through gv
    kcachegrind      Visualize report in KCachegrind
    list             Output annotated source for functions matching regexp
    pdf              Outputs a graph in PDF format
    peek             Output callers/callees of functions matching regexp
    png              Outputs a graph image in PNG format
    proto            Outputs the profile in compressed protobuf format
    ps               Outputs a graph in PS format
    raw              Outputs a text representation of the raw profile
    svg              Outputs a graph in SVG format
    tags             Outputs all tags in the profile
    text             Outputs top entries in text form
    top              Outputs top entries in text form
    topproto         Outputs top entries in compressed protobuf format
    traces           Outputs all profile samples in text form
    tree             Outputs a text rendering of call graph
    web              Visualize graph through web browser
    weblist          Display annotated source in a web browser
    o/options        List options and their current values
    quit/exit/^D     Exit pprof
比较常用的包括:
// 查看cpu消耗前20的函数调用
top 20

// 查看累计cpu消耗前20的函数调用
top -cum 20

// 查看代码符号附近的cpu占用情况。其中代码符号类似于c++的函数符号表,可以简单理解成函数名
list "代码符号"
由于使用的虚拟机没有XWindows界面,所以使用svg命令生成pdf图到本地进行查看。使用svg前,需要安装相关依赖软件
0、安装graphviz
sudo apt-get install graphviz

1、安装gv
sudo apt-get install gv
在pprof命令行生成svg文件
(pprof) svg
Generating report in profile057.svg
4. CPU占用率svg图分析
从生成的svg图中可以看到,mallocgc占用时长较多。原因是使用堆分配内存太频繁细碎导致的。其中,newobject(对应new关键字)、makeslice(对应make关键字)、growslice(对应append关键字)调用过于频繁,最终导致mallocgc占用时间非常长。
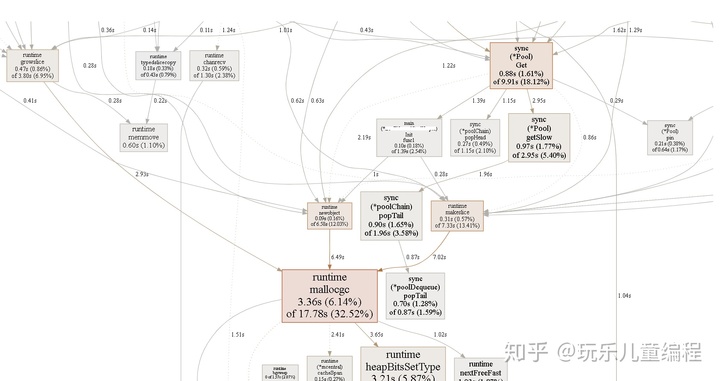
解决这类问题,主要是使用通过重复利用已分配内存,减少新建堆内存的次数,从而降低mallocgc的调用频率,同时也减少gc的压力。主要考虑通过使用sync.Pool来解决。
5. 使用sync.Pool减少mallocgc次数
首先,结合svg提供的线索,使用go编译器进行逃逸分析,看看哪些使用频率高的变量是从堆分配的。下面示例中,escape to heap表示此变量使用堆内存。
go build -gcflags "-N -l -m" ./test_program.go
./test_program.go:13:18: funcAlloc0 a does not escape
./test_program.go:14:17: new(BaseXStruct) escapes to heap
./test_program.go:17:18: funcAlloc1 b does not escape
./test_program.go:19:18: funcAlloc1 new(BaseXStruct) does not escape
./test_program.go:23:13: new(Teststruct) escapes to heap
./test_program.go:24:13: new(Teststruct) escapes to heap
然后,对于大量使用new、make、append关键字的地方进行优化。
5.1 使用sync.Pool预分配对象代替关键字new
a := new(BaseXStruct)
优化为
a := syncPoolIns.Get().(*BaseXStruct)

并且在合适的位置,将使用之后的对象放回sync.Pool中
syncPoolIns.Put(a)
特别注意,在将对象放回sync.Pool中时,即调用Put()方法时,一定要确保两点:
- 对象进行必要的重置(reset)
- 对象确实已经不在使用
否则,如果出现已放回sync.Pool中的对象仍在使用,将可能出现各种奇怪的程序问题,比如空指针、数组越界等。
5.2 使用sync.Pool实现slice池,优化make关键字
参考github上实现的slice池:
https://github.com/funny/slab/blob/master/sync_pool.go5.3 在使用append关键字的地方,尽可能计算出slice的实际大小,如果确实不能计算,可以测试设置一个适当的值确保减少growslice的调用。
6. 优化效果
经过以上优化后,mallocgc的调用频率和占用时长明显降低,相同压力下多核cput每个cpu的占用率不超过60%。
另外,sync.Pool虽然好,但也不是万能的,如果并发的go协程太多,会显著增加sync.Get的调用开销,最终的优化只能是在sync.Pool同步开销与mallocgc之间进行平衡,选取一个相对较优的性能。
参考文献:
https://blog.cyeam.com/golang/2017/02/08/go-optimize-slice-pool


 1815
1815

 被折叠的 条评论
为什么被折叠?
被折叠的 条评论
为什么被折叠?
 到【灌水乐园】发言


