前言
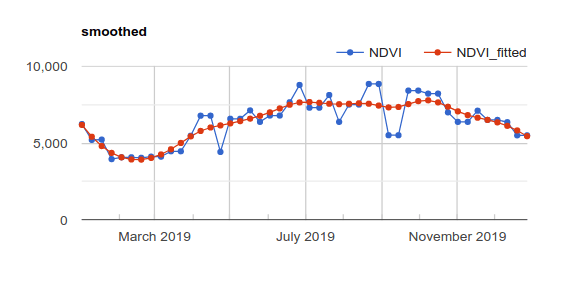
本博客介绍如何使用WHITTAKER平滑算法对时间序列(下图)进行平滑,以及如何添加图例。

1、利用GEE使用WHITTAKER 进行曲线平滑
// helper function to convert qa bit image to flag
function extractBits(image, start, end, newName) {
    // Compute the bits we need to extract.
    var pattern = 0;
    for (var i = start; i <= end; i++) {
       pattern += Math.pow(2, i);
    }
    // Return a single band image of the extracted QA bits, giving the band
    // a new name.
    return image.select([0], [newName])
                  .bitwiseAnd(pattern)
                  .rightShift(start);
}

// function to get a Difference mattrix of specified order
// on the input matrix. takes matrix and order as parameters
function getDifferenceMatrix(inputMatrix, order){
    var rowCount = ee.Number(inputMatrix.length().get([0]));
    var left = inputMatrix.slice(0,0,rowCount.subtract(1));
    var right = inputMatrix.slice(0,1,rowCount);
    if (order > 1 ){
        return getDifferenceMatrix(left.subtract(right), order-1)}
    return left.subtract(right);
};

// unpacks an array image into images and bands
// takes an array image, list of image IDs and list of band names as arguments
function unpack(arrayImage, imageIds, bands){

    function iter(item, icoll){

        function innerIter(innerItem, innerList){
            return ee.List(innerList).add(ee.String(item).cat("_").cat(ee.String(innerItem)))}

        var temp = bands.iterate(innerIter, ee.List([]));
        return ee.ImageCollection(icoll)
            .merge(ee.ImageCollection(ee.Image(arrayImage).select(temp,bands).set("id",item)))}

    var imgcoll  = ee.ImageCollection(imageIds.iterate(iter, ee.ImageCollection([])));
    return imgcoll}


// Function to compute the inverse log ratio of a regression results to
// transform back to percent units
function inverseLogRatio(image) {
  var bands = image.bandNames();
  var t = image.get("system:time_start");
  var ilrImage = ee.Image(100).divide(ee.Image(1).add(image.exp())).rename(bands);
  return ilrImage.set("system:time_start",t);
}

function whittakerSmoothing(imageCollection, isCompositional, lambda){
  // quick configs to set defaults
  if (isCompositional === undefined || isCompositional !==true) isCompositional = false;
  if (lambda === undefined ) lambda = 10;

  // procedure start
  var ic = imageCollection.map(function(image){
     var t = image.get("system:time_start");
    return image.toFloat().set("system:time_start",t);
  });

  var dimension = ic.size();
  var identity_mat = ee.Array.identity(dimension);
  var difference_mat = getDifferenceMatrix(identity_mat,3);
  var difference_mat_transpose = difference_mat.transpose();
  var lamda_difference_mat = difference_mat_transpose.multiply(lambda);
  var res_mat = lamda_difference_mat.matrixMultiply(difference_mat);
  var hat_matrix = res_mat.add(identity_mat);


  // backing up original data
  var original = ic;

  // get original image properties
  var properties = ee.List(ic.iterate(function(image, list){
    return ee.List(list).add(image.toDictionary());
  },[]));

  var time = ee.List(ic.iterate(function(image, list){
    return ee.List(list).add(image.get("system:time_start"));
  },[]));

  // if data is compositional
  // calculate the logratio of an image between 0 and 100. First
  // clamps between delta and 100-delta, where delta is a small positive value.
  if (isCompositional){
    ic = ic.map(function(image){
      var t = image.get("system:time_start");
      var delta = 0.001;
      var bands = image.bandNames();
      image = image.clamp(delta,100-delta);
      image = (ee.Image.constant(100).subtract(image)).divide(image).log().rename(bands);
      return image.set("system:time_start",t);
    });
  }

  var arrayImage = original.toArray();
  var coeffimage = ee.Image(hat_matrix);
  var smoothImage = coeffimage.matrixSolve(arrayImage);

  var idlist = ee.List(ic.iterate(function(image, list){
    return ee.List(list).add(image.id());
  },[]));
  var bandlist = ee.Image(ic.first()).bandNames();

  var flatImage = smoothImage.arrayFlatten([idlist,bandlist]);
  var smoothCollection = ee.ImageCollection(unpack(flatImage, idlist, bandlist));

  if (isCompositional){
    smoothCollection = smoothCollection.map(inverseLogRatio);
  }
  // get new band names by adding suffix fitted
  var newBandNames = bandlist.map(function(band){return ee.String(band).cat("_fitted")});
  // rename the bands in smoothened images
  smoothCollection = smoothCollection.map(function(image){return ee.Image(image).rename(newBandNames)});

  // a really dumb way to loose the google earth engine generated ID so that the two
  // images can be combined for the chart
  var dumbimg = arrayImage.arrayFlatten([idlist,bandlist]);
  var dumbcoll = ee.ImageCollection(unpack(dumbimg,idlist, bandlist));
  var outCollection = dumbcoll.combine(smoothCollection);

  var outCollectionProp = outCollection.iterate(function(image,list){
      var t = image.get("system:time_start")
    return ee.List(list).add(image.set(properties.get(ee.List(list).size())));
  },[]);

  var outCollectionProp = outCollection.iterate(function(image,list){
    return ee.List(list).add(image.set("system:time_start",time.get(ee.List(list).size())));
  },[]);


  var residue_sq = smoothImage.subtract(arrayImage).pow(ee.Image(2)).divide(dimension);
  var rmse_array = residue_sq.arrayReduce(ee.Reducer.sum(),[0]).pow(ee.Image(1/2));

  var rmseImage = rmse_array.arrayFlatten([["rmse"],bandlist]);

  return [ee.ImageCollection.fromImages(outCollectionProp), rmseImage];
}


var ndvi =ee.ImageCollection("NOAA/VIIRS/001/VNP13A1").select('NDVI').filterDate("2019-01-01","2019-12-31");
// getting rid of masked pixels
ndvi = ndvi.map(function(img){return img.unmask(ndvi.mean())});

var ndvi =  whittakerSmoothing(ndvi)[0];


// add chart
print(ui.Chart.image.series(
  ndvi.select(['NDVI', 'NDVI_fitted']), geometry, ee.Reducer.mean(), 500)
    .setSeriesNames(['NDVI', 'NDVI_fitted'])
    .setOptions({
      title: 'smoothed',
      lineWidth: 1,
      pointSize: 3,
}));
2、给GEE添加图例

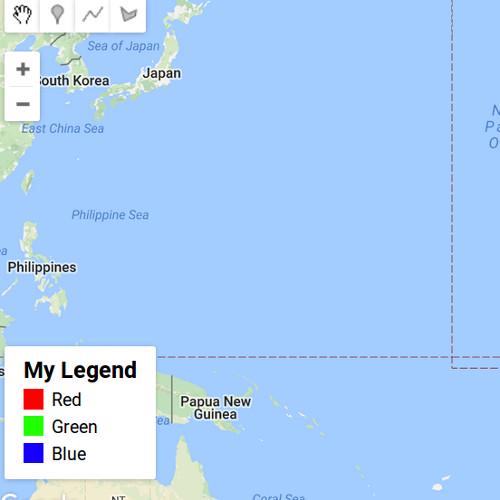
使用下面的代码将图例作为面板添加到谷歌地球引擎地图中。
// set position of panel
var legend = ui.Panel({
  style: {
    position: 'bottom-left',
    padding: '8px 15px'
  }
});

// Create legend title
var legendTitle = ui.Label({
  value: 'My Legend',
  style: {
    fontWeight: 'bold',
    fontSize: '18px',
    margin: '0 0 4px 0',
    padding: '0'
    }
});

// Add the title to the panel
legend.add(legendTitle);

// Creates and styles 1 row of the legend.
var makeRow = function(color, name) {

      // Create the label that is actually the colored box.
      var colorBox = ui.Label({
        style: {
          backgroundColor: '#' + color,
          // Use padding to give the box height and width.
          padding: '8px',
          margin: '0 0 4px 0'
        }
      });

      // Create the label filled with the description text.
      var description = ui.Label({
        value: name,
        style: {margin: '0 0 4px 6px'}
      });

      // return the panel
      return ui.Panel({
        widgets: [colorBox, description],
        layout: ui.Panel.Layout.Flow('horizontal')
      });
};

//  Palette with the colors
var palette =['FF0000', '22ff00', '1500ff'];

// name of the legend
var names = ['Red','Green','Blue'];

// Add color and and names
for (var i = 0; i < 3; i++) {
  legend.add(makeRow(palette[i], names[i]));
  }

// add legend to map (alternatively you can also print the legend to the console)
Map.add(legend);


 3527
3527

 被折叠的 条评论
为什么被折叠?


