


OpenCV-Python中的图像处理-图像轮廓
轮廓
什么是轮廓
轮廓可以简单认为成将连续的点(连着边界)连在一起的曲线,具有相同的颜色或者灰度。轮廓在形状分析和物体的检测和识别中很有用。
- 为了更加准确,要使用二值化图像。在寻找轮廓之前,要进行阈值化处理或者 Canny 边界检测。
- 查找轮廓的函数会修改原始图像。如果你在找到轮廓之后还想使用原始图像的话,你应该将原始图像存储到其他变量中。
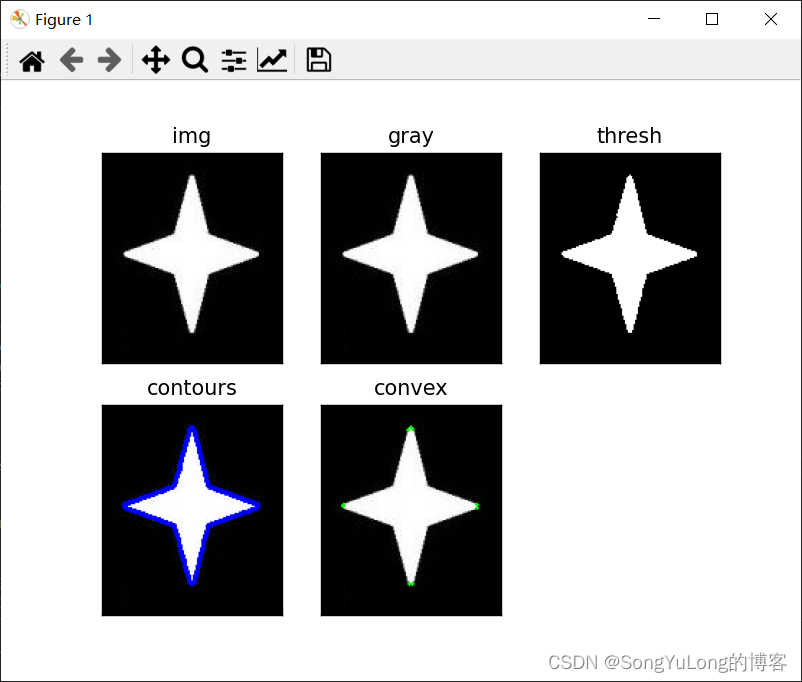
- 在 OpenCV 中,查找轮廓就像在黑色背景中超白色物体。你应该记住,要找的物体应该是白色而背景应该是黑色。
查找轮廓
函数 cv2.findContours() 有三个参数,第一个是输入图像,第二个是轮廓检索模式,第三个是轮廓近似方法。返回值有三个,第一个是图像,第二个是轮廓,第三个是(轮廓的)层析结构。轮廓(第二个返回值)是一个 Python列表,其中存储这图像中的所有轮廓。每一个轮廓都是一个 Numpy 数组,包含对象边界点( x, y)的坐标。
ret, thresh = cv2.threshold(imgray, 127, 255, 0)
contours, hierarchy = cv2.findContours(thresh, cv2.RETR_TREE, cv2.CHAIN_APPROX_SIMPLE)
cv2.CHAIN_APPROX_NONE:储存所有的边界点(点数很多)
cv2.CHAIN_APPROX_SIMPLE:储存所有的近似直线点(点数很少)
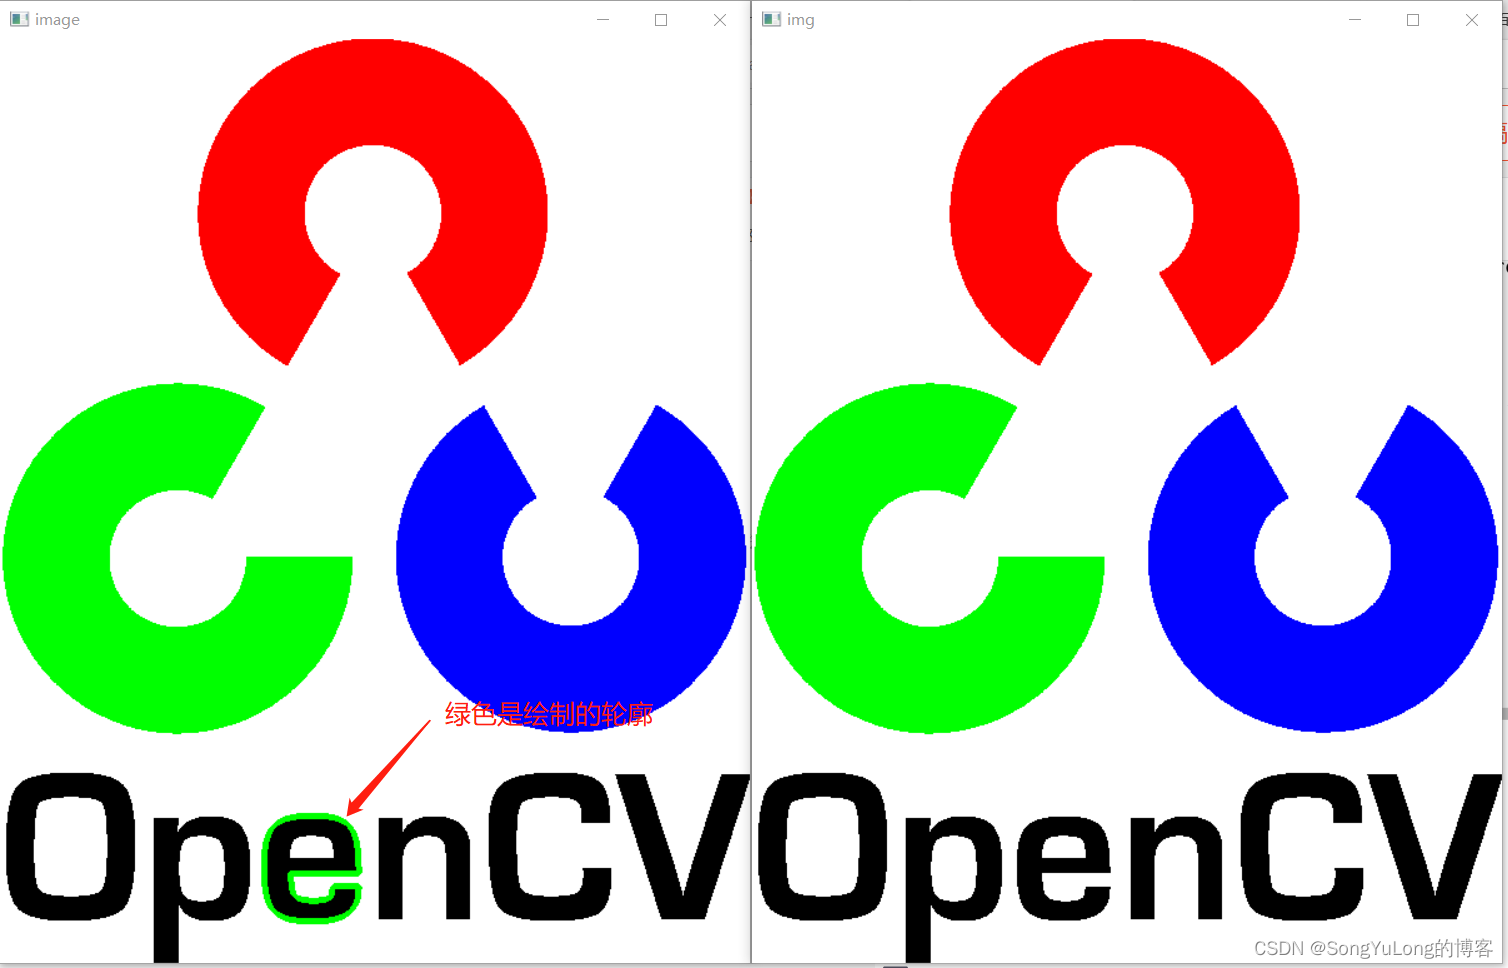
绘制轮廓
函数 cv2.drawContours() 可以被用来绘制轮廓。它可以根据你提供的边界点绘制任何形状。它的第一个参数是原始图像,第二个参数是轮廓,一个 Python 列表。第三个参数是轮廓的索引(在绘制独立轮廓是很有用,当设置为 -1 时绘制所有轮廓)。接下来的参数是轮廓的颜色和厚度等。
- 绘制所有轮廓 image = cv2.drawContours(img, contours, -1, (0, 255, 0), 3)
- 绘制指定轮廓 image = cv2.drawContours(img, contours, 0, (0, 255, 0), 3)
import numpy as np
import cv2

# 轮廓:连着边界连续的点连在一起的曲线,具有相同的颜色或者灰度。
# 轮廓在形状分析和物体的检测和识别中很有用。

# 1.为了准确,要使用二值化图像。需要进行阀值化处理或Canny边界检测。
# 2.查找轮廓的函数会修改元素图像。
# 3.在OpenCV中,查找轮廓就像在黑色背景中找白色物体。

# cv2.findContours() # 查找轮廓
# cv2.drawContours() # 绘制轮廓

img = cv2.imread('./resource/image/opencv-logo2.png')
imgcp = cv2.imread('./resource/image/opencv-logo2.png')
imgray = cv2.cvtColor(img, cv2.COLOR_BGR2GRAY)


ret, thresh = cv2.threshold(imgray, 127, 255, 0)
contours, hierarchy = cv2.findContours(thresh, cv2.RETR_TREE, cv2.CHAIN_APPROX_SIMPLE)
# contours 轮廓
# hierarchy 层次

# image = cv2.drawContours(img, contours, -1, (0, 255, 0), 3) # 绘制所有轮廓
image = cv2.drawContours(img, contours, 3, (0, 255, 0), 3) # 绘制第4个轮廓
print(cv2.getVersionString())
print(type(contours))
print(len(contours))
cv2.imshow('img', imgcp)
cv2.imshow('image', image)
cv2.waitKey(0)
cv2.destroyAllWindows()
轮廓特征
- 查找轮廓的不同特征:矩、面积、周长(也叫弧长)、重心、边界框等
图像的矩
- 在图像处理、计算机视觉和相关领域,图像矩是图像像素强度的某个特定的加权平均值(矩),或者是这种矩的函数,通常被选择为具有某种吸引人的特性或解释。图像矩在分割后对描述物体很有用。通过图像矩找到的图像的简单属性包括面积(或总强度)、其中心点和关于其方向的信息。
- 图像的矩可以帮助我们计算图像的质心,面积等。
- 函数cv2.moments()计算得到矩,返回一个字典。
根据矩值可以计算对象的重心:
C x = M 10 M 00 , C y = M 01 M 00 C_x=\frac{M_{10}}{M_{00}},C_y=\frac{M_{01}}{M_{00}} Cx=M00M10,Cy=M00M01
import numpy as np
import cv2
from matplotlib import pyplot as plt

# 矩:图像的矩可以帮助我们计算图像的质心,面积等
# cv2.moments() 计算得到矩,以一个字典形式返回

# 读取图像
img = cv2.imread('./resource/opencv/image/box2.png', cv2.IMREAD_COLOR)
img1 = img.copy()
gray = cv2.imread('./resource/opencv/image/box2.png', cv2.IMREAD_GRAYSCALE)

# 阀值处理
(ret, thresh) = cv2.threshold(gray, 127, 255, cv2.THRESH_BINARY)

# 查找所有轮廓
(contours, hierarchy) = cv2.findContours(thresh, cv2.RETR_TREE, cv2.CHAIN_APPROX_SIMPLE)
print('找到轮廓数:',len(contours))

# 计算轮廓索引为0的图像矩
cnt = contours[0]
M = cv2.moments(cnt)
print('moments()计数结果M:',M)

# 计算重心(质点)
#根据这些矩值计算出对象的重心:
# Cx = M10/M00
# Cy = M01/M00
cx = int(M['m10']/M['m00'])
cy = int(M['m01']/M['m00'])
print(cx,cy)

# 绘制轮廓
cv2.drawContours(img1, contours, 0, (0, 255, 0), 2)

# 绘制质点
cv2.circle(img1, (cx, cy), 5, (255, 0, 0), -1)

plt.subplot(121), plt.imshow(img)
plt.subplot(122), plt.imshow(img1)
plt.show()
程序运行结果:
找到轮廓数: 1
moments()计数结果M: {‘m00’: 10032.0, ‘m10’: 1294128.0, ‘m01’: 1284096.0, ‘m20’: 177807168.0, ‘m11’: 165648384.0, ‘m02’: 170838272.0, ‘m30’: 25740205920.0, ‘m21’: 22759317504.0, ‘m12’: 22038137088.0, ‘m03’: 23524638720.0, ‘mu20’: 10864656.0, ‘mu11’: 0.0, ‘mu02’: 6473984.0, ‘mu30’: 0.0, ‘mu21’: 0.0, ‘mu12’: 0.0, ‘mu03’: 0.0, ‘nu20’: 0.10795454545454546, ‘nu11’: 0.0, ‘nu02’: 0.06432748538011696, ‘nu30’: 0.0, ‘nu21’: 0.0, ‘nu12’: 0.0, ‘nu03’: 0.0}
质点: 129 128
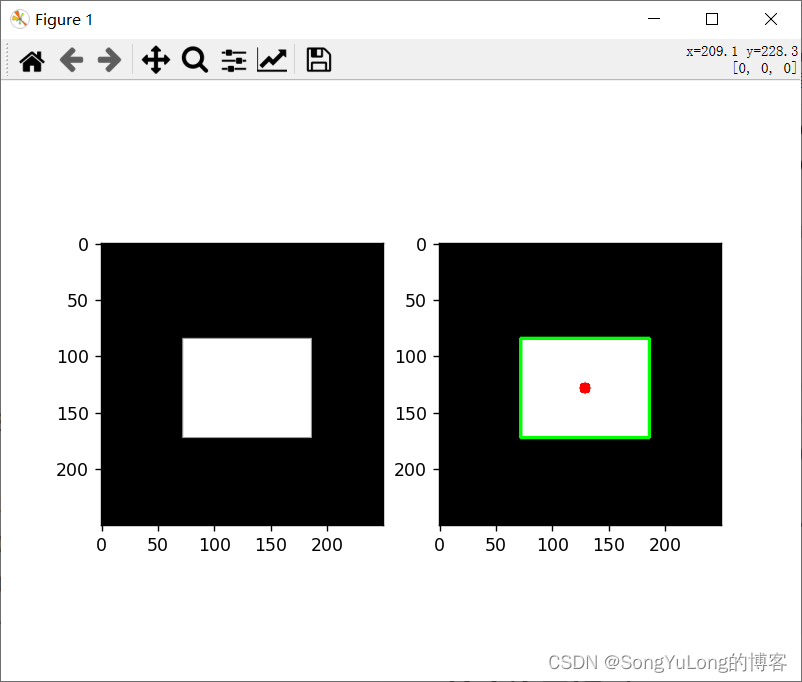
下图红色圆点是质点,绿色框是轮廓:
轮廓面积
- 轮廓的面积可以使用函数 cv2.contourArea() 计算得到,也可以使用矩
( 0 阶矩), M[‘m00’]。 - area = cv2.contourArea(cnt)
import numpy as np
import cv2
from matplotlib import pyplot as plt

img = cv2.imread('./resource/opencv/image/box2.png', cv2.IMREAD_COLOR)
gray = cv2.cvtColor(img, cv2.COLOR_BGR2GRAY)

(ret, thresh) = cv2.threshold(gray, 127, 255, cv2.THRESH_BINARY)
(contours, hierarchy) = cv2.findContours(thresh, cv2.RETR_TREE, cv2.CHAIN_APPROX_SIMPLE)

cnt = contours[0]
M = cv2.moments(cnt)
area = cv2.contourArea(cnt)
print(cnt)
print(area)
print(M['m00'])
[[[ 72 84]]
[[ 72 172]]
[[186 172]]
[[186 84]]]
10032.0
10032.0
轮廓周长(弧长)
- 也被称为弧长。可以使用函数 cv2.arcLength() 计算得到。这个函数的第二参数可以用来指定对象的形状是闭合的( True),还是打开的(一条曲线)。
- perimeter = cv2.arcLength(cnt,True)
import numpy as np
import cv2

img = cv2.imread('./resource/opencv/image/box2.png', cv2.IMREAD_COLOR)
gray = cv2.cvtColor(img, cv2.COLOR_BGR2GRAY)

(ret, thresh) = cv2.threshold(gray, 127, 255, cv2.THRESH_BINARY)
(contours, hierarchy) = cv2.findContours(thresh, cv2.RETR_TREE, cv2.CHAIN_APPROX_SIMPLE)

# 第一个参数轮廓,第二次参数形状闭合的(True),还是打开的一条曲线
perimeter = cv2.arcLength(contours[0], True)
print(perimeter) #404.0
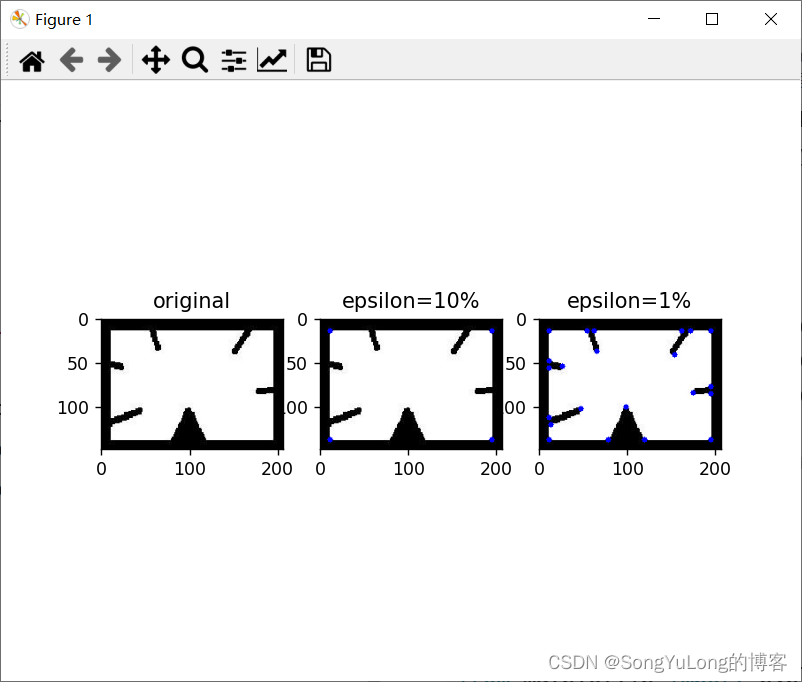
轮廓近似
- 将轮廓形状近似到另外一种由更少点组成的轮廓形状,新轮廓的点的数目由我们设定的准确度来决定。使用的Douglas-Peucker算法,维基百科获得更多此算法的细节。
- 假设要在一幅图像中查找一个矩形,但是由于图像的种种原因,我们不能得到一个完美的矩形,而是一个“坏形状”。现在你就可以使用这个函数来近似这个形状()了。
- epsilon = 0.1*cv2.arcLength(cnt,True)
approx = cv2.approxPolyDP(cnt,epsilon,True)
import numpy as np
import cv2
from matplotlib import pyplot as plt

img = cv2.imread('./resource/opencv/image/approx2.jpg', cv2.IMREAD_COLOR)
img_draw1 = img.copy()
img_draw2 = img.copy()

gray = cv2.cvtColor(img, cv2.COLOR_BGR2GRAY)
(ret, thresh) = cv2.threshold(gray, 127, 255, cv2.THRESH_BINARY)
(contours, hierarchy) = cv2.findContours(thresh, cv2.RETR_TREE, cv2.CHAIN_APPROX_SIMPLE)

# epsilon=10%
epsilon01 = 0.1 * cv2.arcLength(contours[0], True)
# epsilon=1%
epsilon001  = 0.01 * cv2.arcLength(contours[0], True)
approx_01 = cv2.approxPolyDP(contours[0], epsilon01, True)
approx_001 = cv2.approxPolyDP(contours[0], epsilon001, True)

cv2.drawContours(img_draw1, approx_01, -1, (0, 0, 255), 5)
cv2.drawContours(img_draw2, approx_001, -1, (0, 0, 255), 5)

plt.subplot(131), plt.imshow(img), plt.title('original')
plt.subplot(132), plt.imshow(img_draw1), plt.title('epsilon=10%')
plt.subplot(133), plt.imshow(img_draw2), plt.title('epsilon=1%')
plt.show()
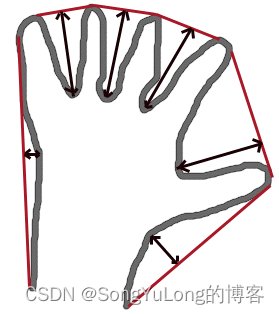
凸包
- 凸包与轮廓近似相似,但不同,虽然有些情况下它们给出的结果是一样的。
- 函数 cv2.convexHull() 可以用来检测一个曲线是否具有凸性缺陷,并能纠正缺陷。
hull = cv2.convexHull(points[, hull[, clockwise[, returnPoints]])
参数:
points:传入的轮廓
hull:输出,通常不需要
clockwise:方向标志,True:输出的凸包是顺时针方向,False:逆时针方向。
returnPoints:默认值为True:返回凸包上点的坐标。False:返回与凸包点对应的轮廓上的点。 - 获取凸包:hull = cv2.convexHull(cnt)
- 一般来说,凸性曲线总是凸出来的,至少是平的。如果有地方凹进去了就被叫做凸性缺陷。例如下图中的手。红色曲线显示了手的凸包,凸性缺陷被双箭头标出来了。
凸性检测
- cv2.isContourConvex() 可以可以用来检测一个曲线是不是凸
的。它只能返回 True 或 False。k = cv2.isContourConvex(cnt)
import numpy as np
import cv2
from matplotlib import pyplot as plt


# img = cv2.imread('./resource/opencv/image/Back_Projection_Theory2.jpg')
img = cv2.imread('./resource/opencv/image/shape.jpg')

gray = cv2.cvtColor(img.copy(), cv2.COLOR_BGR2GRAY)

# 二值化
(ret, thresh) = cv2.threshold(gray, 120, 255, cv2.THRESH_BINARY)
# (ret, thresh) = cv2.threshold(gray, 0, 255, cv2.THRESH_BINARY + cv2.THRESH_OTSU)
# thresh = cv2.adaptiveThreshold(gray, 255, cv2.ADAPTIVE_THRESH_MEAN_C, cv2.THRESH_BINARY, 11, 2)
# thresh = cv2.adaptiveThreshold(gray, 255, cv2.ADAPTIVE_THRESH_GAUSSIAN_C, cv2.THRESH_BINARY, 5, 2)

# 查找轮廓
(contours, his) = cv2.findContours(thresh, cv2.RETR_TREE, cv2.CHAIN_APPROX_SIMPLE)

hull_img = img.copy()
for i in range(len(contours)):
    hull = cv2.convexHull(contours[i])
    isConvex = cv2.isContourConvex(contours[i])
    print(hull)
    print(isConvex)
    # 绘制凸包
    cv2.drawContours(hull_img, hull, -1, (0, 255, 0), 2)

# 绘制轮廓
contours = cv2.drawContours(img.copy(), contours, -1, (255, 0, 0), 2)


plt.subplot(231), plt.imshow(cv2.cvtColor(img, cv2.COLOR_BGR2RGB)), plt.title('img'), plt.xticks([]), plt.yticks([])
plt.subplot(232), plt.imshow(cv2.cvtColor(gray, cv2.COLOR_BGR2RGB)), plt.title('gray'), plt.xticks([]), plt.yticks([])
plt.subplot(233), plt.imshow(cv2.cvtColor(thresh, cv2.COLOR_BGR2RGB)), plt.title('thresh'), plt.xticks([]), plt.yticks([])
plt.subplot(234), plt.imshow(cv2.cvtColor(contours, cv2.COLOR_BGR2RGB)), plt.title('contours'), plt.xticks([]), plt.yticks([])
plt.subplot(235), plt.imshow(cv2.cvtColor(hull_img, cv2.COLOR_BGR2RGB)), plt.title('convex'), plt.xticks([]), plt.yticks([])
plt.show()
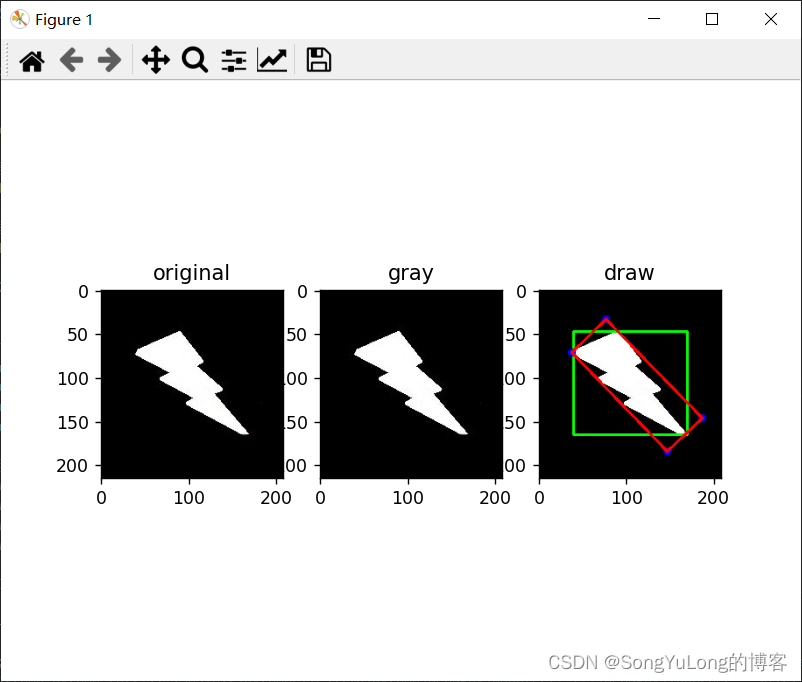
边界矩形
边界矩形有两类:
- 直边界矩形
- 旋转边界矩形
直边界矩形
- 直边界矩形:一个直矩形(就是没有旋转的矩形)。它不会考虑对象是否旋转。所以边界矩形的面积不是最小的。可以使用函数
- cv2.boundingRect() 函数获取直边界矩形。( x, y)为矩形左上角的坐标,( w, h)是矩形的宽和高。
x,y,w,h = cv2.boundingRect(cnt)
img = cv2.rectangle(img,(x,y),(x+w,y+h),(0,255,0),2)
旋转边界矩形(最小面积矩形)
- 旋转的边界矩形:这个边界矩形是面积最小的,因为它考虑了对象的旋转。
- cv2.minAreaRect()函数获取旋转边界矩形。返回的是一个 Box2D 结构,其中包含矩形中心点坐标( x, y),矩形的宽和高( w, h),以及旋转角度。
(center(x,y), (width, height), angle of rotation) = cv2.minAreaRect(points) - cv2.boxPoints() 函数获取旋转边界矩形的 4 个角点。
[[x1, y1],[x2, y2], [x3, y3], [x4, y4]] = cv2.boxPoints(points)
import numpy as np
import cv2
from matplotlib import pyplot as plt

# 轮廓边界矩形 分为两种:直边界矩形、旋转边界矩形

# 读取图像
img = cv2.imread('./resource/opencv/image/boundrect.jpg', cv2.IMREAD_COLOR)
draw = img.copy()

# 转为灰度并二值化处理
gray = cv2.cvtColor(img, cv2.COLOR_BGR2GRAY)
(ret, thresh) = cv2.threshold(gray, 127, 255, cv2.THRESH_BINARY)
(contours, hierarchy) = cv2.findContours(thresh, cv2.RETR_TREE, cv2.CHAIN_APPROX_SIMPLE)

# 获取直边界矩形
x,y,w,h = cv2.boundingRect(contours[0])
print(x,y,w,h)
# 绘制直边界矩形
draw = cv2.rectangle(draw, (x, y), (x+w, y+h), (0, 255, 0), 2)

# 获取旋转边界矩形 获取Box2D结构 (center(x,y), (width, height), angle of rotation)
box2d = cv2.minAreaRect(contours[0])
print(box2d)
# 获取Box2D矩形4个角点坐标,[[x1, y1],[x2, y2], [x3, y3], [x4, y4]]
boxpoints = cv2.boxPoints(box2d)
print(boxpoints)
boxpoints = np.int32(boxpoints)
print(boxpoints[0])

# 画 旋转边界矩形4个角点
draw = cv2.circle(draw, tuple(boxpoints[0]) , 3, (255, 0, 0), 2)
draw = cv2.circle(draw, tuple(boxpoints[1]) , 3, (255, 0, 0), 2)
draw = cv2.circle(draw, tuple(boxpoints[2]) , 3, (255, 0, 0), 2)
draw = cv2.circle(draw, tuple(boxpoints[3]) , 3, (255, 0, 0), 2)

# 画 旋转边界矩形 矩形框
draw = cv2.line(draw, tuple(boxpoints[0]), tuple(boxpoints[1]), (0, 0, 255), 2)
draw = cv2.line(draw, tuple(boxpoints[1]), tuple(boxpoints[2]), (0, 0, 255), 2)
draw = cv2.line(draw, tuple(boxpoints[2]), tuple(boxpoints[3]), (0, 0, 255), 2)
draw = cv2.line(draw, tuple(boxpoints[3]), tuple(boxpoints[0]), (0, 0, 255), 2)

plt.subplot(131), plt.imshow(cv2.cvtColor(img, cv2.COLOR_BGR2RGB)), plt.title('original')
plt.subplot(132), plt.imshow(cv2.cvtColor(gray, cv2.COLOR_BGR2RGB)), plt.title('gray')
plt.subplot(133), plt.imshow(cv2.cvtColor(draw, cv2.COLOR_BGR2RGB)), plt.title('draw')
plt.show()
下图"draw"标题的图片绿色矩形是轮廓的直边界矩形,红色矩形是轮廓的旋转边界矩形(最小面积矩形),蓝色的4个点是旋转边界矩形的四个角点:
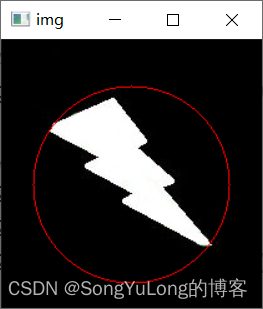
最小外接圆
- 能包括对象所有的圆中面积最小的一个。
- cv2.minEnclosingCircle() 获取最小外接圆
(x,y),radius = cv2.minEnclosingCircle(cnt)
import numpy as np
import cv2
from matplotlib import pyplot as plt

# 读取图像
img = cv2.imread('./resource/opencv/image/boundrect.jpg', cv2.IMREAD_COLOR)

# 转为灰度并二值化
gray = cv2.cvtColor(img, cv2.COLOR_BGR2GRAY)
(ret, thresh) = cv2.threshold(gray, 127, 255, cv2.THRESH_BINARY)

# 查找对象轮廓
(contours, hierarchy) = cv2.findContours(thresh, cv2.RETR_TREE, cv2.CHAIN_APPROX_SIMPLE)

# 根据轮廓查找对象最小外接圆
(x,y), radius = cv2.minEnclosingCircle(contours[0])
print((x,y), radius)

# 画 对象最小外接圆
img = cv2.circle(img, (int(x), int(y)), int(radius), (0, 0, 255), 1)

# 显示图像
cv2.imshow('img', img)
cv2.waitKey(0)
cv2.destroyAllWindows()
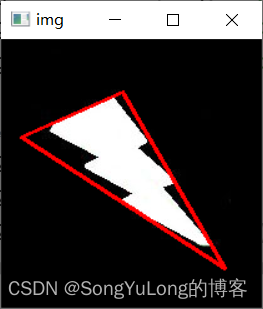
最小外接三角
- 能包括对象所有的三角形中面积最小的一个。
- cv2.minEnclosingTriangle():返回 area, [[[x1, y1]],[[x2, y2]], [[x3, y3]]]
area, triangle = cv2.minEnclosingTriangle(points)
import numpy as np
import cv2

# 读取图像
img = cv2.imread('./resource/opencv/image/boundrect.jpg', cv2.IMREAD_COLOR)

# 转为灰度并做二值化处理
gray = cv2.cvtColor(img, cv2.COLOR_BGR2GRAY)
(ret, thresh) = cv2.threshold(gray, 127, 255, cv2.THRESH_BINARY)

# 查找轮廓
(contours, hierarchy) = cv2.findContours(thresh, cv2.RETR_TREE, cv2.CHAIN_APPROX_SIMPLE)

# 根据轮廓获取对象的最小外接三角, area, [[[x1, y1]],[[x2, y2]], [[x3, y3]]]
area, triangle = cv2.minEnclosingTriangle(contours[0])
print(area)
print(triangle)

# 最小外接三角的3个角点坐标转为整型(获取到的是浮点型,不能用于图形绘制)
triangle = np.int32(triangle)
print(triangle[0][0])
print(triangle[1][0])
print(triangle[2][0])

# 绘制最小外接三角
img = cv2.line(img, tuple(triangle[0][0]), tuple(triangle[1][0]), (0, 0, 255), 2)
img = cv2.line(img, tuple(triangle[1][0]), tuple(triangle[2][0]), (0, 0, 255), 2)
img = cv2.line(img, tuple(triangle[2][0]), tuple(triangle[0][0]), (0, 0, 255), 2)

# 显示图像
cv2.imshow('img', img)
cv2.waitKey(0)
cv2.destroyAllWindows()
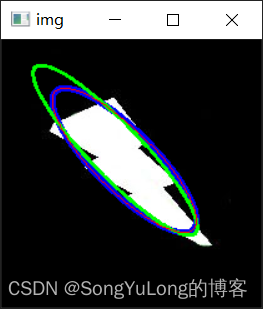
椭圆拟合
- cv2.ellipse(),返回值其实就是旋转边界矩形的内切圆
import numpy as np
import cv2

img = cv2.imread('./resource/opencv/image/boundrect.jpg', cv2.IMREAD_COLOR)

gray = cv2.cvtColor(img, cv2.COLOR_BGR2GRAY)
(ret, thresh) = cv2.threshold(gray, 127, 255, cv2.THRESH_BINARY)

(contuors, hierarchy) = cv2.findContours(thresh, cv2.RETR_TREE, cv2.CHAIN_APPROX_SIMPLE)

ellipse1 = cv2.fitEllipse(contuors[0])
ellipse2 = cv2.fitEllipseAMS(contuors[0])
ellipse3 = cv2.fitEllipseDirect(contuors[0])
print(ellipse1)
print(ellipse2)
print(ellipse3)

img = cv2.ellipse(img, ellipse1, (255, 0, 0), 3)
img = cv2.ellipse(img, ellipse2, (0, 255, 0), 2)
img = cv2.ellipse(img, ellipse3, (0, 0, 255), 1)

cv2.imshow('img', img)
cv2.waitKey(0)
cv2.destroyAllWindows()
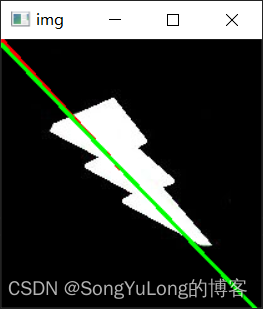
直线拟合
- 根据一组点拟合出一条直线,同样也可以为图像中的白色点拟合出一条直线。
import numpy as np
import cv2

img = cv2.imread('./resource/opencv/image/boundrect.jpg', cv2.IMREAD_COLOR)

gray = cv2.cvtColor(img, cv2.COLOR_BGR2GRAY)
(ret, thresh) = cv2.threshold(gray, 127, 255, cv2.THRESH_BINARY)

(contuors, hierarchy) = cv2.findContours(thresh, cv2.RETR_TREE, cv2.CHAIN_APPROX_SIMPLE)

# 获取并绘制 直线拟合,直接绘制获取的坐标只有一半的线段
L = cv2.fitLine(contuors[0], cv2.DIST_L2, 0, 0.01, 0.01)
L = np.int32(L)
img = cv2.line(img, (L[0][0], L[1][0]), (L[2][0], L[3][0]), (0, 0, 255), 2)


# 获取并绘制 计算出整幅图的直线拟合线
rows, cols = img.shape[:2]
[vx,vy,x,y] = cv2.fitLine(contuors[0], cv2.DIST_L2,0,0.01,0.01)
lefty = int((-x*vy/vx) + y)
righty = int(((cols-x)*vy/vx)+y)
img = cv2.line(img,(cols-1,righty),(0,lefty),(0,255,0),2)


cv2.imshow('img', img)
cv2.waitKey(0)
cv2.destroyAllWindows()
轮廓的性质
长宽比
边界矩形的长宽比:
A
s
p
e
c
t
R
a
t
i
o
n
=
W
i
d
t
h
H
e
i
g
h
t
Aspect Ration = \frac{Width}{Height}
AspectRation=HeightWidth
x,y,w,h = cv2.boundingRect(points)
aspect_ratio = float(w)/h
轮廓面积与边界矩形面积的比(Extent)
轮廓面积与边界矩形面积的比:
E
x
t
e
n
t
=
O
b
j
e
c
t
A
r
e
a
B
o
u
n
d
i
n
g
R
e
c
t
a
n
g
l
e
A
r
e
a
Extent = \frac{Object Area}{Bounding Rectangle Area}
Extent=BoundingRectangleAreaObjectArea
area = cv2.contourArea(cnt)
x,y,w,h = cv2.boundingRect(cnt)
rect_area = w*h
extent = float(area)/rect_area
轮廓面积与凸包面积的比(Solidity)
轮廓面积与凸包面积的比:
S
o
l
i
d
i
t
y
=
C
o
n
t
o
u
r
A
r
e
a
C
o
n
v
e
x
H
u
l
l
A
r
e
a
Solidity= \frac{Contour Area}{Convex Hull Area}
Solidity=ConvexHullAreaContourArea
area = cv2.contourArea(cnt)
hull = cv2.convexHull(cnt)
hull_area = cv2.contourArea(hull)
solidity = float(area)/hull_area
与轮廓面积相等的圆形的直径(Equivalent Diameter)
与轮廓面积相等的圆形的直径:
E
q
u
i
v
a
l
e
n
t
D
i
a
m
e
t
e
r
=
4
∗
C
o
n
t
o
u
r
A
r
e
a
π
Equivalent Diameter = \sqrt{\frac{4*Contour Area}{\pi}}
EquivalentDiameter=π4∗ContourArea
area = cv2.contourArea(cnt)
equi_diameter = np.sqrt(4*area/np.pi)
轮廓对象的方向
- (x,y),(MA,ma),angle = cv2.fitEllipse(cnt)
- 返回中心坐标,长轴和短轴的长度,对象的方向。
轮廓的掩模和像素点
有时我们需要构成对象的所有像素点:
mask = np.zeros(imgray.shape,np.uint8)
这里一定要使用参数-1, 绘制填充的的轮廓
cv2.drawContours(mask,[cnt],0,255,-1)
pixelpoints = np.transpose(np.nonzero(mask))
或
pixelpoints = cv2.findNonZero(mask)
最大值和最小值及它们的位置
可以使用掩模图像得到这些参数:
min_val, max_val, min_loc, max_loc = cv2.minMaxLoc(imgray,mask = mask)
平均颜色及平均灰度
可以使用相同的掩模求一个对象的平均颜色或平均灰度:
mean_val = cv2.mean(im,mask = mask)
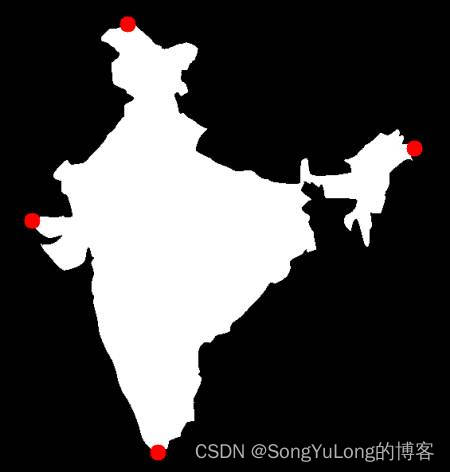
对象轮廓的极点
- 一个对象最上面,最下面,最左边,最右边的点。
leftmost = tuple(cnt[cnt[:,:,0].argmin()][0])
rightmost = tuple(cnt[cnt[:,:,0].argmax()][0])
topmost = tuple(cnt[cnt[:,:,1].argmin()][0])
bottommost = tuple(cnt[cnt[:,:,1].argmax()][0])
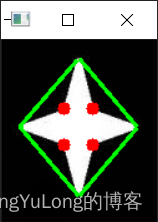
轮廓的凸缺陷
- cv.convexityDefect()以帮助我们找到凸缺陷。函数调用如下:
hull = cv2.convexHull(cnt,returnPoints = False)
defects = cv2.convexityDefects(cnt,hull)
它会返回一个数组,其中每一行包含的值是 [起点,终点,最远的点,到最远点的近似距离]。我们可以在一张图上显示它。我们将起点和终点用一条绿线连接,在最远点画一个圆圈,要记住的是返回结果的前三个值是轮廓点的索引。所以我们还要到轮廓点中去找它们。
import numpy as np
import cv2

img = cv2.imread('./resource/opencv/image/shape.jpg', cv2.IMREAD_COLOR)
gray = cv2.cvtColor(img, cv2.COLOR_BGR2GRAY)

(ret, thresh) = cv2.threshold(gray, 127, 255, cv2.THRESH_BINARY)
contours, hierarchy = cv2.findContours(thresh, cv2.RETR_TREE, cv2.CHAIN_APPROX_SIMPLE)
cnt = contours[0]

hull = cv2.convexHull(cnt, returnPoints=False)
defects = cv2.convexityDefects(cnt, hull)

for i in range(defects.shape[0]):
    s,e,f,d = defects[i, 0]
    start = tuple(cnt[s][0])
    end = tuple(cnt[e][0])
    far = tuple(cnt[f][0])
    cv2.line(img, start, end, [0, 255, 0], 2)
    cv2.circle(img, far, 5, [0, 0, 255], -1)

cv2.imshow('img', img)
cv2.waitKey(0)
cv2.destroyAllWindows()
点到轮廓的最短距离
求解一个点到轮廓的最短距离:
- dist = cv2.pointPolygonTest(contours[0], (20, 20), True)
measureDist=True,返回结果:
小于零:点在轮廓外部。
等于零:点在轮廓线上。
大于零:点在轮廓内部。 - stat = cv2.pointPolygonTest(contours[0], (20, 20), False)
measureDist=False,返回结果:
-1:点在轮廓外部
0:点在轮廓线上。
1:点在轮廓内部。
import numpy as np
import cv2

img = cv2.imread('./resource/opencv/image/shape.jpg', cv2.IMREAD_COLOR)
gray = cv2.cvtColor(img, cv2.COLOR_BGR2GRAY)

(ret, thresh) = cv2.threshold(gray, 127, 255, cv2.THRESH_BINARY)
(contours, hierarchy) = cv2.findContours(thresh, cv2.RETR_TREE, cv2.CHAIN_APPROX_SIMPLE)

# 求解图像中的一个点到一个对象轮廓的最短距离。
# 小于零:点在轮廓外部。
# 等于零:点在轮廓线上。
# 大于零:点在轮廓内部。
dist = cv2.pointPolygonTest(contours[0], (20, 20), True)

#-1:点在轮廓外部
# 0:点在轮廓线上。
# 1:点在轮廓内部。
stat = cv2.pointPolygonTest(contours[0], (20, 20), False)

print(dist)
print(stat)
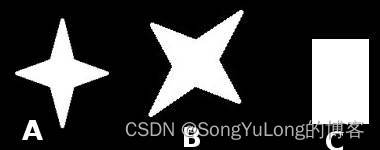
形状匹配
- match = cv2.matchShapes(cntA, cntB, cv2.CONTOURS_MATCH_I1, 0.0)
返回值越小表示两个图形越相似。
有3中匹配方法:
- cv2.CONTOURS_MATCH_I1
- cv2.CONTOURS_MATCH_I2
- cv2.CONTOURS_MATCH_I3
import numpy as np
import cv2
from matplotlib import pyplot as plt


img = cv2.imread('./resource/opencv/image/matchshapesA.jpg', cv2.IMREAD_COLOR)
imgA = cv2.imread('./resource/opencv/image/matchshapesA.jpg', cv2.IMREAD_COLOR)
imgB = cv2.imread('./resource/opencv/image/matchshapesB.jpg', cv2.IMREAD_COLOR)
imgC = cv2.imread('./resource/opencv/image/matchshapesC.jpg', cv2.IMREAD_COLOR)

gray = cv2.cvtColor(img, cv2.COLOR_BGR2GRAY)
grayA = cv2.cvtColor(imgA, cv2.COLOR_BGR2GRAY)
grayB = cv2.cvtColor(imgB, cv2.COLOR_BGR2GRAY)
grayC = cv2.cvtColor(imgC, cv2.COLOR_BGR2GRAY)

(ret, th) = cv2.threshold(gray, 127, 255, cv2.THRESH_BINARY)
(retA, thA) = cv2.threshold(grayA, 127, 255, cv2.THRESH_BINARY)
(retB, thB) = cv2.threshold(grayB, 127, 255, cv2.THRESH_BINARY)
(retC, thC) = cv2.threshold(grayC, 127, 255, cv2.THRESH_BINARY)

(contours, hierarchy) = cv2.findContours(th, cv2.RETR_TREE, cv2.CHAIN_APPROX_SIMPLE)
(contoursA, hierarchyA) = cv2.findContours(thA, cv2.RETR_TREE, cv2.CHAIN_APPROX_SIMPLE)
(contoursB, hierarchyB) = cv2.findContours(thB, cv2.RETR_TREE, cv2.CHAIN_APPROX_SIMPLE)
(contoursC, hierarchyC) = cv2.findContours(thC, cv2.RETR_TREE, cv2.CHAIN_APPROX_SIMPLE)

cnt = contours[0]
cntA = contoursA[0]
cntB = contoursB[0]
cntC = contoursC[0]

m1 = cv2.matchShapes(cnt, cntA, cv2.CONTOURS_MATCH_I1, 0.0)
m2 = cv2.matchShapes(cnt, cntB, cv2.CONTOURS_MATCH_I1, 0.0)
m3 = cv2.matchShapes(cnt, cntC, cv2.CONTOURS_MATCH_I1, 0.0)

# 程序运行结果
print(m1) # A与A的匹配度:0.0
print(m2) # A与B的匹配度:0.010547834665352251
print(m3) # A与C的匹配度:0.3313932685758914
从结果可以看出两个图形越相似值就越小,计算结果和图形的旋转相关性小,和图形的形状差异相关性大:
轮廓的层次结构
(contours, hierarchy) = cv2.findContours(th, mode, method)
轮廓的检索模式mode有如下几种:
-
cv2.RETR_LIST:只是提取所有的轮廓,而不去创建任何父子关系。换句话说就是“人人平等”,所有轮廓属于同一级组织轮廓。
-
cv2.RETR_TREE:返回所有轮廓,并且创建一个完整的组织结构列表。它甚至会告诉你谁是爷爷,爸爸,儿子,孙子等。
-
cv2.RETR_CCOMP:返回所有的轮廓并将轮廓分为两级组织结构。
-
cv2.RETR_EXTERNAL:只会返回最外边的的轮廓,所有的子轮廓都会被忽略掉。
-
不管层次结构是什么样的,每一个轮廓都包含自己的信息:谁是父,谁是子等。 OpenCV 使用一个含有四个元素的数组表示。 [Next, Previous,First_Child, Parent]。
-
Next 表示同一级组织结构中的下一个轮廓。以下图中的轮廓 0 为例,轮廓 1 就是他的 Next。同样,轮廓 1 的 Next是 2, Next=2。那轮廓 2 呢?在同一级没有 Next。这时 Next=-1。而轮廓 4 的 Next为 5,所以它的 Next=5。
-
Previous 表示同一级结构中的前一个轮廓。与前面一样,轮廓 1 的 Previous 为轮廓 0,轮廓 2 的 Previous 为轮廓 1。轮廓 0 没有 Previous,所以 Previous=-1。
-
First_Child 表示它的第一个子轮廓。没有必要再解释了,轮廓 2 的子轮廓为 2a。所以它的 First_Child 为2a。那轮廓 3a 呢?它有两个子轮廓。但是我们只要第一个子轮廓,所以是轮廓 4(按照从上往下,从左往右的顺序排序)。
-
Parent 表示它的父轮廓。与 First_Child 刚好相反。轮廓 4 和 5 的父轮廓是轮廓 3a。而轮廓 3a的父轮廓是 3。
轮廓的层次结构,比如轮廓之间的父子关系:
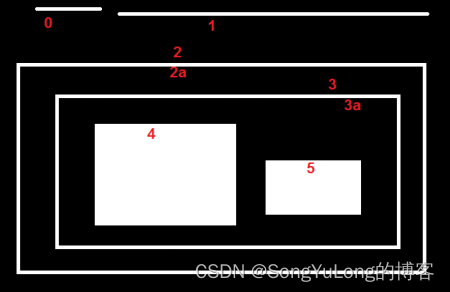
在这幅图像中,给这几个形状编号为 0-5。 2 和 2a 分别代表最外边矩形
的外轮廓和内轮廓。在这里边轮廓 0, 1, 2 在外部或最外边。我们可以称他们为(组织结构)0 级,简单来说就是他们属于同一级。


 4999
4999


 被折叠的 条评论
为什么被折叠?
被折叠的 条评论
为什么被折叠?
 到【灌水乐园】发言


