


Create a two-column vector of points at which to evaluate the density.
gridx1 = -0.25:.05:1.25;
gridx2 = 0:.1:15;
[x1,x2] = meshgrid(gridx1, gridx2);
x1v = x1(:);
x2v = x2(:);
pts = [x1v x2v];
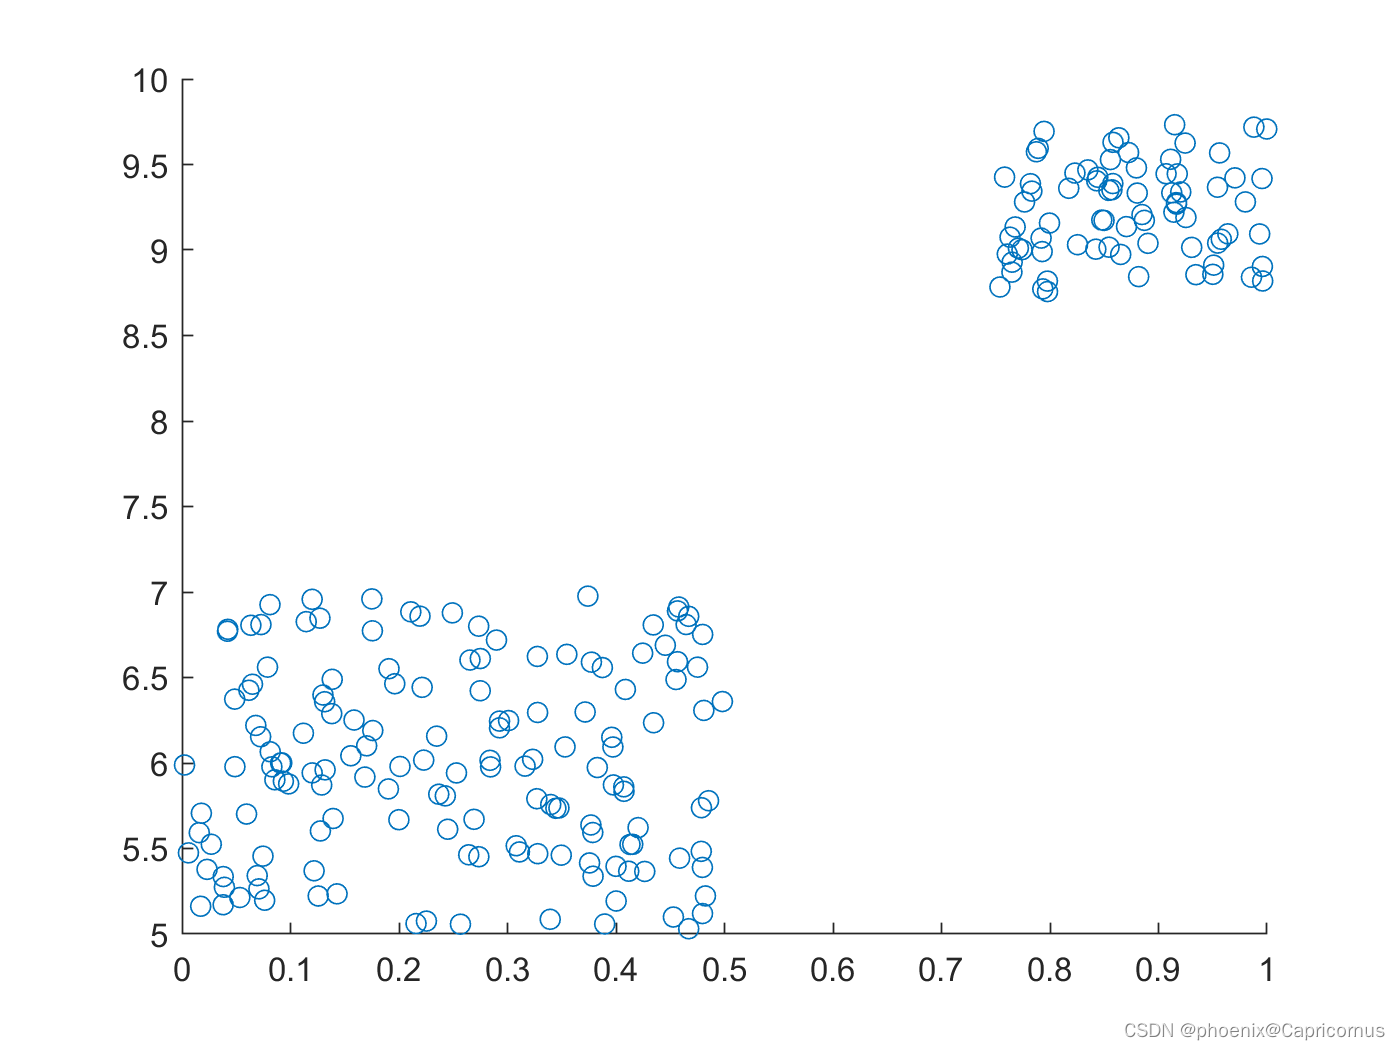
Generate a 30-by-2 matrix containing random numbers from a mixture of bivariate normal distributions.
rng('default')  % For reproducibility
x = [0+.5*rand(150,1) 5+2*rand(150,1);
            .75+.25*rand(75,1) 8.75+rand(75,1)];
n = size(x,1);
figure; scatter(x(:,1),x(:,2))
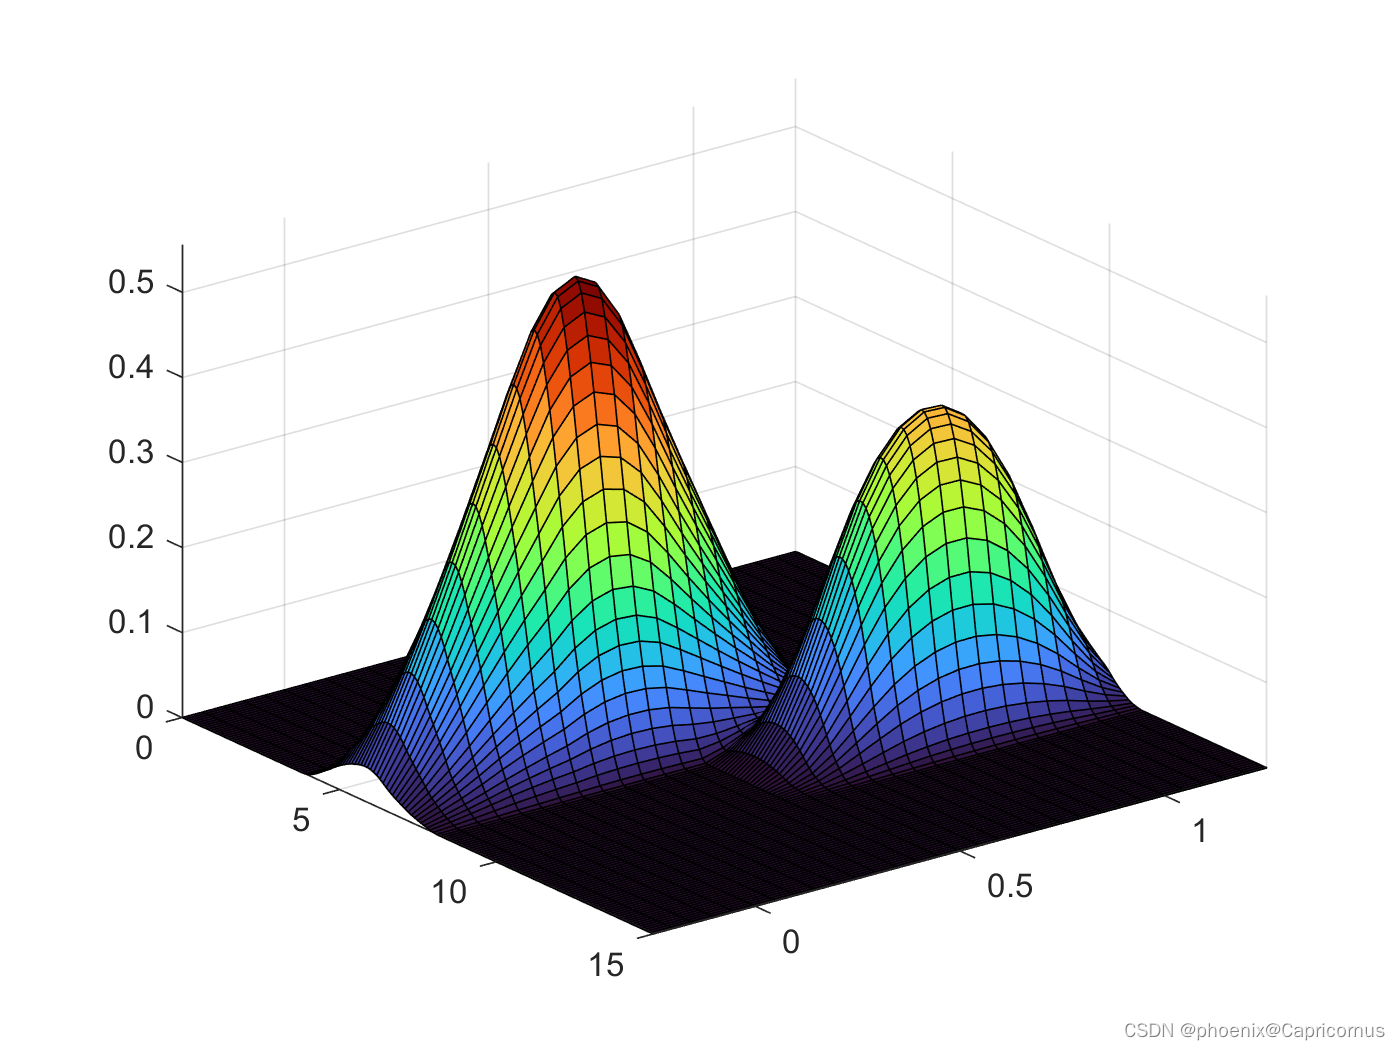
Plot the estimated density of the sample data.
[f,xi,bw] = ksdensity(x,pts,"Function","pdf","Kernel","epanechnikov");
figure; surf(x1, x2, reshape(f,size(x1,1),size(x1,2)));
set(gca, 'YDir', 'reverse')
colormap("turbo")
axis tight
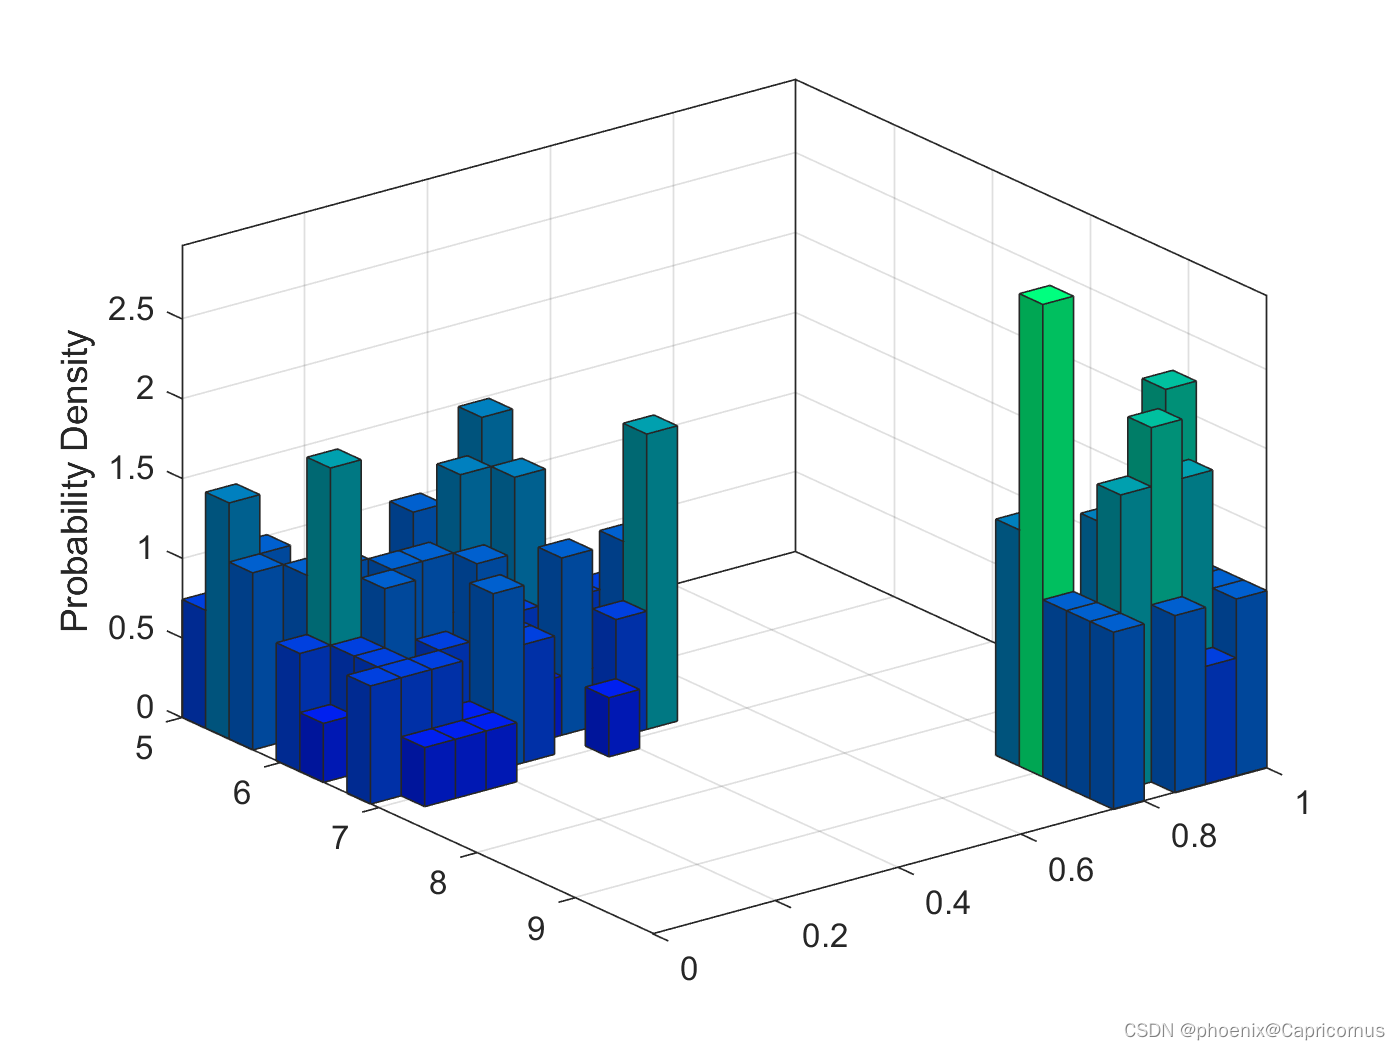
nbins = 20;

figure;
h = histogram2(x(:,1), x(:,2), nbins, 'Normalization', 'pdf', 'FaceColor', 'flat');
set(gca, 'YDir', 'reverse')

colormap("winter")
axis tight
zlabel('Probability Density')


 1310
1310

 被折叠的 条评论
为什么被折叠?
被折叠的 条评论
为什么被折叠?
 到【灌水乐园】发言


