


介绍 (Introduction)
The advent of the Internet has brought with it improved communication, opportunities for business, advancements in science and technology. It has also created new opportunities for crime, new methods of committing them and a larger pool of potential victims. One such crime is cyber abuse, an umbrella term used for stalking and harassment committed with the use of technology.
互联网的出现带来了更好的交流,商机,科学技术的进步。 它还创造了犯罪的新机会,新的犯罪手段和更多的潜在受害者。 网络滥用是一种这样的犯罪,网络滥用是一个因使用技术而造成的跟踪和骚扰的总称。
While some researchers argue that cyber abuse is simply an extension of old traditional forms of interpersonal violence (e.g. stalking and harassment), it is clear that technology affects the way the crime is perpetrated, experienced and, subsequently, can be prevented.
尽管一些研究人员认为,网络滥用只是旧的传统形式的人际暴力(例如跟踪和骚扰)的延伸,但很明显,技术会影响犯罪的发生,经历和随后的预防方式。
Research in mechanisms of stalking and harassment is quite extensive with a number of criminological theories used to explain its causes. However, the causal mechanism of new technological forms of abuse is not yet fully understood. It is also unclear whether the traditional theories that were developed with “terrestrial” forms of crime in mind are useful in explaining these new forms of crime.
关于缠扰和骚扰机制的研究非常广泛,其中使用了许多犯罪学理论来解释其原因。 但是,对新技术滥用形式的因果机制尚未完全了解。 还不清楚的是,考虑到“地面”犯罪形式而发展起来的传统理论在解释这些新的犯罪形式方面是否有用。
In this paper, we focus on lifestyles-routine activities theory, which explains why some people are more likely to experience crime than others (Cohen et al., 1981). From this perspective, crime is seen as a product of motivated offenders converging in time and in space with suitable targets in the absence of capable guardians (Cohen and Felson, 1979).
在本文中,我们将重点放在生活方式-日常活动理论上,该理论解释了为什么某些人比其他人更容易犯罪(Cohen等,1981)。 从这个角度来看,犯罪被看作是有动机的犯罪者在缺乏有能力的监护人的情况下在时间和空间上与合适的目标融合的产物(Cohen and Felson,1979)。
The theory argues that our lifestyles and routine activities are important predictors of the risk of criminal victimisation as they determine the likelihood of coming into contact with offenders. Those who engage in lifestyles and routine activities that are more likely to result in contact with potential offenders are more likely to become victims.
该理论认为,我们的生活方式和例行活动是犯罪受害风险的重要预测因子,因为它们决定了与罪犯接触的可能性。 那些从事生活方式和日常活动的人更有可能与潜在的犯罪者接触,这些人更有可能成为受害者。
According to this theory, the risk of criminal victimisation is encapsulated and can be accessed by measuring the level of individual’s a) exposure to risk, b) proximity to potential offenders, c) target attractiveness (in a form of economic or symbolic value and being perceived as vulnerable), and, finally, presence or absence of potential guardians in the individual’s immediate environment (e.g. passive bystanders or active interveners).
根据该理论,可以将犯罪受害的风险封装起来,并可以通过以下方式来衡量:a)承受风险的程度,b)与潜在犯罪者的接近程度,c)目标吸引力(以经济或象征价值的形式存在)被认为是脆弱的),最后是在个人的直接环境中是否存在潜在的监护人(例如,被动的旁观者或主动的干预者)。
Our objective in this paper is to examine the nature of the relationship between the risky lifestyles and routine activities and cyber abuse victimisation.
本文的目的是检验危险生活方式与日常活动和网络滥用受害者之间关系的性质。
数据与方法 (Data and Methods)
Aiming to improve our understanding of the mechanisms of cyber abuse victimisation, we surveyed adult members of Amazon’s Mechanical Turk using an online survey (N = 1, 463) and then analysed the data using logistic regression with Bayesian variable selection using stochastic search algorithm implemented in AutoStat®.
为了增进我们对网络滥用受害机制的理解,我们使用在线调查(N = 1,463)对亚马逊机械特克的成年成员进行了调查,然后使用Logistic回归和贝叶斯变量选择对数据进行了分析,贝叶斯变量使用AutoStat® 。
To estimate the effect of the type of activities on the likelihood of becoming a victim of cyber abuse, we measured the level of our respondents’ involvement in potentially risky routine daily online activities as well as the strength of their interpersonal relationships with various groups of social contacts (e.g. family, friends, online gaming contacts, etc.). Here, we measured activities that have been shown in previous research to affect one’s exposure to risk, proximity to offenders, target attractiveness and absence or presence of capable guardianship and therefore to be associated with increased risk of personal victimisation Vakhitova et al. (2019).
为了评估活动类型对成为网络滥用受害者的影响,我们测量了受访者参与日常日常风险活动的水平以及他们与不同社交群体之间人际关系的强度联系人(例如家人,朋友,在线游戏联系人等)。 在这里,我们测量了先前研究中显示的活动,这些活动会影响一个人面临的风险,与罪犯的接近程度,目标吸引力以及缺乏或缺乏有能力的监护权,因此会增加人身受害的风险。Vakhitova等。 (2019)。
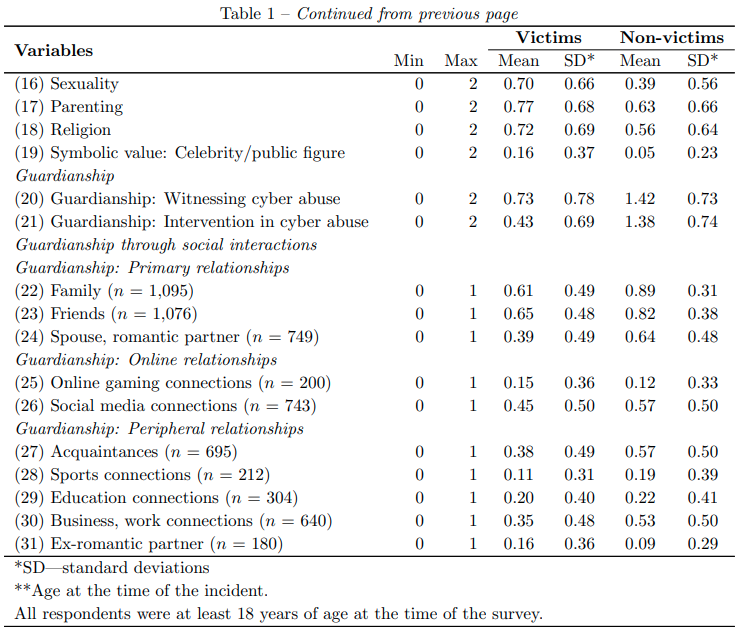
Table 1 presents summary statistics for our sample analysed here.
表1列出了此处分析的样本的摘要统计信息。

可视化数据 (Visualising the data)
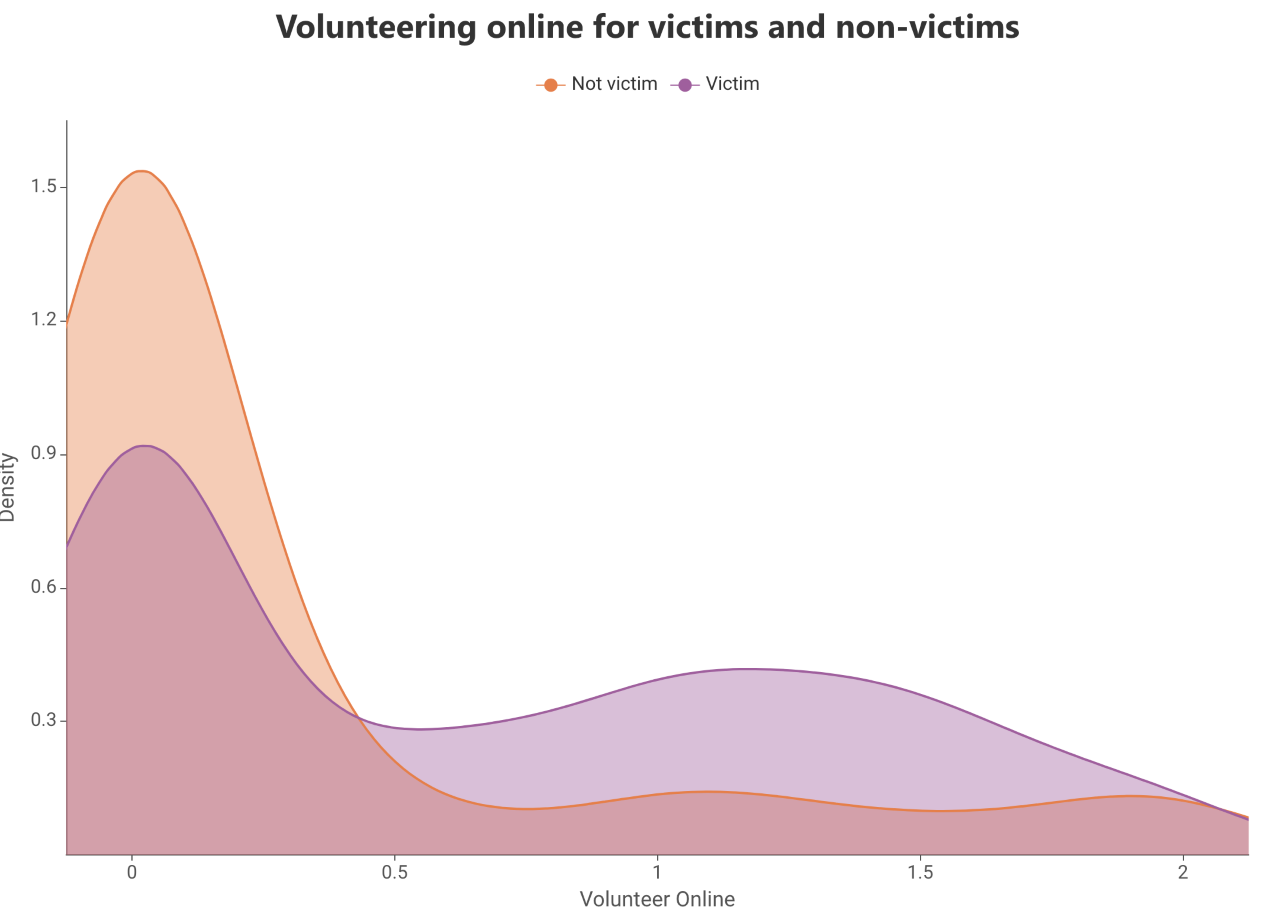
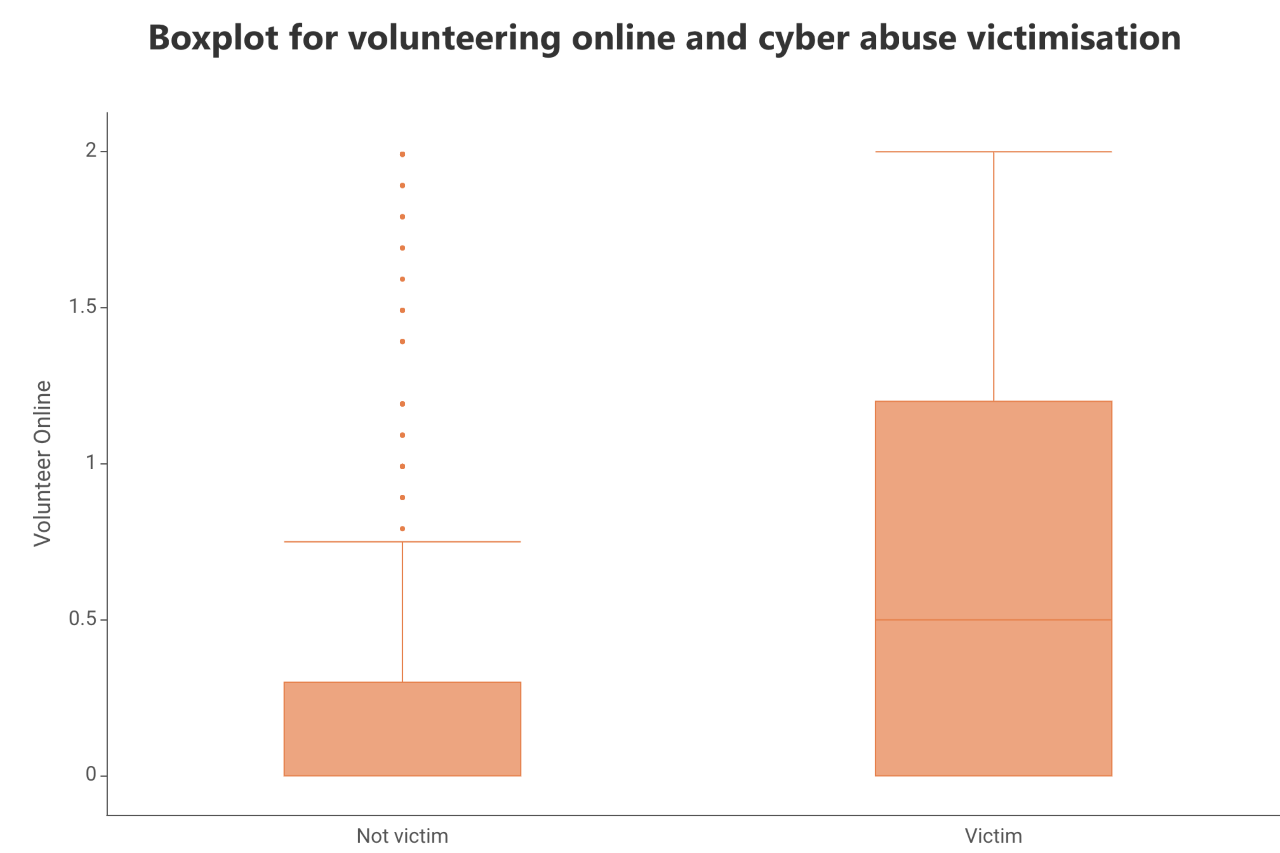
Summary statistics presented in Table 1 appear to suggest some difference in the level of involvement in risky activities between our two sub-groups of interest–victims and non-victims. To help visualise this trend, we compared victims and non-victims in terms of their online lifestyles and routine activities using the box plot and density plots. Figure 1 presents a density and box plots for the relationship between volunteering online (for example, as an online forum moderator) and experiencing cyber abuse victimisation. The figures suggest that victims (orange distribution) tend to volunteer online much more often compared with non-victims (blue distribution). In fact, only a few non-victims reported being actively involved in volunteering online.
表1中列出的汇总统计数据似乎表明,我们的两个受害子群体–受害人和非受害人之间对风险活动的参与程度有所不同。 为了使这种趋势形象化,我们使用箱形图和密度图比较了受害人和非受害人的在线生活方式和例行活动。 图1给出了在线自愿(例如,作为在线论坛主持人)与遭受网络滥用伤害之间的关系的密度和箱形图。 这些数字表明,与非受害者(蓝色分布)相比,受害者(橙色分布)倾向于更频繁地在线自愿。 实际上,只有少数非受害者报告称积极参与在线志愿服务。
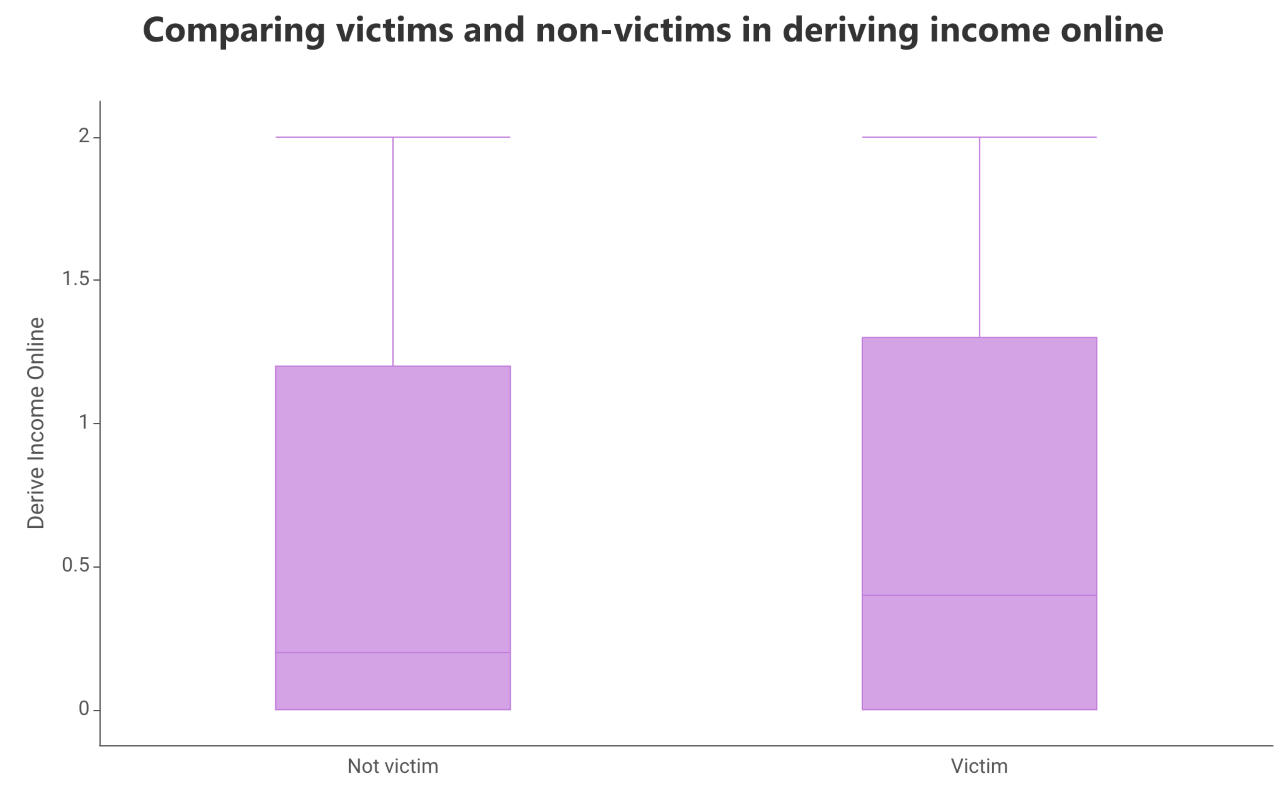
However, this trend is not uniform and, for example, the comparison of earning online income between victims and non-victims suggests that both victims and non-victims are similarly likely to earn income online, suggesting that earning income online may not be an important predictor of cyber abuse victimisation (see Figure 2).
但是,这种趋势并不统一,例如,受害人和非受害人之间在线收入的比较表明,受害人和非受害人都同样有可能在线获得收入,这表明在线收入可能并不重要。网络滥用受害的预测因素(见图2)。

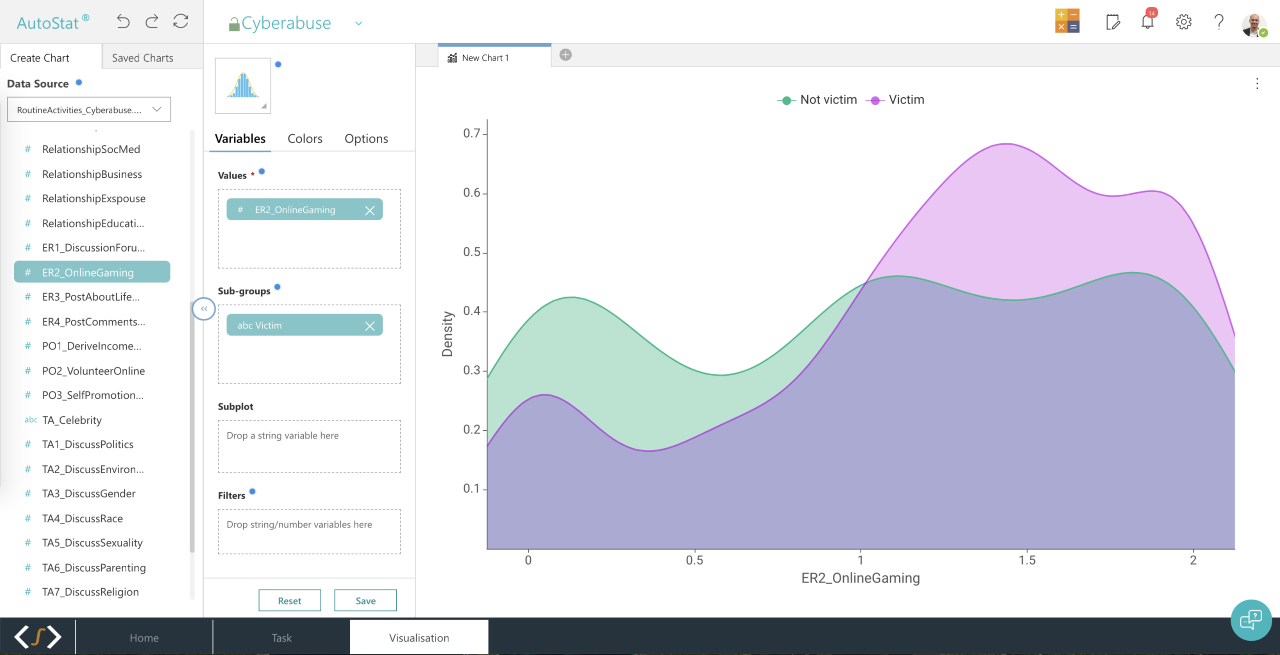
To generate distribution plots in AutoStat®, select the tab Visualisation, select the type of plot you wish to generate and move the variables you wish to plot into the appropriate boxes (move your categorical variable into the Sub-groups box and your continuous variable into the Values box) (see Figure 3).
要在AutoStat®中生成分布图,请选择“ 可视化 ”选项卡,选择要生成的图的类型,然后将要绘制的变量移动到适当的框中(将类别变量移动到“ 子组”框中,将连续变量移动到( 值框)(请参见图3)。
为什么在AutoStat®中选择贝叶斯变量? (Why Bayesian variable selection in AutoStat®?)
As shown earlier, summary statistics and visualisations of bi-variate relationships suggest that victims are more likely to engage in risky online activities and, at the same time, less likely to actively socialise with most kinds of interpersonal relationships (with the exception of relationships with ex-romantic partners and online gaming connections).
如前所述,汇总统计数据和双变量关系的可视化显示,受害人更有可能从事危险的在线活动,与此同时,也不太可能与大多数人际关系进行积极的社交活动(前浪漫的合作伙伴和在线游戏连接)。
To estimate the combined effect of lifestyles and routine activities-related variables and the socio-demographic controls we will now model cyber abuse victimisation using logistic regression with Bayesian variable selection implemented in AutoStat®.
为了估计生活方式和与日常活动有关的变量以及社会人口统计学控制的综合影响,我们现在将使用Logistic回归和在AutoStat®中实施的贝叶斯变量选择对网络滥用受害者进行建模。
In deciding on the modelling approach, we took into consideration the exploratory nature of the study; the explicit lack of theoretical guidance on selection of variables to be included in our models; and the benefits of statistical methods of variable selection in the context of social science research identified in previous research (Vakhitova and Alston-Knox, 2018; Vakhitova et al., 2019). Employing Bayesian variable selection when modelling processes in the absence of clear theoretical guidance on model specification allows not only accounting for parameter uncertainty, but also for model uncertainty, as well as addressing the issue of over-fitting.
在确定建模方法时,我们考虑了研究的探索性质。 在选择要包含在我们模型中的变量方面明显缺乏理论指导; 以及在先前研究中确定的社会科学研究背景下变量选择的统计方法的优势(Vakhitova和Alston-Knox,2018; Vakhitova等,2019)。 在没有清晰的模型规范理论指导的情况下进行建模过程时,采用贝叶斯变量选择不仅可以解决参数不确定性问题,还可以解决模型不确定性问题,并且可以解决过度拟合问题。
We have used AutoStat® for this analysis because it provides a simple, user-friendly interface and a straightforward way of conducting a similar analysis. There are also a number of statistical packages for performing Bayesian variable selection in the R programming environment, for example, Raftery (1995) and Raftery et al. (2016) or Clyde et al. (2016). While each of these algorithms is slightly different, the intent of them is unified and the inferences from the model are similarly interpreted.
我们使用AutoStat®进行此分析是因为它提供了简单,用户友好的界面以及进行类似分析的直接方法。 在R编程环境中,还有许多用于执行贝叶斯变量选择的统计软件包,例如Raftery(1995)和Raftery等。 (2016)或Clyde等人。 (2016)。 尽管每种算法都稍有不同,但它们的目的是统一的,并且对模型的推论也进行了类似的解释。
In this analysis, a stochastic search algorithm is used to determine the most probable models in terms of their explanatory power. AutoStat® allows estimating the most probable models using a number of different priors. In this study, we employed G-prior spike-slab to enable the variable selection.
在此分析中,根据其解释力,使用随机搜索算法来确定最可能的模型。 AutoStat®允许使用许多不同的先验来估计最可能的模型。 在这项研究中,我们使用G优先尖峰平板来启用变量选择。
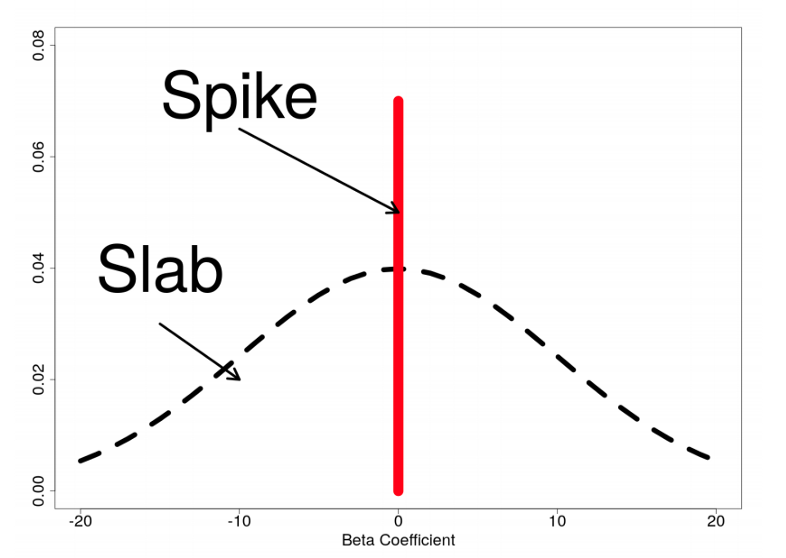
As a schematic diagram of the G-prior spike slab shows, the prior takes two states (see Figure 4). During MCMC iterations where the coefficient is included in the model (as indicated by the stochastic search algorithm), the prior used in this posterior sample draw will be a G-prior, indicated as the “slab”. Similarly, for iterations when the stochastic search does not include a coefficient, the prior used in the posterior draw is a point mass at zero (0), indicated by the “spike”, resulting in a posterior draw of the coefficient that is exactly zero (0):
如图G优先尖峰板的示意图所示,先验具有两种状态(请参见图4)。 在模型中包含系数的MCMC迭代过程中(如随机搜索算法所示),此后样本抽取中使用的先验将是G优先级,表示为“平板”。 类似地,对于随机搜索不包含系数的迭代,后验中使用的先验是零质量(0)的点质量,由“尖峰”表示,导致后验系数正好为零(0):
The g-prior (slab) for our β parameters is given by:
β参数的g优先级(平板)由下式给出:

As g increases, the prior becomes more concentrated around zero (0) and takes on a more active role in the posterior distribution specification. In this example, we set g to be equal to the sample size (the default value in AutoStat®).
随着g的增加,先验会变得更加集中在零(0)附近,并在后验分布规范中发挥更加积极的作用。 在此示例中,我们将g设置为等于样本大小(AutoStat®中的默认值)。
For more information about the stochastic search algorithm for variable selection, and this specification of the g-prior, please see Marin and Robert (2014).
有关用于变量选择的随机搜索算法以及此g先验规范的更多信息,请参见Marin and Robert(2014)。
AutoStat®模型构建器:操作指南 (AutoStat® Model builder: How-to guide)
The following is a how-to guide for using AutoStat®’s Model Builder feature to perform a Bayesian variable selection analysis using stochastic search algorithm.
以下是使用AutoStat®的模型构建器功能通过随机搜索算法执行贝叶斯变量选择分析的方法指南。
To conduct logistic regression with Bayesian variable selection in AutoStat®, select the tab Model Builder. Select the dataset you are analysing and move it to Training Data box. Then select your dependent variable and move it to Forecast Variable(s) box and then move your predictors Explanatory Variable(s) box. Please note, if you have any missing values, you will be given a choice of removing them from the analysis.
要使用AutoStat®中的贝叶斯变量选择进行逻辑回归,请选择选项卡Model Builder 。 选择要分析的数据集,然后将其移到“训练数据”框中。 然后选择您的因变量并将其移至“预测变量”框,然后将预测变量“解释性变量”框移动。 请注意,如果您缺少任何值,则可以选择将其从分析中删除。
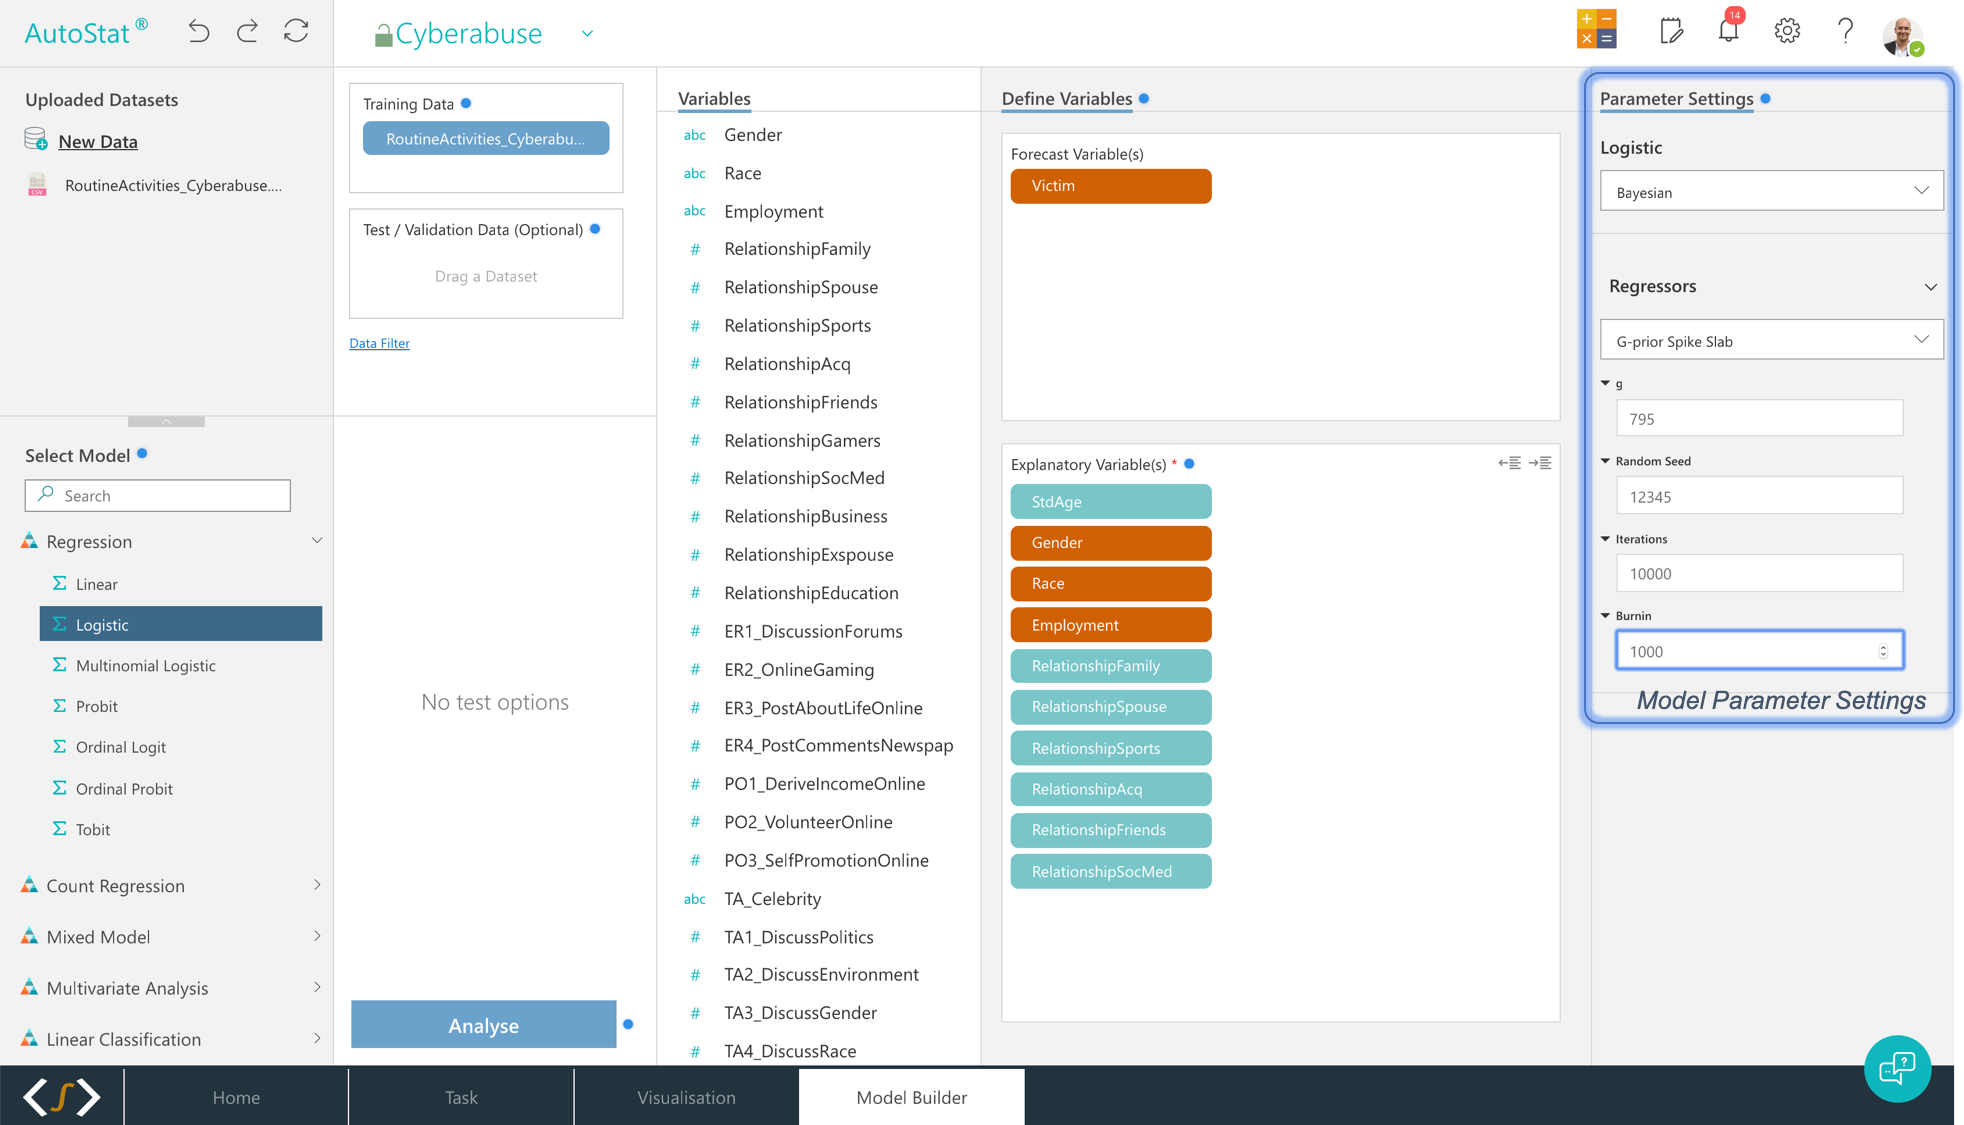
The next step is to specify your modelling parameters in Parameter(s) Settings part of the screen. You can specify the prior, g (in our case, equal to sample size after all missing data is removed), random seed, number of iterations and burnin (see Figure 5).
下一步是在屏幕的“参数设置”部分中指定建模参数。 您可以指定先验g(在我们的情况下,等于删除所有缺失数据后的样本大小),随机种子,迭代次数和老化(请参见图5)。
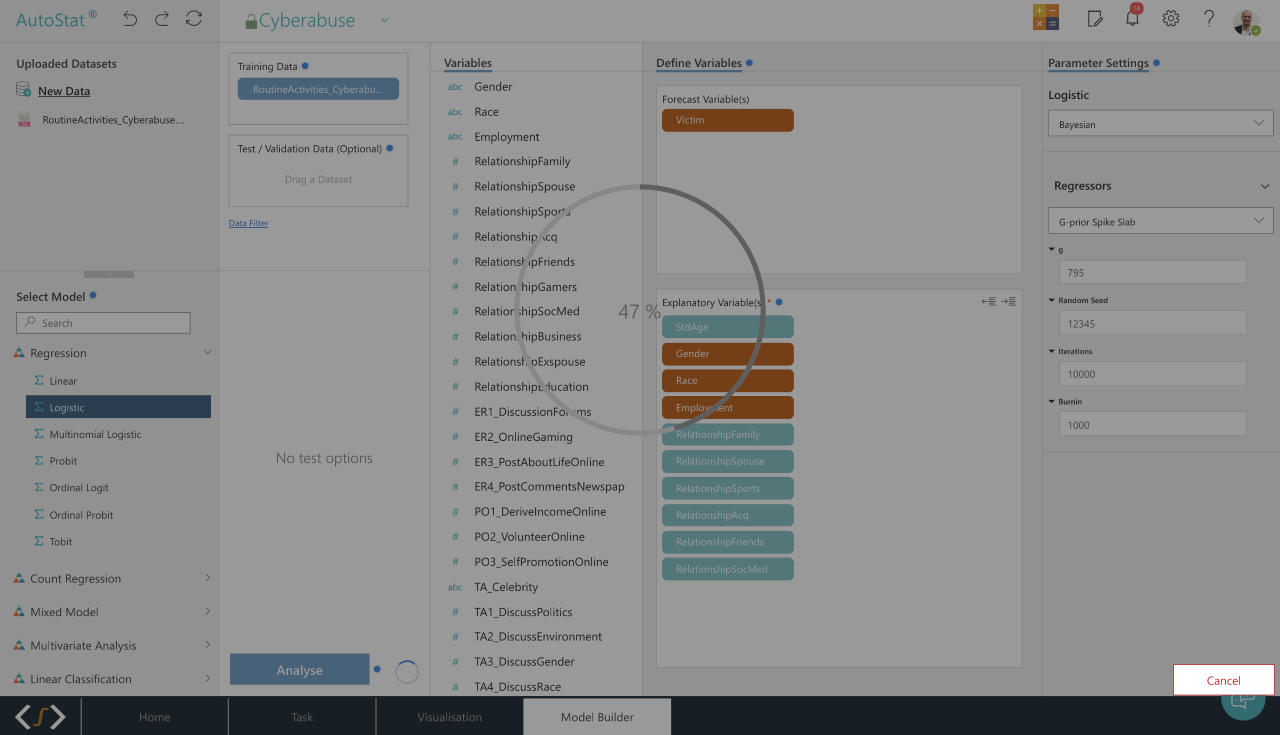
After the parameters are specified, click Analyse button and watch the magic of stochastic search happen in front of your eyes (Figure 6)!
指定参数后,单击“分析”按钮,并观看随机搜索的神奇动作在您眼前(图6)!
As part of Bayesian variable selection analysis, AutoStat® generates a number of different outputs, including a summary of five top best explanatory models together with probabilities of inclusion for all coefficients of interest (Figure 7), a summary of means, standard deviations and HPD intervals for all coefficients of interest (Figure 8), a detailed variable importance graph (Figure 9) and a number of diagnostic plots (see, for example, Figures 10 and 11).
作为贝叶斯变量选择分析的一部分,AutoStat®生成许多不同的输出,包括五个最佳解释模型的摘要以及所有感兴趣系数的包含概率(图7),均值,标准差和HPD的摘要所有感兴趣系数的区间(图8),详细的变量重要性图(图9)和许多诊断图(例如,参见图10和11)。


结果 (Results)
Table 2 summarises the results of our analyses. It shows that the best model using our data (Model 1) with a posterior probability of 0.23 per cent includes ten predictors. The next best model (Model 2) has a posterior probability of 0.21 per cent with nine predictors. Please note that the posterior probability of the model does not tell us about the predictive capability of the model. Instead, it gives us a number relative to all the other possible models. Hence, In the case of our specific example study, having many potential regressors means a large number of potential explanatory models, which in turn means small relative posterior probabilities of models.
表2总结了我们的分析结果。 它表明,使用我们的数据(模型1)的后验概率为0.23%的最佳模型包括十个预测变量。 次佳模型(模型2)的后验概率为0.21%,有9个预测变量。 请注意,模型的后验概率不能告诉我们模型的预测能力。 相反,它给了我们相对于所有其他可能模型的数字。 因此,在我们的特定示例研究中,拥有许多潜在的回归变量意味着大量的潜在解释模型,这反过来又意味着模型的相对后验概率较小。
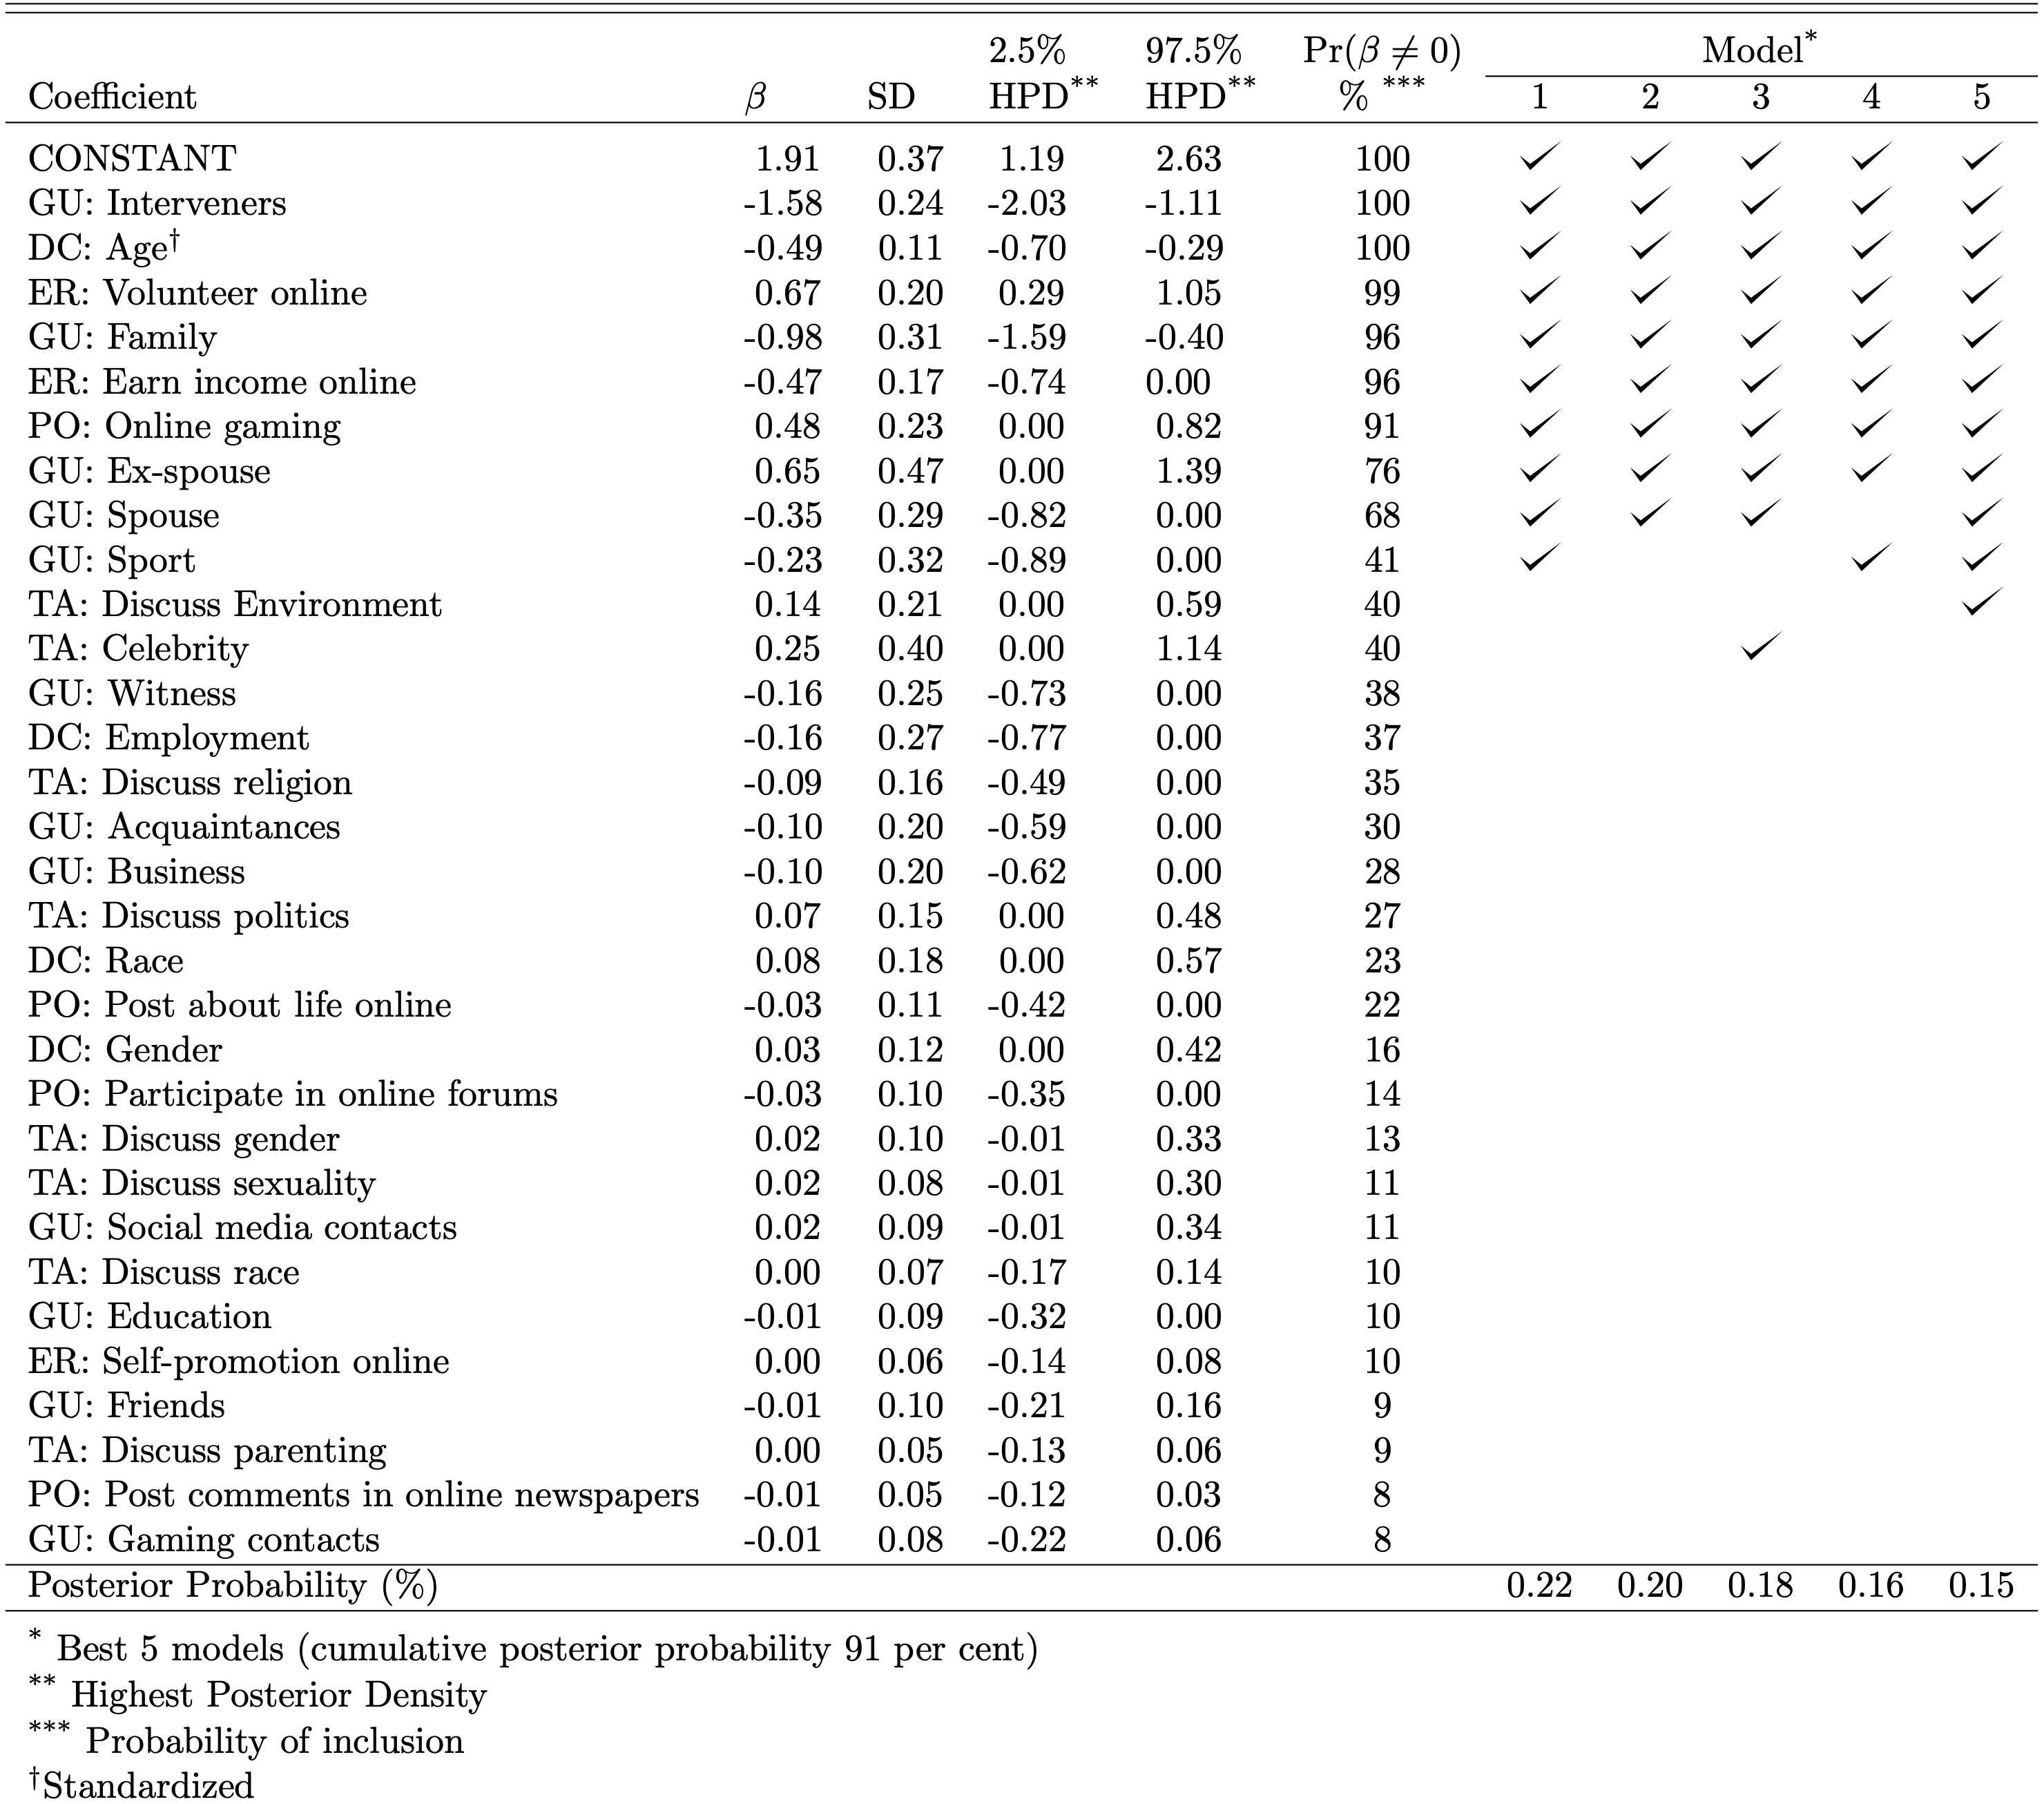
Most variables included in the best model (Model 1) are also included in all five top best models with inclusion probabilities of over 50 per cent. The two exceptions are socialising with ex-romantic partners, included in 4 out of 5 best models, and socialising with sports contacts, included in 3 out of 5 best models with the inclusion probability or around 40 per cent.
最佳模型(模型1)中包含的大多数变量也包含在所有五个最佳模型中,包含率超过50%。 这两个例外情况是:与前浪漫伴侣进行社交活动(包括在5个最佳模型中的4个中)和与体育接触者进行社交,包括在5个最佳模型中的3个中,其包含概率为40%。
Table 2 suggests that using our data and controlling for socio-demographic characteristics, lifestyles and routine activities appear to be useful predictors of cyber abuse victimisation, with some being more useful than others. The best explanatory model (Model 1) suggests that the most important factors accounting for the risk of cyber abuse victimisation include risk factors in the form of engagement in volunteering online and socialising with ex-romantic partners and protective factors in the form of presence/absence of someone who could actively intervene in an incident of cyber abuse, earning income online, and socialising with family, spouses and sporting/social contacts.
表2表明,使用我们的数据并控制社会人口统计学特征,生活方式和例行活动似乎是网络滥用受害的有用预测指标,其中一些指标比其他指标更有用。 最佳解释模型(模型1)表明,造成网络滥用受害风险的最重要因素包括参与在线志愿服务和与浪漫伴侣进行社交形式的风险因素以及存在/不存在形式的保护因素。可以积极干预网络滥用事件,在线赚钱并与家人,配偶和体育/社会往来进行社交的人。
Using the information in Table 2 we estimate that those with intervening guardians in their lives are only 17 per cent likely to experience victimisation compared with 83 per cent for those who do not have intervening guardians in their immediate environment; socialising with family, spouses and sporting/social committee contacts also appear to be associated with the reduced likelihood of experiencing cyber abuse (27 per cent, 41 per cent and 44 per cent respectively).
根据表2中的信息,我们估计生活中有监护人的人受害的可能性仅为17%,而在其周围环境中没有监护人的人则为83%。 与家人,配偶和体育/社会委员会的往来社交也似乎与网络滥用的可能性降低有关(分别为27%,41%和44%)。
However, engaging in online gaming, volunteering online and socialising with ex-romantic partners is associated with increased risk of cyber abuse victimisation (61 per cent, 66 per cent and 65 per cent respectively). The finding that earning income online appears to protect individuals from cyber abuse (probability of experiencing cyber abuse of only 38 per cent) is puzzling. It appears those who earn income online behave in a way that is different from those who use the Internet for entertainment and communication purposes only that protects them from victimisation.
但是,参与在线游戏,在线志愿服务以及与前浪漫伴侣进行社交活动会增加遭受网络虐待的风险(分别为61%,66%和65%)。 网上赚钱似乎可以保护个人免遭网络滥用的发现(遭受网络滥用的可能性仅为38%)令人困惑。 看来,那些在网上赚钱的人的行为方式与那些将互联网用于娱乐和交流目的的行为方式不同,只是为了保护他们免受伤害。
Notably, out of social-demographic characteristics, only age is a useful predictor of victimisation (younger people are more likely to experience victimisation), while race, employment and gender are not.
值得注意的是,出于社会人口特征,只有年龄才是受害的有用预测指标(年轻人更容易遭受受害),而种族,就业和性别则没有。
讨论与结论 (Discussion and conclusion)
Our findings suggest that lifestyles and routine activities of victims could provide a useful insight into the mechanisms of cyber abuse victimisation. Having said that, some lifestyles and routine activities appear to have more influence than others. For example, we found that such activities as volunteering online, earning online income, and socialising ex-romantic partners and sporting/social contacts increase the risk of cyber abuse victimisation while having someone in one’s immediate environment who could actively intervene in an incident of cyber abuse and socialising with family and sporting/social contacts actually decreases one’s risk of becoming a victim of cyber abuse.
我们的研究结果表明,受害者的生活方式和例行活动可以为了解网络滥用受害者的机制提供有用的见解。 话虽如此,某些生活方式和日常活动似乎比其他生活方式具有更大的影响力。 例如,我们发现在线志愿服务,在线收入,浪漫伴侣和体育/社会交往等活动增加了网络滥用受害的风险,同时使某人处于自己的直接环境中并可以积极干预网络事件虐待以及与家庭和体育/社会往来的社交实际上减少了成为网络虐待受害者的风险。
Our best models included at least one variable encapsulating the risk from all four aspects of risk according to lifestyles-routine activity theory: exposure to risk, proximity to offenders, target attractiveness and particularly capable guardianship.
我们最好的模型包括至少一个变量,该变量根据生活方式-日常活动理论从风险的所有四个方面概括风险:暴露于风险,与犯罪者的亲近程度,目标吸引力和特别有能力的监护权。
The evidence supporting guardianship as a protective factor is particularly intriguing. Our best model includes four variables measuring guardianship–one measuring online guardianship (having someone to intervene) and three measuring offline guardianship (actively socialising with family, spouses and sporting/social committees contacts). It appears that guardianship like cyberspace itself has no borders; its effect traverses from terrestrial world to cyberspace and back.
支持监护作为保护因素的证据尤其令人感兴趣。 我们最好的模型包括四个衡量监护权的变量-一个衡量在线监护权(需要某人干预)和三个衡量离线监护权(积极与家人,配偶和体育/社会委员会联系进行社交)。 似乎像网络空间本身那样的监护无国界。 它的影响从地面世界遍历到网络空间,然后再返回。
It also appears that having an active social network consisting of mainly primary contacts (e.g. family, spouses, etc). can serve as a protective factor against criminal victimisation. Further research is needed to better understand this protective mechanism.
看来,拥有一个主要由主要联系人(例如家庭,配偶等)组成的活跃的社交网络。 可以作为防止犯罪受害的保护因素。 需要进一步研究以更好地了解这种保护机制。
Another interesting finding from this study is that having someone who could actively intervene on your behalf in an incident of cyber abuse is the best possible explanation of cyber abuse victimisation (with the inclusion probability of 100 per cent), however, having someone to witness (passively) you being cyber abused is not a good predictor of abuse with the inclusion probability of less than 40 per cent. This finding highlights the value of guardianship in action in preventing crime (Reynald, 2010).
这项研究的另一个有趣发现是,有人可以代表您积极干预网络滥用事件,这是对网络滥用行为造成伤害的最佳解释(包含率为100%),但是,有人可以见证(被动地)您被网络滥用不是一个很好的预测滥用的指标,其被包含的可能性小于40%。 这一发现突显了监护在预防犯罪中的价值(Reynald,2010)。
传 (Biography)
Dr Zarina Vakhitova is a Monash University (Melbourne, Australia) Lecturer with the School of Social Sciences specialising in criminology and criminal justice. Her research interests focus on the application of the environmental criminology principles to understanding and controlling crime that occurs in cyberspace. Zarina’s list of publications is available in Google Scholar here.
Zarina Vakhitova博士 是莫纳什大学(澳大利亚墨尔本)社会科学学院的讲师,专门研究犯罪学和刑事司法。 她的研究兴趣集中在应用环境犯罪学原理来理解和控制网络空间中发生的犯罪。 Zarina的出版物列表可在此处的Google Scholar中找到。
翻译自: https://towardsdatascience.com/lifestyles-activities-and-cyber-abuse-is-there-a-link-d757c835bb7a


 207
207

 被折叠的 条评论
为什么被折叠?
被折叠的 条评论
为什么被折叠?
 到【灌水乐园】发言


