


大数据数据科学家常用面试题
What is a data science interview? How to tackle it well?
什么是数据科学面试? 如何解决呢?
I believe that they can be a lot of data science enthusiasts’ concerns.
我相信他们可能是许多数据科学爱好者的关注点。
I would like to share my experience in the NTU LevelUp programme organised by the NTU Career & Attachment Office.This programme pairs up students with mentors from various industries, aiming to give undergraduates like me a flavour of what is the life like to be working in the industry of our interest, providing us an outlook on the future work life and preparing us to acquire the relevant and essential skill sets for the industry.
我想分享我在NTU职业与实习办公室组织的NTU LevelUp计划中的经验,该计划将学生与来自各个行业的导师结对,旨在给像我这样的大学生一种在工作中的生活情趣我们感兴趣的行业,为我们提供了对未来工作生活的展望,并为我们准备了与行业相关的基本技能。
I am very grateful to be under the mentorship of @Haiyang Sun who is our alumni and is now working as a data scientist, as I am quite interested in the data science field and would like to discover more and also want to know the roadmap to become a data scientist. Together with @Voon hao, another mentee under the same mentor, we have gone through a series of sessions with our mentor, including data science assignment, product and technical interview preparations.
我非常感谢@ Haiyang Sun的指导,他是我们的校友,现在是一名数据科学家,因为我对数据科学领域非常感兴趣,并且想发现更多,并且也想知道成为数据科学家。 我们与@Voon hao (同一位指导者的另一位指导者)一起,与指导者进行了一系列会议,包括数据科学作业,产品和技术面试准备。
In this article, I would like to share about our learning in the data science take home assignment. I will share some code written by us to give you some idea of how we tackle the problem.
在本文中,我想分享一下我们在数据科学带回家中的学习。 我将分享一些我们编写的代码,以使您了解如何解决该问题。
There are two tasks in the assignment.
分配中有两个任务。
任务1:转化率预测 (Task 1: Conversion Rate Prediction)
The goal of this challenge is to build a model that predicts conversion rate and, based on the model, come up with ideas to improve revenue.
这项挑战的目标是建立一个可预测转化率的模型,并在此模型的基础上提出提高收入的想法。
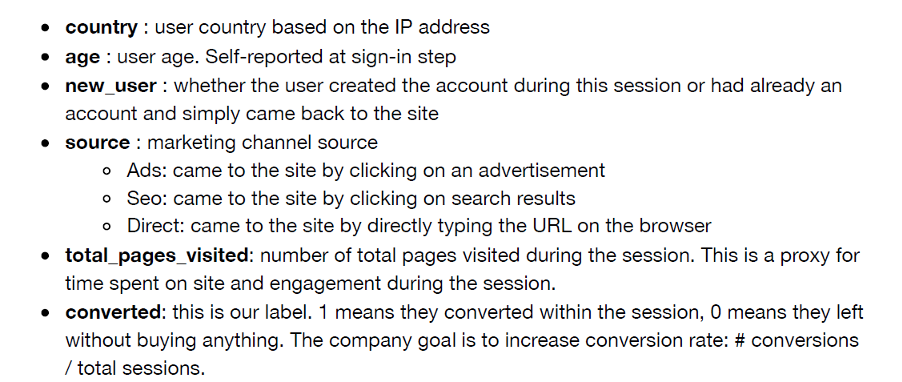
Dataset
数据集
Approach
方法
In order to build a prediction model, we need to explore the raw data first and then clean them and feed them to the model. The pipeline is as followed:
为了建立预测模型,我们需要先探索原始数据,然后清理它们并将其提供给模型。 管道如下:
- Exploratory Data Analysis 探索性数据分析
- Model Selection 选型
- Model Building 建筑模型
- Model evaluation 模型评估
Exploratory Data Analysis
探索性数据分析
Correlation
相关性
### correlation analysis
corr=conversion_data.corr()
sns.heatmap(corr)
Conversion rate analysis by features
功能转换率分析
Country
国家
### conversion analysis based on country
country_ana=conversion_data.groupby([‘country’,’converted’])[‘country’].count().unstack()
country_ana.columns=[‘0’,’1']
country_ana[‘%’] = country_ana[‘1’]/country_ana.sum(axis=1)*100
ax = country_ana[‘%’].plot.bar()
ax.set_title(‘Conversion Rate by country’)
ax.set_ylabel(‘Conversion Rate (%)’)
We can see that the conversion rate for China market is not high, which means more efforts shall be spent on other region liker Germany and UK.
我们可以看到,中国市场的转换率不高,这意味着需要在德国和英国等其他地区投入更多的精力。
Age
年龄
ax =sns.distplot(converted[‘age’],hist=False,color=’blue’,kde_kws={‘shade’:True},norm_hist=True,label=’converted’)
ax = sns.distplot(not_converted[‘age’],hist=False,color=’red’,kde_kws={‘shade’:True},norm_hist=True,label=’not converted’)
ax.set_title(‘age distribution ‘)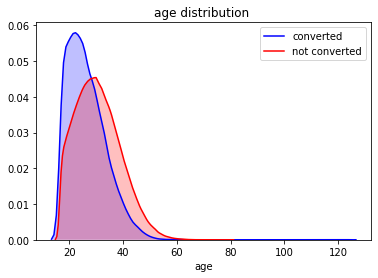
From the graph, the age distribution for converted cases are relatively younger.
从图中可以看出,转换病例的年龄分布相对年轻。
ax = sns.scatterplot(x=age_ana.index,y=age_ana.converted)
ax.set_ylabel(‘# of Conversion’)
ax.set_title(‘Conversion cases by age’)
Not hard to find out that there are actually some outliers above age 100, it is highly unlikely to have that data in the real life. Therefore, there is a need to remove them for more accurate analysis.
不难发现实际上存在一些100岁以上的异常值,在现实生活中极不可能获得这些数据。 因此,需要删除它们以进行更准确的分析。
### remove the anormality
age_ana_cleaned = age_ana.loc[age_ana.index<100]
age_ana_cleaned.reset_index(inplace=True)## plot scatter graph to bin the age
bins =[15,19,25,29,35,39,45,49,55,59,65]
names = [‘15–19’,’20–25',’26–29',’30–35',’36–39',’40–45',’46–49',’50–55',’56–59',’60–61']
age_ana_cleaned[‘age_bin’]=pd.cut(age_ana_cleaned[‘age’],bins,labels=names).astype(object)
age_ana_cleaned_bin = age_ana_cleaned.groupby([‘age_bin’])[‘converted’].sum()
I cut the ages into bin for easier visualisation.
我将年龄段划分为bin,以便于可视化。
Source
资源
source_ana=conversion_data.groupby([‘source’])[‘converted’].mean()
source_ana.plot.bar(title=’Percentage of conversion by source’)
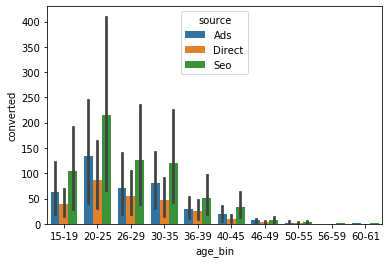
Generally, the conversion rate does not vary drastically among the source. It is clear that Direct source has the lowest conversion rate, while Ads source the highest.Then what are the relationship between the age group and the source among the converted cases.
通常,转换率在各个来源之间不会有太大变化。 很明显,直接来源的转化率最低,而广告来源的转化率最高,那么在转化案例中年龄组与来源之间的关系是什么。
total_pages_visited
total_pages_visited
sns.distplot(converted[‘total_pages_visited’],hist=False,kde_kws={‘shade’:True},norm_hist=True,label=’converted’)
sns.distplot(not_converted[‘total_pages_visited’],hist=False,kde_kws={‘shade’:True},norm_hist=True,label=’not converted’)
Among the converted cases, the total_pages_visited shows a normal distribution with mean about 15.
在已转换的案例中,total_pages_visited显示正态分布,均值约为15。
Prepare data for model training
准备用于模型训练的数据
One-hot the categorical features and select the features for model training.
一键式分类特征,然后选择用于模型训练的特征。
catdata=pd.get_dummies(cleaned_conv[[‘age_bin’,’country’,’source’]])
alldata = catdata.join(cleaned_conv[[‘new_user’,’total_pages_visited’,’converted’]])
x = alldata.drop(columns=’converted’)
y = alldata[‘converted’]
Model Selection
选型
I have selected a several models for the training, select the best one for further improvement.
我选择了几种训练模型,选择最佳模型进行进一步改进。
# for ML:
from sklearn.model_selection import train_test_split, KFold, cross_validate, cross_val_score
from sklearn.pipeline import Pipeline
from sklearn.ensemble import RandomForestClassifier
from sklearn.linear_model import LogisticRegression
from sklearn.tree import DecisionTreeClassifier
from sklearn.metrics import accuracy_score
from sklearn.metrics import f1_score## model selection
base_models = [(“DT_model”, DecisionTreeClassifier(random_state=42)),
 (“RF_model”, RandomForestClassifier(random_state=42,n_jobs=-1)),
 (“LR_model”, LogisticRegression(random_state=42,n_jobs=-1))]kfolds = 4 # 4 = 75% train, 25% validation
split = KFold(n_splits=kfolds, shuffle=True, random_state=42)for name, model in base_models:# get cross validation score for each model:
 cv_results = cross_val_score(model,
 x, y,
 cv=split,
 scoring=”accuracy”,
 n_jobs=-1)
 # output:
 min_score = round(min(cv_results), 4)
 max_score = round(max(cv_results), 4)
 mean_score = round(np.mean(cv_results), 4)
 std_dev = round(np.std(cv_results), 4)
 print(f”{name} cross validation accuarcy score: {mean_score} +/- {std_dev} (std) min: {min_score}, max: {max_score}”)
Output:
输出:
DT_model cross validation accuarcy score: 0.9853 +/- 0.0003 (std) min: 0.985, max: 0.9857RF_model cross validation accuarcy score: 0.9854 +/- 0.0003 (std) min: 0.9851, max: 0.9858LR_model cross validation accuarcy score: 0.9861 +/- 0.0004 (std) min: 0.9856, max: 0.9866
DT_model交叉验证准确度得分:0.9853 +/- 0.0003(std)最低:0.985,最高:0.9857RF_model交叉验证准确度得分:0.9854 +/- 0.0003(std)最低:0.9851,最高:0.9858LR_model交叉验证准确度:0.9861 + /-0.0004(std)最小值:0.9856,最大值:0.9866
From the preliminary run, it is found that Logistic Regression shows the best performance out of the selected models.
从初步运行中,发现Logistic回归显示了所选模型中的最佳性能。
Fine-tuning parameters
微调参数
Random Grid Search CV is used to find the optimal parameters for the model.
随机网格搜索CV用于查找模型的最佳参数。
## choose logistic regression
from sklearn.model_selection import GridSearchCV
clf = LogisticRegression()
param_grid = {‘C’ : np.logspace(-4, 4, 20),
 }
gs = GridSearchCV(clf, param_grid = param_grid, cv = split, verbose=True, n_jobs=-1)x_train, x_test, y_train, y_test = train_test_split(x, y, test_size = 0.2, random_state = 10)
gs.fit(x_train,y_train)
Evaluation
评价
y_pred_acc = gs.predict(x_test)print(‘Accuracy Score : ‘ + str(accuracy_score(y_test,y_pred_acc)))
print(‘F1 Score : ‘ + str(f1_score(y_test,y_pred_acc)))##Accuracy Score : 0.9858475648323846
##F1 Score : 0.7597315436241611
Feature Importance
功能重要性
lr = LogisticRegression(random_state=42,n_jobs=-1)
lr.fit(x_train,y_train)
plt.figure(figsize=(10,5))
plt.bar(x.columns,lr.coef_[0])
plt.xticks(rotation=45)
plt.title(‘Feature Importance’)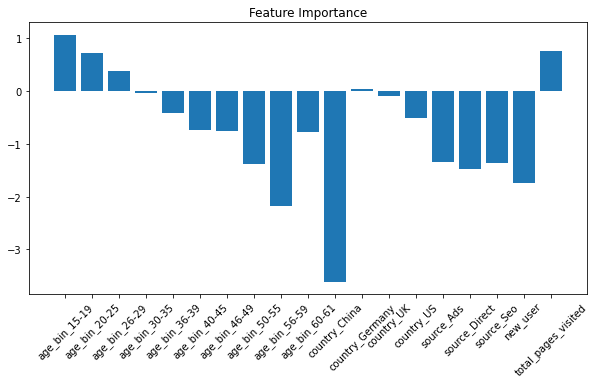
From the coefficients of the features , we can see that the age(15–29) and total_pages_visited have strong influence on the conversion rate prediction.
从特征的系数中,我们可以看出age(15–29)和total_pages_visited对转换率预测有很大的影响。
L 从任务1获得的积分 (Learning points from task 1)
- Since there are two target outcomes, it is better to analyse the results in terms of different outcomes, to discover the potential relationship of the features respect to the outcomes. 由于有两个目标结果,因此最好根据不同的结果分析结果,以发现要素与结果之间的潜在关系。
- It is essential to know what are the determining features that contribute the most to the outcome prediction, which is to know the feature importance. This helps us to analyse the features better. 重要的是要知道哪些对确定结果贡献最大的决定特征,即知道特征的重要性。 这有助于我们更好地分析功能。
- There are possibly some outliers in the data, for example, the age feature, it is not likely for a 100-year-old to have the cognitive abilities to use internet service. We sometimes have to use our common sense to filter out some wrong information for a sound prediction model. 数据中可能存在一些离群值,例如年龄特征,一个100岁的人不太可能具有使用互联网服务的认知能力。 有时,我们必须使用常识为声音预测模型过滤掉一些错误的信息。
任务2渠道分析 (Task 2 Funnel Analysis)
Further analyse conversion at each stage of the funnel, in order to identify areas of improvements.
在渠道的每个阶段都需要进一步分析转化,以找出需要改进的地方。
- A full picture of funnel conversion rate for both desktop and mobile 桌面版和移动版渠道转化率的全貌
- Some insights on what the product team should focus on in order to improve conversion rate as well as anything you might discover that could help improve conversion rate 关于产品团队应专注于哪些方面的一些见解,以提高转化率以及您可能发现的任何有助于提高转化率的内容
Dataset
数据集
User_table:
用户表:
- User_id 用户身份
- Date: date when the user firstly landed on the site 日期:用户首次登陆网站的日期
- Device: user device [mobile/desktop] 设备:用户设备[移动/台式机]
- Sex 性别
2. Visited_page_tables: separate tables containing user_id that have visited the page. Pages are home_page(stage0), search_page(stage1), payment_page(stage2), page_confirmation(stage3) in sequential order.
2. Visited_page_tables:包含已访问页面的user_id的单独表。 页面依次是home_page(stage0),search_page(stage1),payment_page(stage2),page_confirmation(stage3)。
Approach
方法
This is a task that focuses more on data analytics, EDA is key and logical reasoning and deduction is required to tackle this task well.
这是一项更侧重于数据分析的任务,EDA是关键,逻辑推理和推论需要很好地解决。
Data Engineering
数据工程
There are multiple data sources, it is essential to merge them into one master dataset.
有多个数据源,将它们合并到一个主数据集中至关重要。
## read the data and merge them
home_page = pd.read_csv(‘./dataset/home_page_table.csv’)
payment_con = pd.read_csv(‘./dataset/payment_confirmation_table.csv’)
payment_page = pd.read_csv(‘./dataset/payment_page_table.csv’)
search_page=pd.read_csv(‘./dataset/search_page_table.csv’)
user = pd.read_csv(‘./dataset/user_table.csv’)
user[‘home_page’]=1
user[‘search_page’]=0
user[‘payment_page’]=0
user[‘payment_confirmation’]=0
user.loc[user[‘user_id’].isin(search_page.user_id),’search_page’]=1
user.loc[user[‘user_id’].isin(payment_page.user_id),’payment_page’]=1
user.loc[user[‘user_id’].isin(payment_con.user_id),’payment_confirmation’]=1### function to calculate conversion_ratedef conversion_rate(df):
 search_page_rate = df[‘search_page’].sum()/df[‘user_page’].sum()
 payment_page_rate = df[‘payment_page’].sum()/(df[‘payment_page’].sum()+ df[‘search_page’].sum())
 payment_confirmation_rate = df[‘payment_confirmation’].sum()/(df[‘payment_page’].sum()+ df[‘payment_confirmation’].sum())
 return search_page_rate,payment_page_rate,payment_confirmation_rate
Split the data for both mobile and desktop analysis
拆分数据以进行移动和桌面分析
mobile = user[user[‘device’]==’Mobile’]
desktop = user[user[‘device’]==’Desktop’]### conversion rate analysis on both device
mobile_conv = conversion_rate(mobile)
desktop_conv = conversion_rate(desktop)
source = pd.DataFrame({‘mobile’:mobile_conv,’desktop’:desktop_conv},index=[‘search_page’,’payment_page’,’payment_confirmation’])
ax =source.plot.bar()
plt.xticks(rotation=45)
It is clear that the overall conversion rate for mobile is higher than that for desktop, with search_page conversion rate being the same for both cases.
很明显,移动设备的总体转化率高于台式机,而两种情况下的search_page转化率均相同。
Gender analysis on each stage
每个阶段的性别分析
##
mobile_group_stage_sex = mobile.groupby([‘stage_reached’,’sex’])[‘user_id’].count().unstack()desktop_group_stage_sex = desktop.groupby([‘stage_reached’,’sex’])[‘user_id’].count().unstack()figure, ax = plt.subplots(nrows=1, ncols=2)
desktop_group_stage_sex.plot.bar(ax=ax[0],figsize=(10,5))
mobile_group_stage_sex.plot.bar(ax=ax[1])
ax[0].set_title(‘Count of users by stages on desktop’)
ax[1].set_title(‘Count of users by stages on mobile’)
Gender seems to have little impact on the conversion rate. As the count of users of different genders is relatively the same at each stage.
性别似乎对转换率影响不大。 由于在每个阶段,不同性别的用户数量相对相同。
Since this is a funnel analysis, it is natural to use funnel visualisation for the purpose. Here is the code by Travis Tang (Voon Hao).
由于这是漏斗分析,因此自然可以使用漏斗可视化。 这是Travis Tang(Voon Hao)的代码。
from plotly import graph_objects as gostages = [“Home”, “Search”, “Payment”, “Payment Confirmation”]for i in [‘device’, ‘sex’, ‘month’]:
 fig = go.Figure()
 df_plot=df.groupby(i).count()[[‘home’, ‘search’, ‘payment’,’payment_confirmation’]].transpose()for j in df_plot.columns:
 fig.add_trace(go.Funnel(
 name = str(j),
 y = stages,
 x = list(df_plot[j]),
 textinfo = “value+percent previous”))fig.update_layout(template=’seaborn’, title=”Funnel for different {}” .format(i))
 fig.show()


Temporal Analysis
时间分析
user[‘date’]=pd.to_datetime(user[‘date’])
byday_overall = user.groupby([‘date’])[‘user_page’,’search_page’,’payment_page’,’payment_confirmation’].sum()
bydaty_overall_rate = pd.DataFrame(byday_overall.apply(conversion_rate,axis=1))
bydaty_overall_rate.columns=[‘res’]
### split the number in the list to separate columns
bydaty_overall_rate_div = pd.DataFrame([pd.Series(x) for x in bydaty_overall_rate[‘res’]],index=bydaty_overall_rate.index)
bydaty_overall_rate_div.columns =[‘search_page’,’payment_page’,’payment_confirmation’]
bydaty_overall_rate_div.plot.line(figsize=(10,8))
Overall we can see the rate at each stage keeps fluctuating within a range, but there is a sudden drop at 2015–03–02 for search_page stage conversion from 0.6 to 0.4 within a day, which is abnormal. Another unusual trend from that day onwards is that the conversion rate of payment_confirmation > payment_page.
总的来说,我们可以看到每个阶段的速率都在一个范围内波动,但是在2015-03-02年,search_page阶段的转化率在一天之内从0.6突然下降到0.4,这是异常的。 从那天起,另一个不寻常的趋势是,paying_confirmation的转换率> payment_page。
Hence, there is a need to divide into devices to see which device platform accounts for those abnormalities.
因此,需要划分为多个设备以查看哪个设备平台解决了这些异常。

Clearly, conversion rate of the mobile side explains that plummet. On the other hand, desktop accounts for the unusual high payment_confirmation with respect to payment_pages. Then, this is the time we shall ask ourselves, what possibly can cause those to happen, I have come out some reasons for that:
显然,移动端的转换率说明了这一下降。 另一方面,相对于payment_pages,桌面占了异常高的payment_confirmation。 然后,这是时候我们要问自己,什么可能导致这些事情发生,我已经得出了一些原因:
- There might be some bugs in the mobile tracking code, rendering the number to be inaccurate. 移动跟踪代码中可能存在一些错误,导致该数字不准确。
- There can be the issue of site errors and any site changes to the desktop pages 可能存在网站错误的问题,并且任何网站对桌面页面的更改
Overall Analysis and Suggestion
总体分析与建议
- Mobile platform has higher conversion rate than desktop, suggesting that the it might be more user-friendly compared to desktop design. One advice is to improve the user interface design in the desktop. 移动平台的转换率高于桌面平台,这表明与桌面设计相比,移动平台可能更加用户友好。 一种建议是改进桌面中的用户界面设计。
- Investigate what happened on the date of 2015–03–02 to find out the discrepancies in the conversion trend. 调查2015-03-02日期发生了什么,以找出转换趋势中的差异。
Challenges faced in the task
任务中面临的挑战
1. There is a time feature in the data. At first, I did not make use of them, thinking that it is of little use in the task and considering the little time left in the assignment. In fact, it is a big mistake. In a data science interview assignment, every feature has its own significance, the decision of whether to ignore them should be backed up by a valid and strong reasoning. Temporal data analysis is a key part of the analysis given a time feature.
1.数据中有时间功能。 刚开始,我没有使用它们,而是认为它在任务中没有多大用处,并考虑了分配的时间。 实际上,这是一个很大的错误。 在数据科学采访任务中,每个功能都有其自身的重要性,是否忽略它们的决定应由有效且有力的推理来支持。 给定时间特征,时间数据分析是分析的关键部分。
Nevertheless, it is important to identify potential abnormality in the data trend, and even propose a possible reasoning to account for the discrepancies, this can really show that you have critical and logical thinking skills to analyse and solve the problems.
但是,重要的是要确定数据趋势中潜在的异常情况,甚至提出可能的原因以弥补差异,这确实表明您具有分析和解决问题的批判性和逻辑性思维能力。
2. Should carry out a full comparison, finding all potential bivariate relationship among the given features.
2.应该进行全面比较,找到给定特征之间所有潜在的双变量关系。
Ending Note
尾注
Although I have done a few self-initiated projects, this project really gets me started on the data science journey for the first time in a lot more comprehensive way from data visualisation, analysis to model prediction.
尽管我做了一些自发的项目,但该项目确实使我第一次以更全面的方式从数据可视化,分析到模型预测开始了数据科学之旅。
Always start from and link back to the task objective, as it will allow you to be on the right track at all time.
始终从任务目标开始并链接回任务目标,因为它将使您始终处于正确的轨道上。
Keep practising it and doing more projects, you will definitely ace it in the end!
继续练习它并做更多的项目,您肯定会在最后获得成功!
Data Science Interview Guide Part II
If you have any advice, comment or ideas, feel free to share it below or you can even reach out to me via Linkedln.
如果您有任何建议,意见或想法,请随时在下面分享,或者甚至可以通过Linkedln与我联系。
翻译自: https://medium.com/@nyjimmy97/data-science-interview-part-i-take-home-assignment-26ccc244f3b8
大数据数据科学家常用面试题


 2391
2391

 被折叠的 条评论
为什么被折叠?
被折叠的 条评论
为什么被折叠?
 到【灌水乐园】发言


