


 本文介绍了快速的Python技巧,帮助你有效地探索和理解数据。通过这些技巧,可以高效地分析大数据集,应用于人工智能和机器学习项目。
python 数据探索
Simplest and quickest ways to do Exploratory Data Analysis with Pandas
使用Pandas进行探索性数据分析的最简单,最快的方法
“有时候,仅仅做就不够。” ―约翰·奥卡拉汉 (“Sometimes not much is just enough.” ― John O’Callaghan)
I am new to python and used to struggle often with minor data exploratory commands, there are numerous ways to explore datasets and do basic calculations, minor editing to research about data.
我是python的新手,曾经经常使用次要数据探索性命令来挣扎,有很多方法可以探索数据集和进行基本计算,还可以进行次要编辑来研究数据。
Initially, when we are new to python we come across several errors for simple commands, however these can overcome by simple user friendly tips and tricks. I came across some of these and thought of sharing with larger group, especially with new python users. I hope they like it.
最初,当我们不熟悉python时,会遇到一些关于简单命令的错误,但是可以通过简单的用户友好技巧来克服这些错误。 我遇到了其中一些,并想到了与更大的群体共享,特别是与新的python用户共享。 我希望他们喜欢。
I have taken Nobel Laureate dataset from Kaggle to do this exploratory data analysis, you can find the dataset here.
我从Kaggle提取了Nobel Laureate数据集来进行探索性数据分析,您可以在此处找到该数据集。
First of all import Pandas library and read data:
首先导入熊猫库并读取数据:

Now, let’s check the details about this dataset, this is bit old dataset as last couple of years winners name not included.
现在,让我们检查有关此数据集的详细信息,这是有点旧的数据集,因为不包括最近几年的获奖者姓名。

How do we get the number of rows or columns, here are some of the quickest ways:
我们如何获取行数或列数,以下是一些最快的方法:
len(df)
len(df)
len(df.columns)
len(df.columns)
df.columns
df。列

Similarly, if we want to check the complete stats about the dataset:
同样,如果我们要检查有关数据集的完整统计信息,请执行以下操作:

How to check few rows and columns:
如何检查几行和几列:
df.head()
df.head()
df.tail()
df.tail()

Another simplest way, if we want to get few particular rows:
另一种最简单的方法是,如果我们想获得很少的特定行:
df[2:6]
df [2:6]

df[:]
df [:]

Suppose, we want every 10th row from the dataframe, how do we get that:
假设我们想要从数据帧开始的第10行,我们如何得到它:
every_10 = df[::10]
every_10 = df [:: 10]

There’s a another way to get the 10th row:
还有另一种方法可以获取第十行:
df[::10].head()
df [:: 10] .head()

How to get the data in reverse order, how can we get that without disturbing the original data, further we can save it as a new dataframe for more analysis.
如何以相反的顺序获取数据,如何在不干扰原始数据的情况下获取数据,还可以将其另存为新数据框以进行更多分析。
df[::-1]
df [::-1]

Suppose I want particular category, for example I want all the Categories of Nobel Prizes:
假设我想要特定类别,例如我想要所有诺贝尔奖类别:

Similarly, want two of more columns:
同样,需要两个以上的列:

How do we combine particular columns and few rows:
我们如何结合特定的列和几行:
df[8:12][[“Category”, “Sex”]]
df [8:12] [[“类别”,“性”]]

Similarly, if we want a subset of dataframe with few rows and particular columns:
类似地,如果我们想要一个数据行的子集,它的行数和列数很少:
df[[“Category”, “Year”, “Birth Country”]][4:8]
df [[“类别”,“年份”,“出生国家”]] [4:8]

How do we fetch a particular item or key from a dataframe:
我们如何从数据框中获取特定项或键:
df.iat[3,4]
df.iat [3,4]

df.at[10, “Laureate ID”]
df.at [10,“获奖者ID”]

df.at[2, “Motivation”]
df.at [2,“动机”]

Suppose we want to new dataframe with a single category of data, for example, I want to know how many people won Nobel prize from Switzerland :
假设我们要使用单一类别的数据创建新的数据框,例如,我想知道有多少人从瑞士获得了诺贝尔奖:
df1 = df[df[“Birth Country”] == “Switzerland”]
df1 = df [df [“出生国家”] ==“瑞士”]

And suppose I want to filter multiple rows, for example I want a list of Category with winners from three different categories like ‘Peace’, ‘Medicine’ and ‘Economics’.
并假设我想过滤多行,例如,我想要一个类别列表,其中包含来自“和平”,“医学”和“经济”三个不同类别的获奖者。
df2 = df([df[“Category”].isin([“Peace”, “Medicine”, “Economics”])]
df2 = df([df [“ Category”]。isin([“ Peace”,“ Medicine”,“ Economics”])]]

We can also do some mathematical calculations, although this dataset is not suitable for that, however let’s try with minimal available numerical columns:
我们也可以进行一些数学计算,尽管此数据集不适合这样做,但是让我们尝试使用最少的可用数值列:

Now, suppose we want to check the correlation within dataset:
现在,假设我们要检查数据集中的相关性:

Now, if we want to sort our dataset with certain criteria, for example I want data based on Category of winners:
现在,如果我们要使用特定条件对数据集进行排序,例如,我想要基于获奖者类别的数据:
df.sort_values(by=[“Category”], ascending = False)
df.sort_values(by = [“类别”],升序= False)

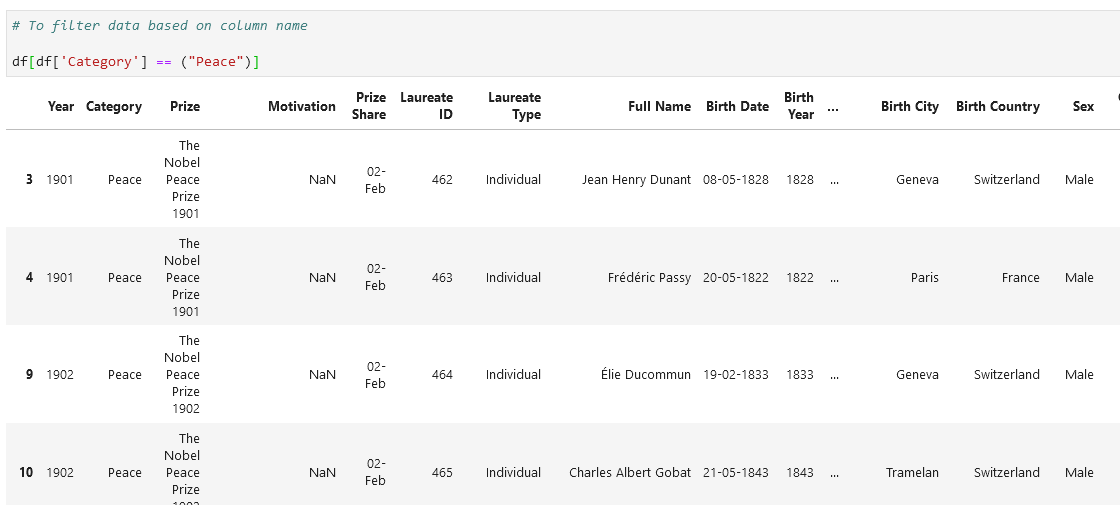
And if, I want some more granular filtering:
如果需要的话,我想进行一些更详细的过滤:
df[df[“Category”] == (“Peace”)]
df [df [“类别”] ==(“和平”)]
Now, let’s try to do some mathematical calculations, for example, I want to calculate the age of all the winners, from the same dataset. We have only option is to subtract Death Year with Birth Year, however couple of challenges in this, as Death Year is an object field, we need to convert it to float first. Than we need to rename the column as it will take single word.
现在,让我们尝试进行一些数学计算,例如,我想从同一数据集中计算所有获奖者的年龄。 我们唯一的选择是用死亡年减去死亡年,但是在这方面有一些挑战,因为死亡年是一个对象字段,我们需要将其转换为浮点数。 比我们需要重命名该列,因为它将使用单个单词。
Here’s how we can do that in same dataframe:
这是我们可以在同一数据框中执行的操作:


Created a new column ‘Age’ and calculated it:
创建一个新的“年龄”列并进行计算:
df[“Age”] = df.DeathYear — df.BirthYear
df [“年龄”] = df.DeathYear — df.BirthYear

Now the finally the dataset with age of winner’s will look like this:
现在,最终具有获奖者年龄的数据集将如下所示:
df[[“Category”, “Year”, “Full Name”, “Age”]].head()
df [[“类别”,“年份”,“全名”,“年龄”]]。head()

These are some of the tips for easy and quick exploration of dataset, as I mentioned in the beginning there are various other ways to do that it only requires regular practice.
这些是一些轻松而快速地探索数据集的技巧,正如我在开始时提到的那样,还有许多其他方式可以做到这一点,而这仅需要常规实践即可。
结论: (Conclusion:)
To summarize, these are some of the easiest ways to do data exploratory analysis, quite often we used to struggle or take help of google, stackoverflow for basic python syntax. I hope this will help the python novice users to remember these quick tips and help them in their regular data analysis.
总而言之,这些是进行数据探索性分析的一些最简单的方法,很多时候我们曾经为了基本的python语法而奋斗或寻求Google的stackoverflow帮助。 我希望这将有助于python新手用户记住这些快速提示,并帮助他们进行常规数据分析。
Thanks for reading, let me know if you have any other shortcut tips, tricks which can help in data analysis. You can find the complete EDA at Kaggle. please share your feedback at tej_on@outlook.com.
感谢您的阅读,如果您还有其他捷径提示可以帮助您进行数据分析,请告诉我。 您可以在Kaggle找到完整的EDA。 请通过tej_on@outlook.com分享您的反馈意见。
翻译自: https://medium.com/swlh/quick-python-tips-to-explore-data-f851186a2631
python 数据探索


 722
722

 被折叠的 条评论
为什么被折叠?
被折叠的 条评论
为什么被折叠?
 到【灌水乐园】发言


