


spotify歌曲下载
The spotify API allows us to create a simple server-side application that accesses user related data from the Spotify app. It also gives you access to information that is not available on the app, such as artist popularity, song metrics, album cover images, etc. It allows you to create, delete and modify existing playlists in a user’s account.
Spotify API使我们可以创建一个简单的服务器端应用程序,该应用程序可以从Spotify应用程序访问与用户相关的数据。 它还使您可以访问应用程序上不可用的信息,例如艺术家流行度,歌曲指标,专辑封面图像等。它允许您创建,删除和修改用户帐户中的现有播放列表。
The goal of this project is to use a clustering algorithm to break down a large playlist into smaller ones. For this, song metrics such as ‘danceability’, ‘valence’, ‘tempo’, ‘liveness’, ‘speechiness’ are used.
该项目的目标是使用聚类算法将大型播放列表分解为较小的播放列表。 为此,使用诸如“舞蹈性”,“价”,“节奏”,“活力”,“语音性”之类的歌曲度量。
在本文中,您将找到: (In this article you will find:)
- Data collection using the Spotify API 使用Spotify API收集数据
- Finding the ideal number of clusters 寻找理想的集群数
- Elbow method and silhouette analysis 肘法和轮廓分析
- Feature selection 功能选择
- Clustering algorithm 聚类算法
- Playlist creation and performance analysis 播放列表的创建和效果分析
数据采集 (Data Collection)
import spotipy
from spotipy.oauth2 import SpotifyOAuth
from spotipy.oauth2 import SpotifyClientCredentials
Connecting to the spotify API was pretty straightforward and the content is pretty well documented. This link will give you all the information you need for connecting and this will give you python sample code.
连接到Spotify API非常简单,并且内容也有据可查。 这个链接会给你你需要连接的所有信息, 这会给你的Python代码示例。
Go to https://developer.spotify.com/dashboard/ and click Create a Client ID or Create an App to get your “Client ID” and “Client Secret”. After that, Redirect URI must be changed to any page you decide on in the settings of your Spotify application.
转到https://developer.spotify.com/dashboard/并单击创建客户端ID或创建应用程序以获取“ 客户端ID ”和“ 客户端密钥 ”。 之后,必须将重定向URI更改为您在Spotify应用程序设置中确定的任何页面。
scope = "user-library-read playlist-modify-private"
OAuth = SpotifyOAuth(
        scope=scope,
        redirect_uri='http://localhost:8888/callback',
        client_id = 'client_id',
        client_secret = 'client_secret',
        username= 'username')
The variable “sp” will work as the access key to Spotify data and will allow us to use all the functions to GET and POST requests to and from spotify.
变量“ sp”将用作Spotify数据的访问键,并允许我们使用所有功能来获取和发布来自Spotify的请求。
sp = spotipy.Spotify(auth_manager=OAuth)保存的曲目数据收集 (Saved tracks Data Collection)
The next step is to collect the data from my “Liked Songs” Playlist.
下一步是从“ 喜欢的歌曲 ”播放列表中收集数据。
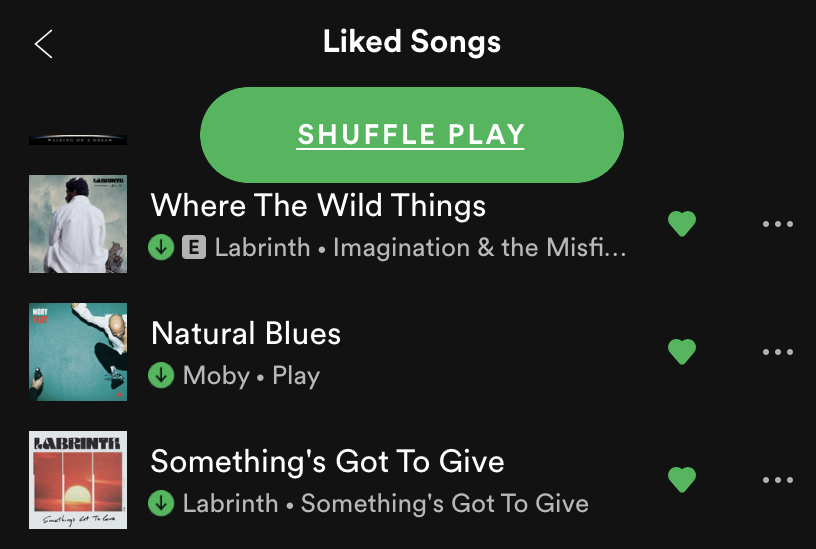
The API can only extract 50 songs at a time therefore we run a while loop that goes through the entire playlist in sets of 50. The function used to access my personal liked songs is current_user_saved_tracks().
API一次只能提取50首歌曲,因此我们运行一个while循环,遍历整个播放列表(以50组为一组)。用于访问我个人喜欢的歌曲的函数是current_user_saved_tracks()。
offset = 0songs = []
items = []
ids = []
while True:
    content = sp.current_user_saved_tracks(limit=50, offset=offset)
    songs += content['items']
    if content['next'] is not None:
        offset += 100else:
        break
The following step is to extract the audio features of each song by using the audio_features() function:
下一步是使用audio_features()函数提取每首歌曲的音频功能:
for i in songs:
   ids.append(i['track']['id'])while index < len(ids):
    audio_features += sp.audio_features(ids[index:index + 50])
    index += 50features_list = []
for features in audio_features:
    features_list.append([features['energy'], features['liveness'],features['tempo'],features['speechiness'],
                          ...features['mode'], features['type'],features['uri']])
df = pd.DataFrame(features_list, columns=['energy', 'liveness','tempo', 'speechiness',... 'mode', 'type','uri'])
The result is a pandas dataframe that gathers the songs on the rows and their respective features on the columns. Each song is identified by its unique uri.
结果是一个pandas数据框,该数据框收集行中的歌曲以及列中的相应特征。 每首歌都有其独特的uri标识。


Just for fun, I decided to look at the distribution of the feature values across all the songs in my playlist:
只是为了好玩,我决定查看播放列表中所有歌曲的功能值分布:
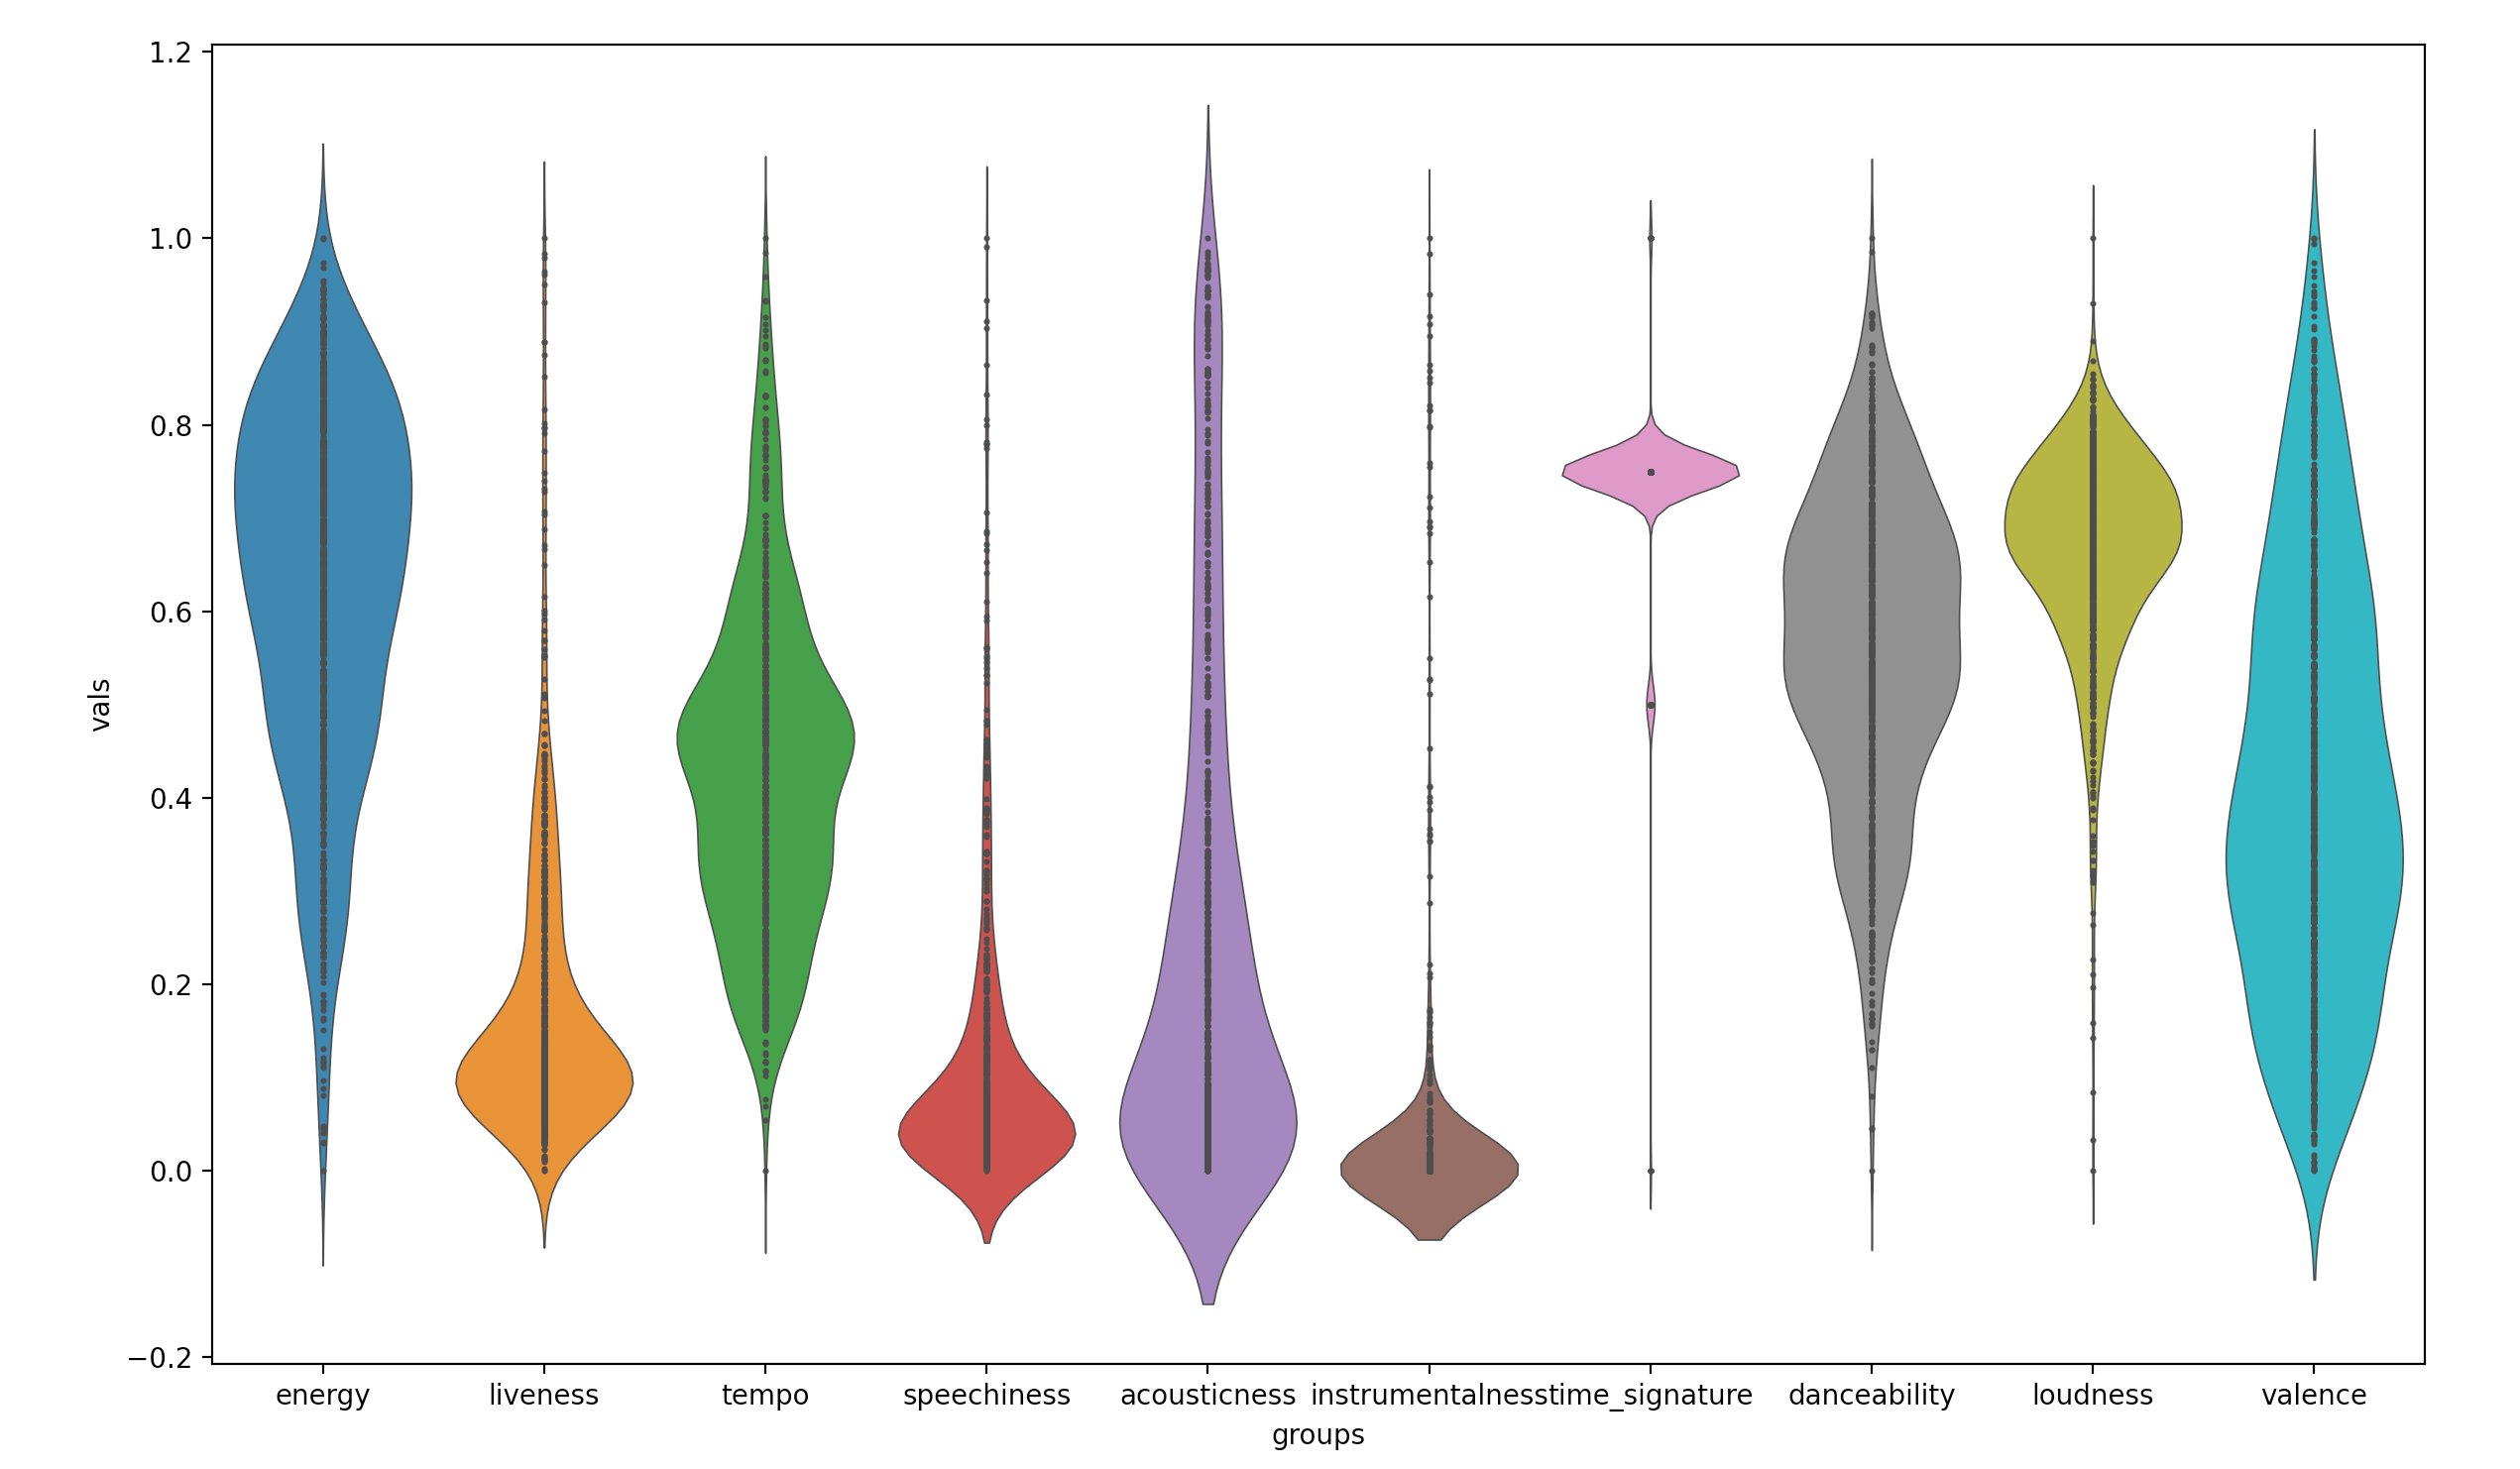
I concluded very quickly that there is no strong correlation between these metrics. Songs did not follow a set pattern depending on their genre. When trying to perform clustering based of all 12 features, the results were not great… For this I decided to use a lower number of metrics and tested all the possible combinations of features that would yield the best clusters.
我很快得出结论,这些指标之间没有很强的相关性。 歌曲的流派不遵循设定的模式。 当试图基于所有12个功能执行聚类时,结果并不理想。为此,我决定使用较少数量的指标,并测试了可以产生最佳聚类的所有可能功能组合。

寻找理想的集群数 (Finding the ideal number of clusters)
Before trying a clustering algorithm on all 12 features, I decided to handpick a few features for the clustering in the hope that it would yield a better cluster quality.
在尝试对全部12个功能进行聚类算法之前,我决定为聚类选择一些功能,以期能够产生更好的聚类质量。
The first step was to normalise all the values such that they lie within [0 ; 1].
第一步是对所有值进行标准化,使其位于[0; 1]。
from sklearn import preprocessingx = df.values
min_max_scaler = preprocessing.MinMaxScaler()
x_scaled = min_max_scaler.fit_transform(x)
df = pd.DataFrame(x_scaled)
The following step was to find a cluster quality metric based on a selection of a few features. The first thing I did was create a list with all the song metrics and then used the permutations() function to create a set of all possible combinations using three song features at the time.
下一步是根据一些功能的选择来找到集群质量指标。 我要做的第一件事是创建一个包含所有歌曲指标的列表,然后使用permutations()函数使用三个歌曲功能来创建一组所有可能的组合。
columns = ["energy",  "speechiness", "acousticness", "instrumentalness", "loudness","tempo","danceability",'valence' , "liveness", "time_signature", "key"]
perm = permutations(columns, 3)
output = set(map(lambda x: tuple(sorted(x)),perm))
For each permutation I computed a cluster score using the elbow method.
对于每个排列,我使用弯头方法计算了聚类得分。
The elbow method is a heuristic approach used in determining the number of clusters in a data set. The method consists of plotting the explained variation as a function of the number of clusters, and picking the elbow of the curve as the number of clusters to use.
弯头方法 是一种启发式方法,用于确定数据集中的簇数。 该 方法 包括将解释的变化绘制为簇数的函数,并选择 曲线 的 肘部 作为要使用的簇数。
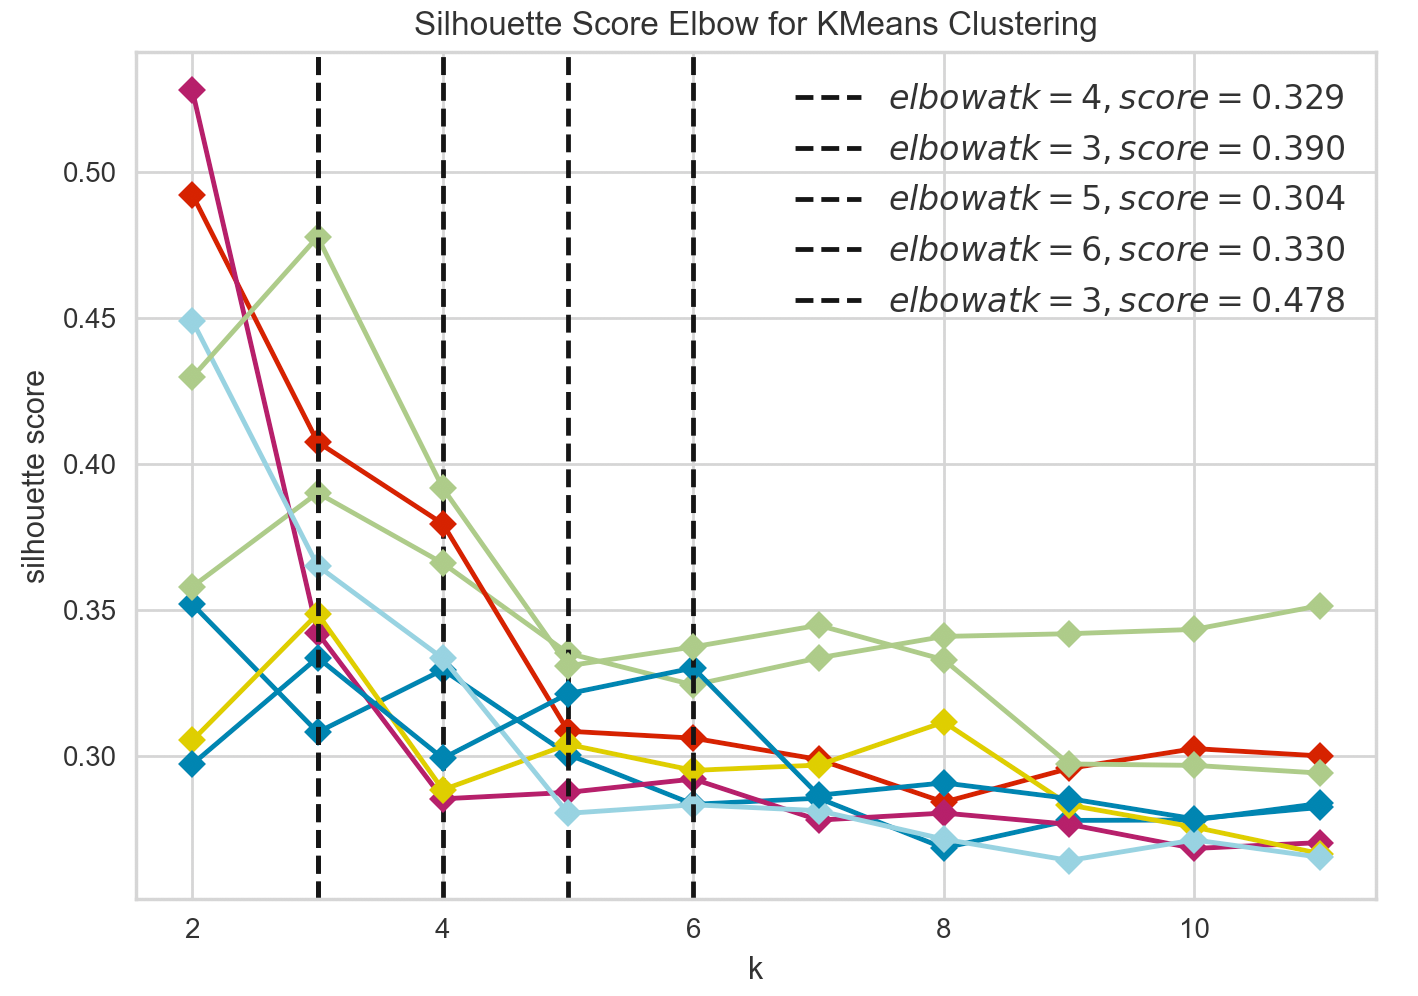
For each permutation I extracted an elbow score and an elbow value. The score tells me how good the clustering was for this permutation, the elbow value tells me the ideal number of clusters for that permutation.
对于每个排列,我提取了一个弯头得分和一个弯头值。 分数告诉我此排列的聚类效果如何, 弯头值告诉我该排列的理想聚类数量。
model = KMeans(random_state=0)
visualizer = KElbowVisualizer(model, k=(2,12), metric='silhouette', timings=False)
visualizer.fit(x_scaled)
score = visualizer.elbow_score_
value = visualizer.elbow_value_
The result is a pandas dataframe of feature permutations and their corresponding ideal number of clusters and the quality score of these clusters.
结果是具有特征排列及其相应的理想簇数和这些簇的质量得分的熊猫数据帧。
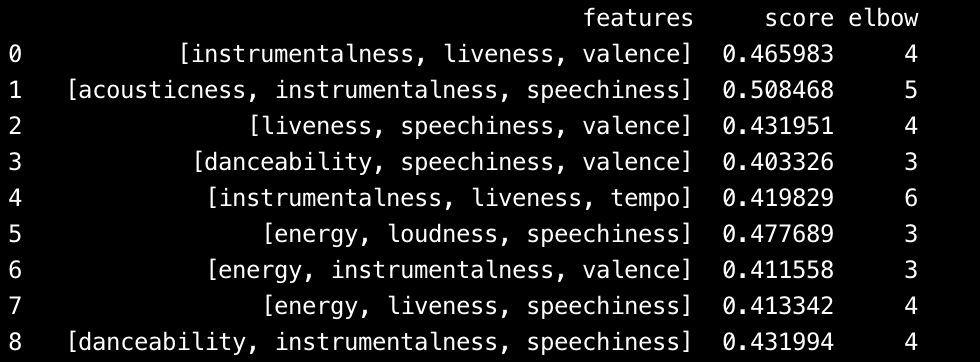
Once the scores are calculated for each permutation, I decided to pick the ones above >0.4 and to save them in a separate dataframe.
一旦为每个排列计算了分数,我决定选择> 0.4以上的分数并将其保存在单独的数据框中。
if score>0.4:
    idx = df.columns
    mylist = idx.tolist()
    dict = {
        "features": mylist,"score": score,"elbow": value
    }
    df2 = df2.append(dict, ignore_index=True)
群集和播放列表创建 (Clustering and Playlist creation)
There were many permutations that yielded great results with scores even above >0.5.
有许多排列产生了很好的结果,分数甚至超过了0.5。
The permutation [‘instrumentalness’, ‘speechiness’, ‘valence’] suggested creating 4 clusters and had a score of 0.504. This is the one I selected for my playlist creation.
排列['工具性','语音性','价']建议创建4个聚类,得分为0.504。 这是我为播放列表创建选择的一个。
I scaled a dataframe only containing those three metrics and then performed the clustering using the KMeans() function.
我缩放了仅包含这三个指标的数据框 ,然后使用KMeans()函数执行了聚类。
from sklearn.cluster import KMeanskmeans = KMeans(init="k-means++",n_clusters=4,random_state=15,max_iter = 500).fit(x_scaled)
df1['kmeans'] = kmeans.labels_
df1.columns = ['energy', 'instrumentalness', 'loudness','kmeans' ]
The result is a dataframe that contains a song per row with a label [0, 1, 2, 3] corresponding to each cluster that particular song was assigned to. The feature distribution clearly shows that energy and loudness are distributed differently across all clusters.
结果是一个数据帧,该数据帧每行包含一首歌,其标签[0、1、2、3]对应于分配了特定歌曲的每个群集。 特征分布清楚地表明,能量和响度在所有群集中的分布不同。

The 3D scatter plot gives a different perspective showing that higher values of instrumentalness were sorted into the same cluster while energy and loudness differentiated the remaining three clusters.
3D散点图给出了不同的视角,表明较高的工具性值被分类到同一群集中,而能量和响度则将其余三个群集区分开。

非常感谢您的阅读! (Thanks a lot for reading!)
For more articles like this, find me on Medium here!
如需更多类似文章,请在此处找到我!
If you have any questions, suggestions or ideas on how to improve, please leave a comment below or get in touch through LinkedIn here.
如果您对改进有任何疑问 , 建议或想法 ,请在下面留下评论或通过LinkedIn 在此处联系 。

Github仓库 (Github repository)
All the code can be found on Github here. The permutations script can be found in analysis_v2.py and the clustering can be found in feature_analysis.py.
所有代码都可以在Github上找到 。 排列脚本可以在analysis_v2.py中找到,聚类可以在feature_analysis.py中找到。
翻译自: https://towardsdatascience.com/k-means-clustering-using-spotify-song-features-9eb7d53d105c
spotify歌曲下载


 436
436


 被折叠的 条评论
为什么被折叠?
被折叠的 条评论
为什么被折叠?
 到【灌水乐园】发言


