


python 仪表盘
Dashboard scraping is a useful skill to have when the only way to interact with the data you need is through a dashboard. We’re going to learn how to scrape data from a dashboard using the Selenium and Beautiful Soup packages in Python. The Selenium package allows you to write Python code to automate web browser interaction, and the Beautiful Soup package allows you to easily pull data from the HTML code that produces the webpage you want to scrape.
当与所需数据进行交互的唯一方法是通过仪表板时,仪表板抓取是一项有用的技能。 我们将学习如何使用Python中的Selenium和Beautiful Soup软件包从仪表板上抓取数据。 Selenium程序包允许您编写Python代码来自动执行Web浏览器交互,而Beautiful Soup程序包则使您可以轻松地从生成您要抓取的网页HTML代码中提取数据。
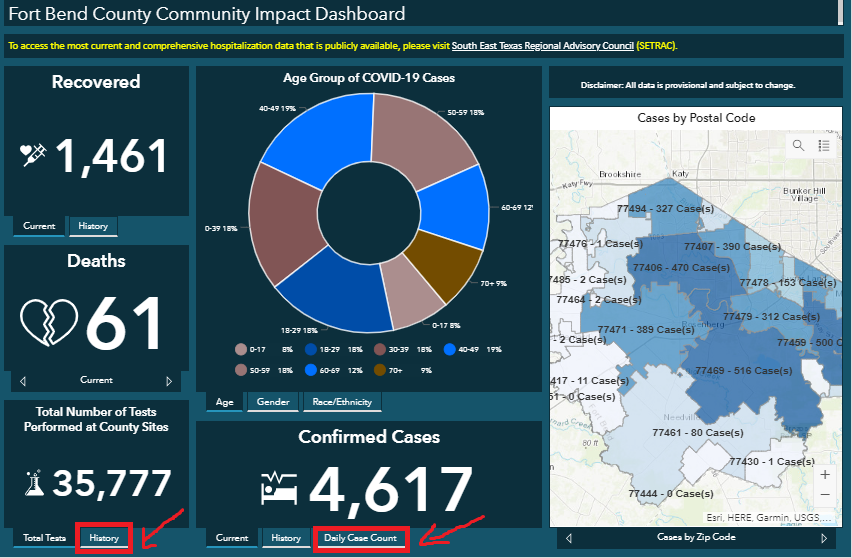
Our goal is to scrape the Fort Bend County Community Impact Dashboard that visualizes the COVID-19 situation in Fort Bend County in Texas. We will extract the history of total tests performed and the daily case counts reported so that we can estimate the percent of positive cases in Fort Bend County.
我们的目标是刮擦本德堡县社区影响仪表板 ,以可视化方式显示德克萨斯州本德堡县的COVID-19情况。 我们将提取进行的总检测的历史记录和每日报告的病例计数,以便我们可以估算本德堡县阳性病例的百分比。
Note that all of the code in this tutorial is written in Python version 3.6.2.
请注意,本教程中的所有代码都是使用Python 3.6.2版编写的。
步骤1:导入Python软件包,模块和方法 (Step 1: Import Python Packages, Modules, and Methods)
The first step is to import the Python packages, modules, and methods needed for dashboard scraping. The versions of the packages used in this tutorial are listed below.
第一步是导入仪表板抓取所需的Python包,模块和方法。 下面列出了本教程中使用的软件包的版本。
步骤2:抓取HTML源代码 (Step 2: Scrape HTML Source Code)
The next step is to write Python code to automate our interaction with the dashboard. Before writing any code, we must look at the dashboard and inspect its source code to identify the HTML elements that contain the data we need. The dashboard source code refers to the HTML code that tells your browser how to render the dashboard web page. To view the dashboard source code, navigate to the dashboard and use the keyboard shortcut Ctrl+Shift+I. An interactive panel containing the dashboard source code will appear.
下一步是编写Python代码来自动化我们与仪表板的交互。 在编写任何代码之前,我们必须查看仪表板并检查其源代码以识别包含我们所需数据HTML元素。 仪表板源代码是指HTML代码,它告诉您的浏览器如何呈现仪表板网页。 要查看仪表板源代码,请导航至仪表板并使用键盘快捷键Ctrl+Shift+I 将出现一个包含仪表板源代码的交互式面板。
Notice that the history of total tests performed and the daily case counts reported are only visible after clicking the “History” tab in the “Total Numbers of Tests Performed at County Sites” panel and the “Daily Case Count” tab in the “Confirmed Cases” panel, respectively. This means that we need to write Python code that automatically clicks on the “History” and “Daily Case Count” tabs so that the history of total tests performed and the daily case counts reported will be visible to Beautiful Soup.
请注意,仅在单击“县站点执行的测试总数”面板中的“历史记录”选项卡和“已确认案例”中的“每日案例计数”选项卡之后,才可以执行总测试的历史记录和报告的每日案例计数”面板。 这意味着我们需要编写Python代码,该代码自动单击“历史记录”和“每日案例计数”选项卡,以便Beautiful Soup可以看到执行的总测试的历史记录和每日报告的案例计数。
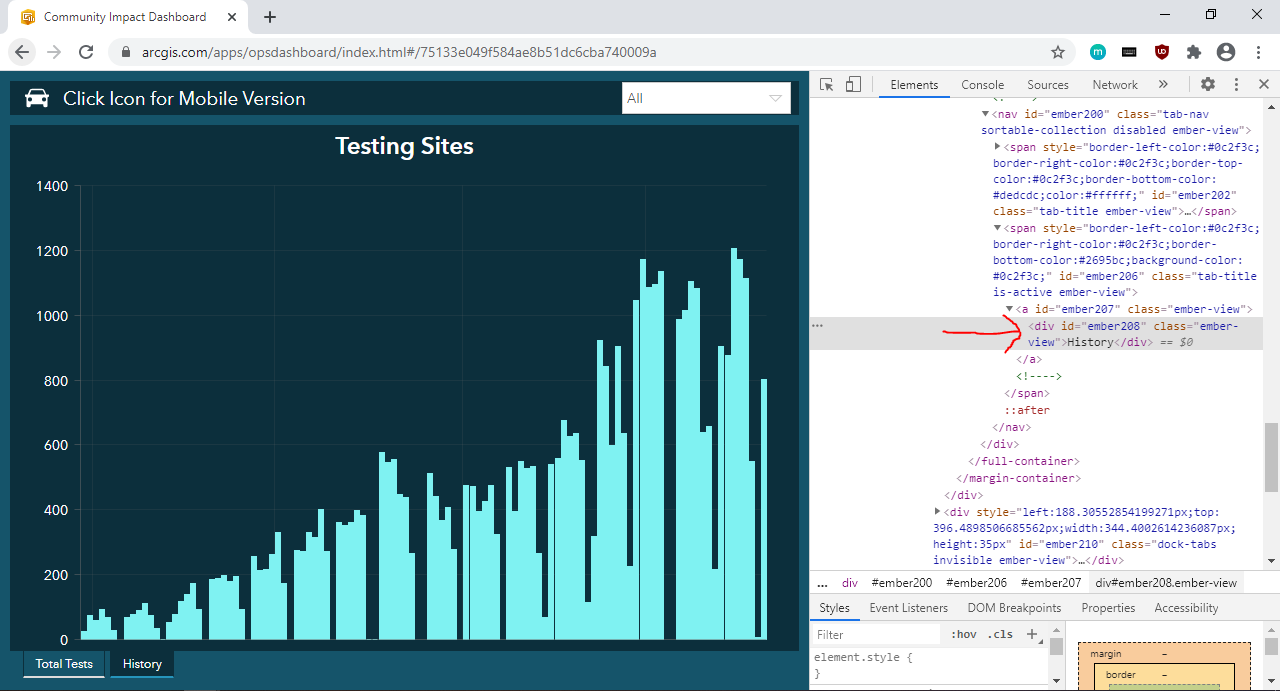
To find the HTML element that contains the “History” tab, use the shortcut Ctrl+Shift+C and then click on the "History" tab. You will see in the source code panel that the "History" tab is in a div element with ID "ember208".
要查找包含“历史记录”选项卡HTML元素,请使用快捷键Ctrl+Shift+C ,然后单击“历史记录”选项卡。 您将在源代码面板中看到“历史记录”选项卡位于ID为“ ember208”的div元素中。
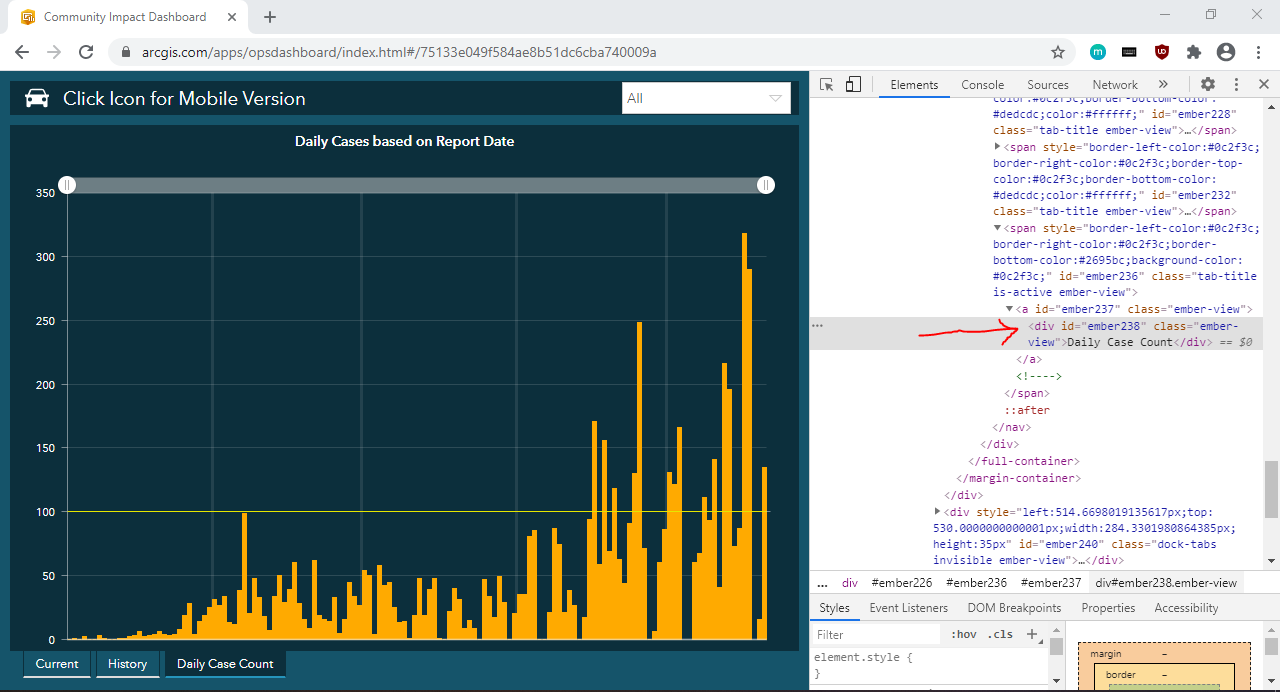
Following the same steps for the “Daily Case Count” tab, you will see that the “Daily Case Count” tab is in a div element with ID “ember238”.
按照“每日案件计数”标签的相同步骤,您将看到“每日案件计数”标签位于ID为“ ember238”的div元素中。
Now that we have identified the elements we need, we can write code that:
现在我们已经确定了所需的元素,我们可以编写代码:
- Launches the dashboard in Chrome 在Chrome中启动仪表板
- Clicks on the “History” tab once the “History” tab finishes loading 一旦“历史记录”选项卡完成加载,请单击“历史记录”选项卡
- Clicks on the “Daily Case Count” tab once the “Daily Case Count” tab finishes loading 一旦“每日病例数”选项卡完成加载,请单击“每日病例数”选项卡
- Extracts the dashboard HTML source code 提取仪表板HTML源代码
- Exits Chrome 退出Chrome
步骤3:从HTML解析数据 (Step 3: Parse Data from HTML)
Now, we need to parse the HTML source code to extract the history of total tests performed and the daily case counts reported. We will begin by looking at the dashboard source code to identify the HTML elements that contain the data.
现在,我们需要解析HTML源代码,以提取执行的总测试的历史记录和每日报告的病例数。 我们将从查看仪表板源代码开始,以识别包含数据HTML元素。
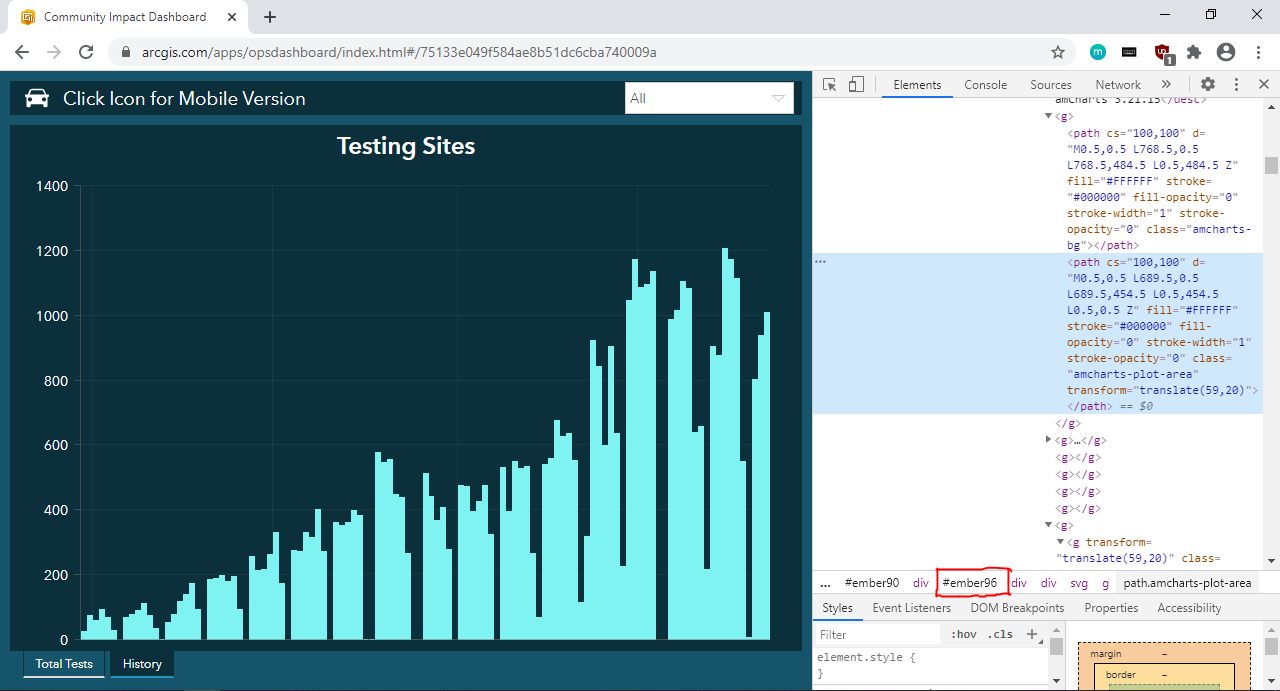
To find the div element that contains the history of total tests performed, use the Ctrl+Shift+C shortcut and then click in the general area of the "Testing Sites" plot. You will see in the source code that the entire plot is in the div element with ID "ember96".
要查找包含已执行的全部测试的历史记录的div元素,请使用Ctrl+Shift+C快捷键,然后单击“测试站点”图的常规区域。 您会在源代码中看到整个图位于ID为“ ember96”的div元素中。
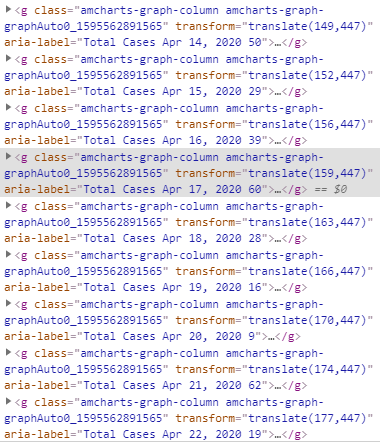
If you hover over a specific data point, a label containing the date and number of tests performed will appear. Use the Ctrl+Shift+C shortcut and click on a specific data point. You will see that the label text is stored as the aria-label attribute of a g element.
如果将鼠标悬停在特定数据点上,则会显示一个标签,其中包含执行的测试的日期和数量。 使用Ctrl+Shift+C快捷键,然后单击特定的数据点。 您将看到标签文本存储为g元素的aria-label属性。
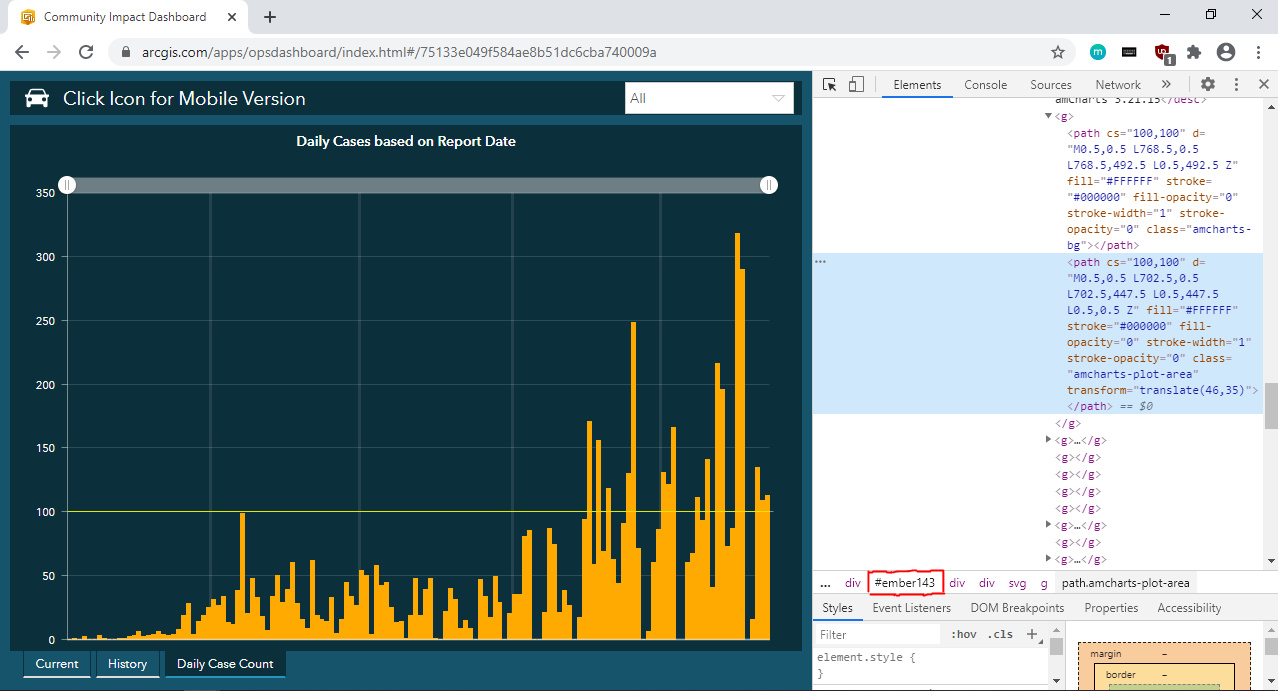
Following the same steps for the daily case counts reported, you will see that the plot of daily case counts is in the div element with ID “ember143”.
按照报告的每日案件计数的相同步骤,您将看到每日案件计数的图位于ID为“ ember143”的div元素中。
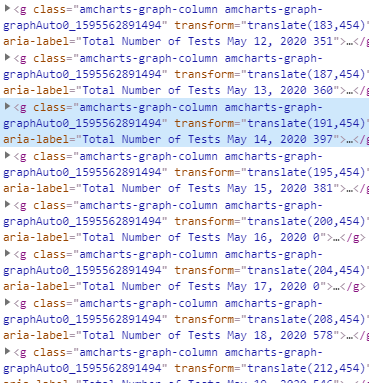
If you hover over a specific data point, a label containing the date and the number of positive cases reported will appear. Using the Ctrl+Shift+C shortcut, you will notice that the data are also stored in the aria-label attribute of g elements.
如果将鼠标悬停在特定数据点上,将显示一个标签,其中包含日期和报告的阳性病例数。 使用Ctrl+Shift+C快捷键,您会注意到数据也存储在g元素的aria-label属性中。
Once we have the elements that contain the data, we can write code that:
一旦有了包含数据的元素,就可以编写代码:
- Finds the div element that contains the plot of the total tests performed and pulls the total tests performed data 查找包含执行的总测试次数的图的div元素,并提取执行的总测试数据
- Finds the div element that contains the plot of the daily case counts and pulls the daily case count data 查找包含每日案件计数图的div元素,并提取每日案件计数数据
- Combines the data in a pandas dataframe and exports it to a CSV 将数据合并到pandas数据框中,并将其导出到CSV
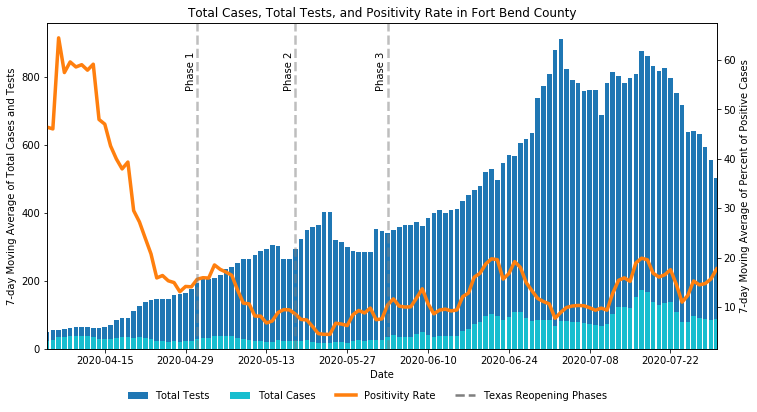
步骤4:计算正率 (Step 4: Calculate Positivity Rate)
Now, we can finally estimate the COVID-19 positivity rate in Fort Bend County. We will divide the cases reported by the tests performed and calculate the 7-day moving averages. It is unclear from the dashboard whether the reported positive cases include cases that were determined through tests not conducted by the county (e.g. tests conducted at a hospital or clinic). It is also unclear when the tests for the positive cases were conducted since the dashboard only displays the reported case date. That is why the positivity rates derived from these data are only considered a rough estimate for the true positivity rate.
现在,我们终于可以估算出本德堡县的COVID-19阳性率。 我们将通过执行的测试报告的案例相除,并计算7天移动平均值。 从仪表板尚不清楚,报告的阳性病例是否包括那些不是由县进行的检测(例如,在医院或诊所进行的检测)确定的病例。 还不清楚何时进行阳性病例的测试,因为仪表板仅显示报告的病例日期。 这就是为什么仅将这些数据得出的阳性率视为真实阳性率的粗略估计。
翻译自: https://towardsdatascience.com/how-to-scrape-a-dashboard-with-python-8b088f6cecf3
python 仪表盘


 4480
4480

 被折叠的 条评论
为什么被折叠?
被折叠的 条评论
为什么被折叠?
 到【灌水乐园】发言


