


大数据技术 学习之旅
Machine Learning seems to be fascinating to a lot of beginners but they often get lost into the pool of information available across different resources. This is true that we have a lot of different algorithms and steps to learn but starting with a strong base not only gives confidence but also the motivation to learn and explore further. In this story, we will go through the steps on how to set up your environment and start learning with the help of a known dataset i.e. IRIS dataset which is a multi-class classification problem in Machine Learning. We will also go through some helpful python libraries which can speed up the learning process which can help you even if you are a data scientist. If you have done the setup already, you can skip the setup steps. Let’s begin with the first step of your journey.
机器学习似乎使许多初学者着迷,但是他们常常迷失在跨不同资源的可用信息库中。 的确,我们有很多不同的算法和步骤需要学习,但是从一个强大的基础开始不仅会给人信心,而且还会激发学习和进一步探索的动力。 在这个故事中,我们将逐步了解如何设置环境并借助已知数据集(即IRIS数据集)开始学习,该数据集是机器学习中的多类分类问题。 我们还将介绍一些有用的python库 ,这些库可以加快学习过程,即使您是数据科学家 ,也可以为您提供帮助。 如果已经完成设置,则可以跳过设置步骤。 让我们从旅程的第一步开始。
搭建环境 (Setting up the Environment)
We will use the Anaconda distribution to setup the data science environment. Download the latest version of Anaconda from here and open the anaconda prompt and run the following command-
我们将使用Anaconda发行版来设置数据科学环境。 从此处下载最新版本的Anaconda,然后打开anaconda提示符并运行以下命令:
jupyter notebookThe above command will start the Jupyter server and load the notebook directory in your browser.
上面的命令将启动Jupyter服务器,并在浏览器中加载笔记本目录。
创建一个虚拟环境 (Create a virtual environment)
I hope you are aware of virtual environments, if not you can read about them here. Although Anaconda comes with a base environment which is having most of the libraries already installed, it is recommended to use virtual environments as they help us to manage different environments that can have different packages and if something goes wrong with one environment it will not affect others. Here are the commands you can use to create, activate, and install packages in the virtual environment.
我希望您了解虚拟环境,如果没有,您可以在这里阅读有关它们的信息 。 尽管Anaconda带有一个已安装了大多数库的基本环境 ,但建议使用虚拟环境,因为它们可以帮助我们管理可以具有不同程序包的不同环境,如果一个环境出了问题,则不会影响其他环境。 。 这是可用于在虚拟环境中创建,激活和安装软件包的命令。
将虚拟环境与笔记本链接 (Link virtual environment with the Notebook)
By default, the new environment would not show up in the Jupyter notebook. You need to run following commands to link your environment with Jupyter client
默认情况下,新环境不会显示在Jupyter笔记本中。 您需要运行以下命令来将环境与Jupyter客户端链接
启动笔记本和有用的命令 (Starting notebook and useful commands)
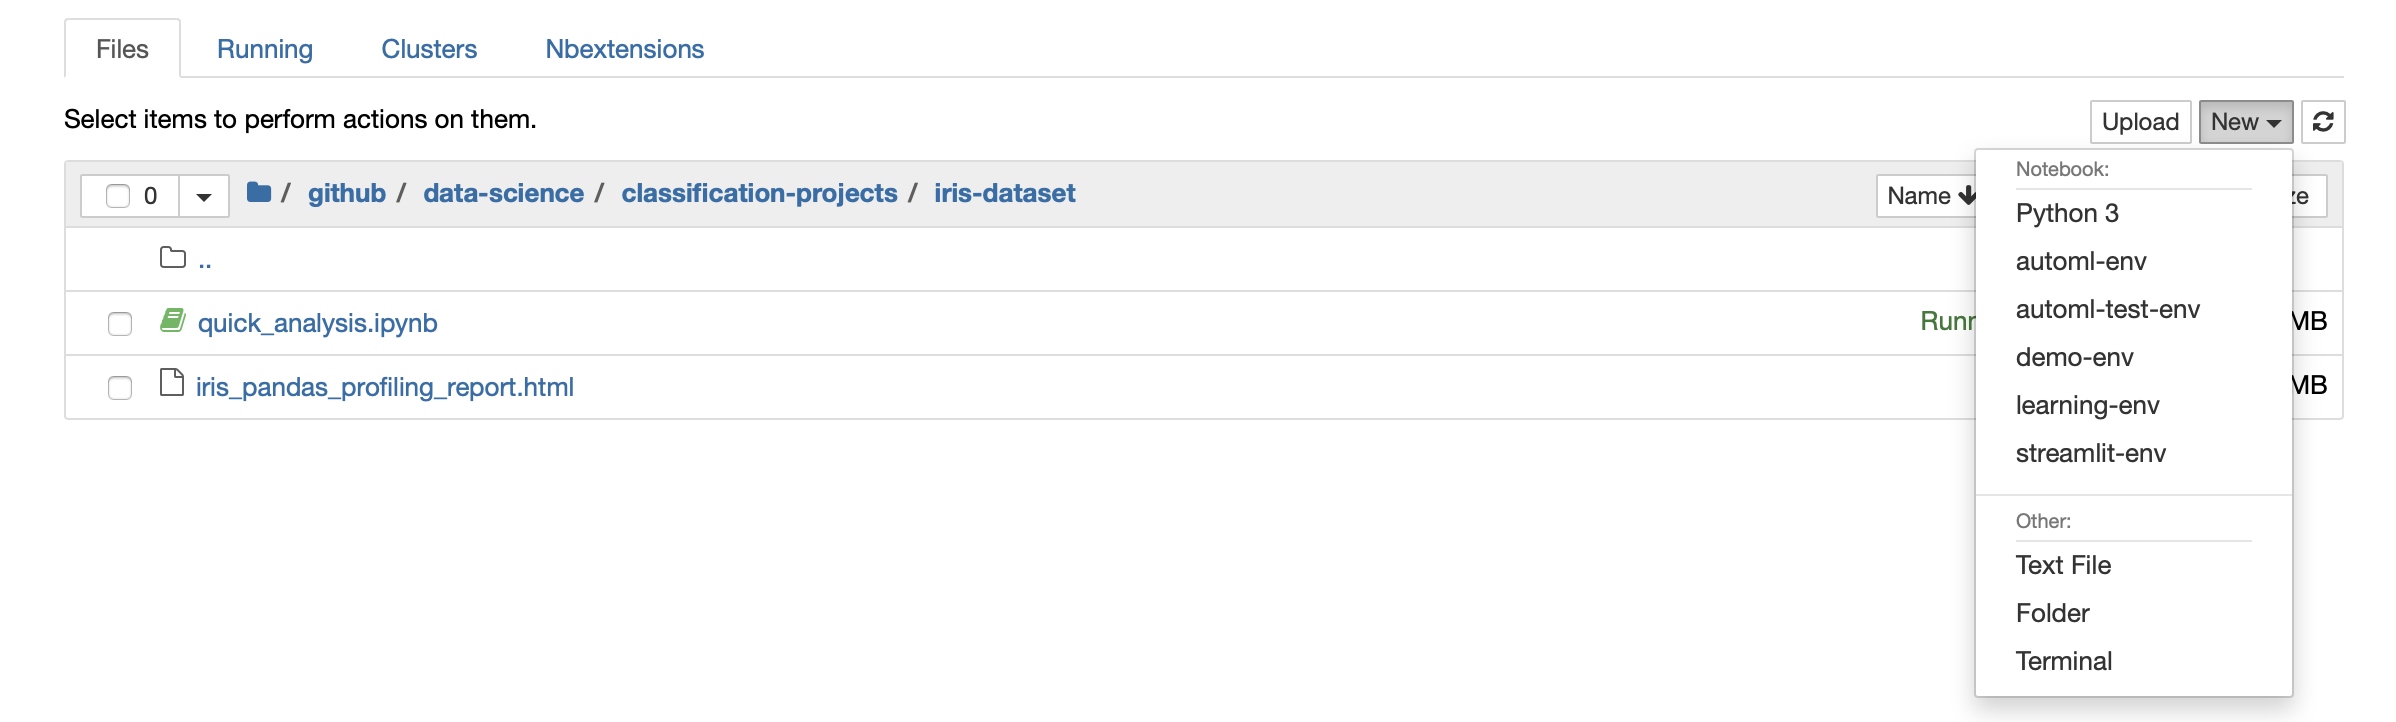
Once you have a virtual environment, go to the browser and open a new notebook as shown below. Select the environment you just created.
拥有虚拟环境后,请转到浏览器并打开一个新笔记本,如下所示。 选择您刚刚创建的环境。
Jupyter notebook provides many handy shortcuts. Below 2 are my favorite-
Jupyter笔记本电脑提供了许多方便的快捷方式。 以下2是我的最爱-
- Tab- this acts as a autocomplete. Tab-这是自动完成。
- Shift + Tab- this will give you the command details and you do not need to go to the library documentation every time. Shift + Tab键-这将为您提供命令详细信息,您无需每次都转到库文档。
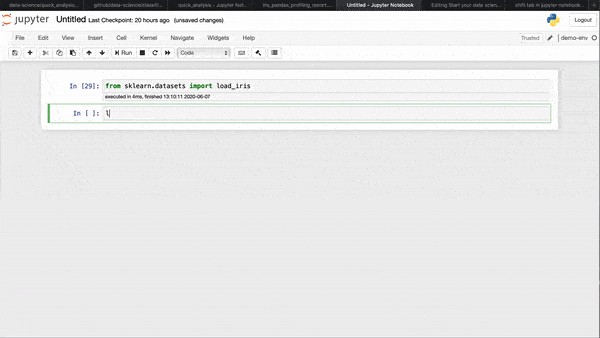
See, how these commands can be helpful
看,这些命令有什么帮助
探索Python库并应用机器学习 (Exploring Python libraries and applying Machine Learning)
We need to have different libraries for loading the data sets, visualizations, and modeling. We will go through each and install them in the environment. You can have a look at my notebook, feel free to download and import it in your environment and play around with it-
我们需要有不同的库来加载数据集,可视化和建模。 我们将逐一检查并将它们安装在环境中。 您可以看一下我的笔记本,可以在您的环境中随意下载和导入它,并可以随意使用-
Jupyter Contrib Nbextensions (Jupyter Contrib Nbextensions)
We often need to share our notebook with different stakeholders or might need to present them, this library provides us a lot of different extensions. I will not go through the extensions here, but I recommend using this. My favorite ones are-
我们经常需要与不同的利益相关者共享我们的笔记本,或者可能需要展示他们,这个库为我们提供了许多不同的扩展。 我不会在这里进行扩展,但是我建议使用它。 我最喜欢的是-
- Collapsible headings. 可折叠的标题。
- Table of Contents. 目录。
- Execution Time. 执行时间处理时间。
You can install it using
您可以使用安装
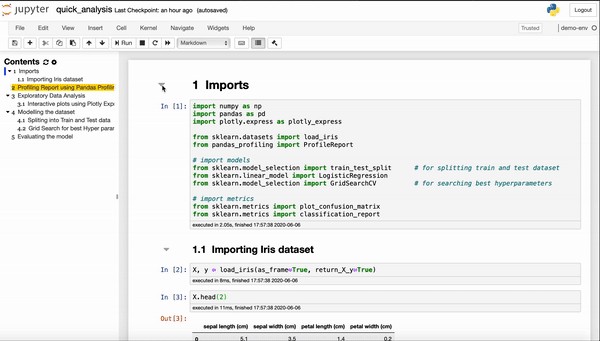
conda install -c conda-forge jupyter_contrib_nbextensionsHere is a short demo on how it can help-
这是一个简短的演示,介绍了如何帮助您-
熊猫-Python数据分析库 (Pandas- Python Data Analysis Library)
This is the heart of data science with python and provides many different capabilities like
这是python数据科学的核心,并提供许多不同的功能,例如
- Data structures to work with the data. 使用数据的数据结构。
- Operations you can perform on the data. 您可以对数据执行的操作。
- Load and save data in different formats. 加载和保存不同格式的数据。
and many more. Many other libraries we use for machine learning with python have pandas as a dependency. Install it using-
还有很多。 我们用于python机器学习的许多其他库都将pandas作为依赖项。 使用-安装它
conda install -c conda-forge pandasThe above command will install other libraries like NumPy which pandas uses under the hood.
上面的命令将安装其他库,例如Pandas在后台使用的NumPy。
斯克莱恩(Scikit-Learn) (Sklearn (Scikit-Learn))
We will use this library to download test datasets and apply different machine learning algorithms. Install using the following command.
我们将使用该库下载测试数据集并应用不同的机器学习算法。 使用以下命令进行安装。
conda install -c conda-forge scikit-learnIn machine learning classification problems, the problem can be understood as for X features (input variables) predict y (target value). Sklearn provides few test datasets which we can use to play with, we will take the IRIS dataset for this exercise but if you would like to play with others then you can refer to this.
在机器学习分类问题中,该问题可以理解为X特征(输入变量)预测y(目标值)。 Sklearn提供了一些可用于测试的测试数据集,我们将使用IRIS数据集进行此练习,但是如果您想与其他人一起玩,则可以参考此内容 。
Scikit-learn 0.23.1 added a feature by which we can return the test dataset directly into the X and y dataframe. Make sure you are running version 0.23.1.
Scikit-learn 0.23.1添加了一项功能,通过该功能,我们可以将测试数据集直接返回到X和y数据框中。 确保您正在运行0.23.1版。
from sklearn.datasets import load_iris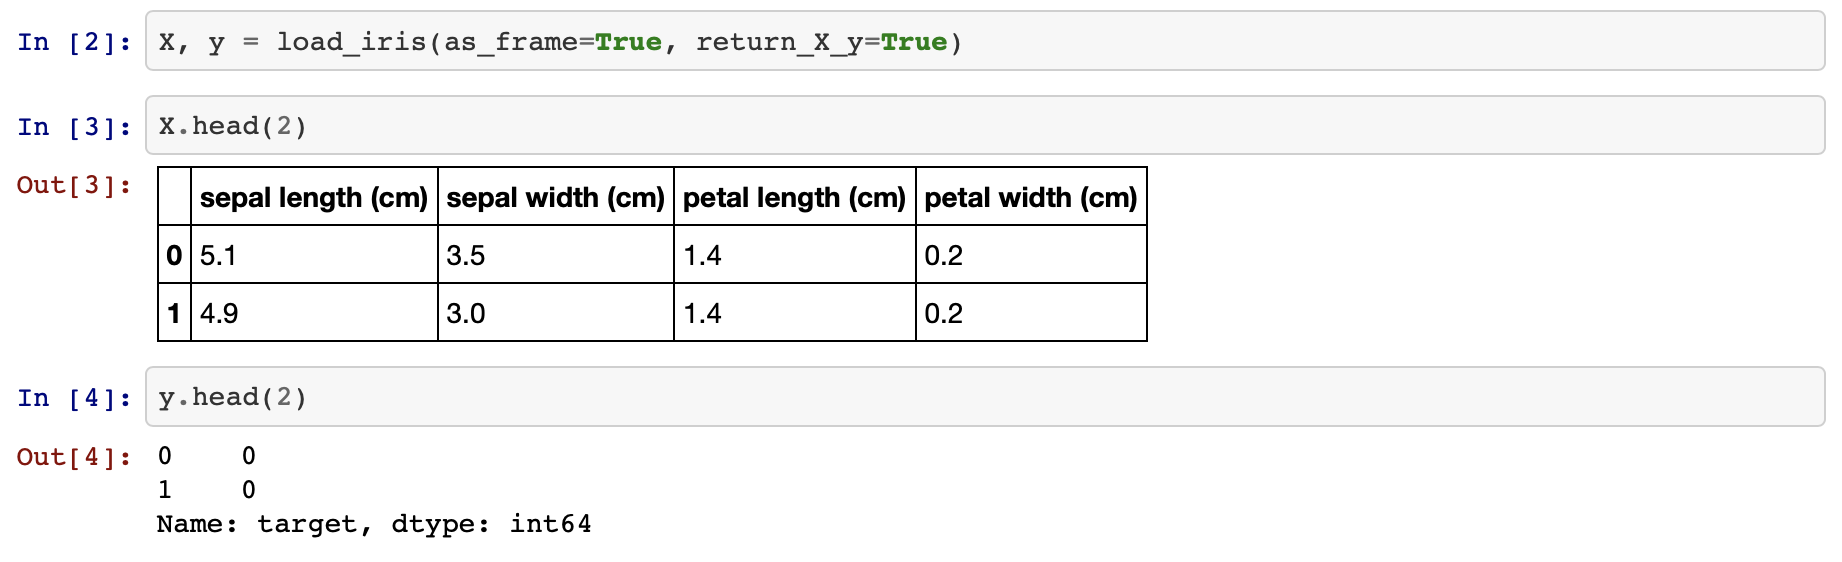
We will now go through the other libraries and we will use Sklearn for modeling later
现在,我们将介绍其他库,稍后将使用Sklearn进行建模
熊猫分析 (Pandas Profiling)
I am sure many of you would be aware of this library but if you are not please do give it a try. It provides a rich profiling report for the data which gives a lot of information from missing values to correlations. You need to install it using pip as conda-package downloads old version of it.
我敢肯定,你们中的许多人都会知道这个库,但是如果您不知道,请尝试一下。 它为数据提供了丰富的概要分析报告,该报告提供了从缺失值到相关性的大量信息。 您需要使用pip来安装它,因为conda-package会下载旧版本。
pip install --user pandas-profiling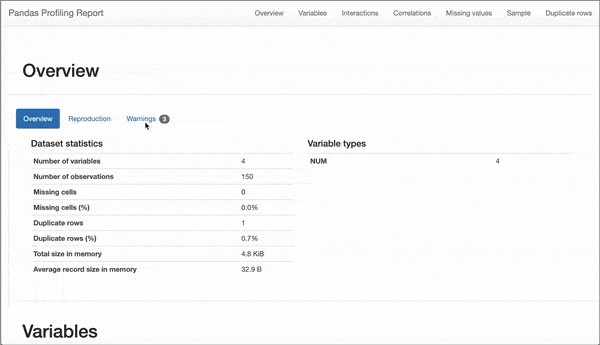
This report provides many details, out of which few are-
该报告提供了许多详细信息,其中很少是-
- Overview of different variables in the dataset. 数据集中不同变量的概述。
- Correlation between variables. 变量之间的相关性。
- Interactions between variables. 变量之间的相互作用。
- Details about each variable. 有关每个变量的详细信息。
The following commands can be used to generate and save the profile report-
以下命令可用于生成和保存配置文件报告-
情节快递 (Plotly Express)
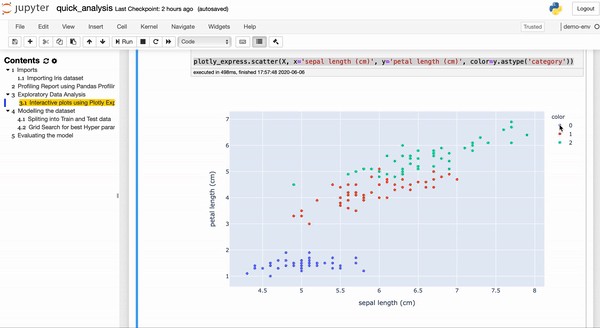
Although pandas-profiling provides a lot of useful information, we still need to visualize different information like for example we need to find how the target variable is distributed among multiple input variables. There exist many libraries for visualization, Matlplotlib and Seaborn are the famous ones you would have heard about. The main thing where Plotly stands out is the interactive plots i.e. you can interact with the generated plots. Install it using the following command
尽管pandas分析提供了许多有用的信息,但是我们仍然需要可视化不同的信息,例如我们需要找到目标变量如何在多个输入变量之间分配。 有许多可视化库,Matlplotlib和Seaborn是您会听说的著名库。 Plotly脱颖而出的主要功能是交互式绘图,即您可以与生成的绘图进行交互。 使用以下命令安装
conda install -c conda-forge plotlyBelow we plotted a scatter plot between sepal length with petal length and used ‘color’ to show how the target variable is related.
下面我们在萼片长度和花瓣长度之间绘制了散点图,并使用“颜色”显示了目标变量之间的关系。
You can see below how we can filter out different targets.
您可以在下面看到我们如何过滤出不同的目标。
This library provides a lot of additional functionality, maybe we can cover that in a different story.
该库提供了许多其他功能,也许我们可以在另一个故事中进行介绍。
培训和测试数据集 (Training and Test dataset)
The idea of generating models is to predict values that are not known. If we learn the model on the entire dataset then we will not be able to evaluate how it performs on the unseen data. To achieve this, we split the dataset into training and test dataset. A training dataset is used to train the model and the test set is used to evaluate the model. Sklearn provides a function ‘train_test_split’ which split the dataset into train and test datasets. The following code can be used to split the datasets.
生成模型的想法是预测未知的值。 如果我们在整个数据集上学习该模型,那么我们将无法评估该模型在看不见的数据上的表现。 为此,我们将数据集分为训练和测试数据集。 训练数据集用于训练模型,而测试集用于评估模型。 Sklearn提供了一个函数“ train_test_split”,可将数据集分为训练和测试数据集。 以下代码可用于拆分数据集。
from sklearn.model_selection import train_test_split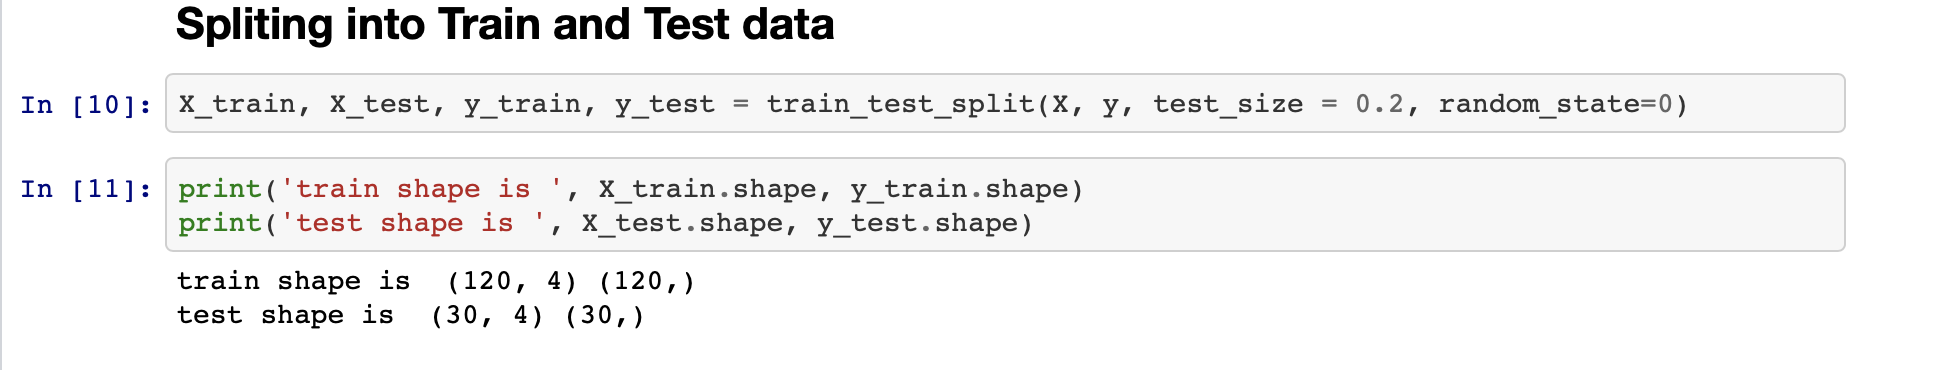
调整超参数 (Tuning Hyperparameters)
One of the important tasks in machine learning is to tune hyperparameters, these parameters are the different attributes of the algorithm which control the learning process. Different values are suitable for different learning problems and it is important to find out the best parameters. Sklearn provides mainly two ways ‘GridSearchCV’ and ‘RandomizedSearchCV’ to find the best parameters. For large training sets, we might need to use RandomizedSearchCV as it will take a lot of time to learn all parameters. In the IRIS dataset, we have only 150 rows and hence we used ‘GridSearchCV’.
机器学习的重要任务之一是调整超参数,这些参数是控制学习过程的算法的不同属性。 不同的值适用于不同的学习问题,因此找出最佳参数很重要。 Sklearn主要提供“ GridSearchCV”和“ RandomizedSearchCV”两种查找最佳参数的方法。 对于大型训练集,我们可能需要使用RandomizedSearchCV,因为它将花费大量时间来学习所有参数。 在IRIS数据集中,我们只有150行,因此我们使用了“ GridSearchCV”。
For this story, we will train the LogisticsRegression model which is well-suited for classification problems and have different hyperparameters like ‘solver’, ‘C’, ‘penalty’, and ‘l1-ratio’. Not every solver supports all parameters and hence we create different dictionaries for all different solvers.
对于这个故事,我们将训练物流回归模型,该模型非常适合分类问题,并且具有不同的超参数,例如“求解器”,“ C”,“罚分”和“ l1-比率”。 并非每个求解器都支持所有参数,因此我们为所有不同的求解器创建不同的字典。
The above code would search for different combinations of parameters and find the best one which best generalizes the problem.
上面的代码将搜索参数的不同组合,并找到最能概括该问题的最佳组合。
评估模型 (Evaluating the model)
As we mentioned, we need to evaluate the model on the test dataset, many different metrics are available. The common one is accuracy for classification problems. Here we will show the accuracy, classification_report, and confusion matrix which Sklearn provides.
如前所述,我们需要在测试数据集上评估模型,可以使用许多不同的指标。 常见的一种是分类问题的准确性。 在这里,我们将显示Sklearn提供的准确性,classification_report和混淆矩阵。
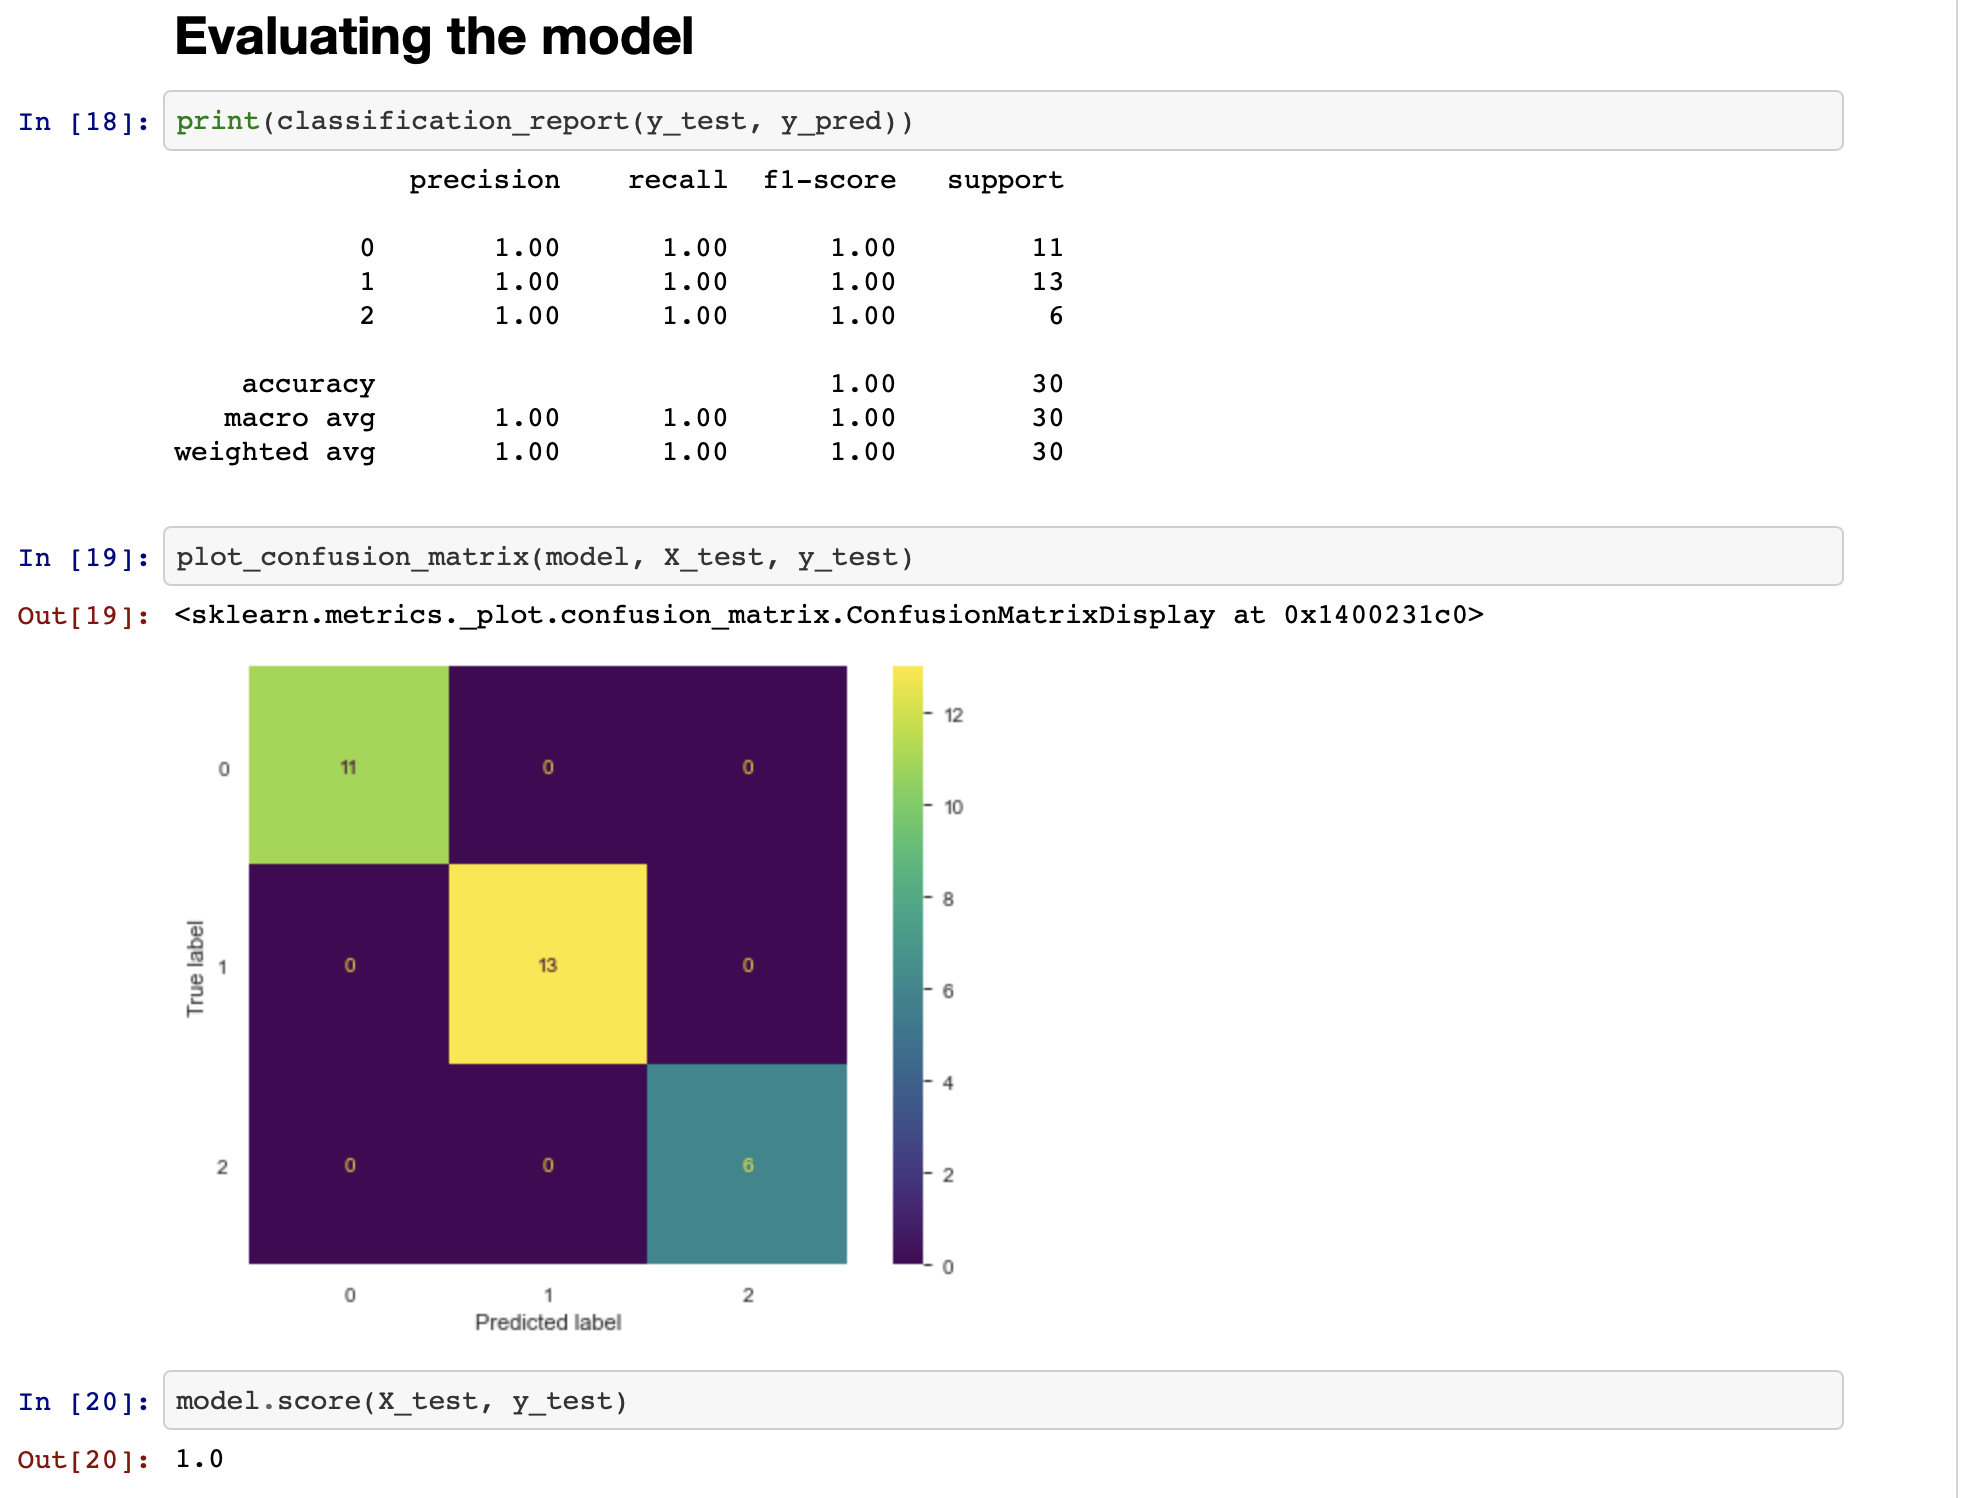
The IRIS dataset is classified as an easy dataset which means data is already suitable for machine learning purposes and hence we were able to get a perfect score i.e. accuracy score of 1.0 with our model. This means our model predicted all the samples in the test dataset correctly. It will vary with the different problems you are trying to solve.
IRIS数据集被归类为简单数据集,这意味着数据已经适合于机器学习目的,因此我们能够获得理想的评分,即模型的准确性评分为1.0。 这意味着我们的模型可以正确预测测试数据集中的所有样本。 您要解决的不同问题会有所不同。
结论 (Conclusion)
The idea of this story was to give you a head start on machine learning and a glimpse of different libraries that you can utilize to speed up the process. I provided a simple overview of many things to keep this story short and precise. There is still a lot to explore such as different types of machine learning problems, different models, different metrics, and where to use them. You can try different things, in the same way, I did here so that you can see how it works. I will try to add more stories to give you deep dive into specific areas to help accelerate your learning.
这个故事的目的是让您抢先学习机器学习,并瞥见可以用来加速过程的各种库。 为了使这个故事简短而准确,我提供了许多内容的简单概述。 还有很多需要探索的东西,例如不同类型的机器学习问题,不同的模型,不同的度量标准以及在何处使用它们。 您可以用相同的方法尝试不同的事情,我在这里做了,所以您可以了解它的工作原理。 我将尝试添加更多故事,以使您深入了解特定领域,以帮助您加速学习。
Update 16th June 2020: Recently I found a way to combine Sklearn Pipeline with GridSearchCV to search for best preprocessing steps. If interested, check out this- Are you using Pipeline in Scikit-Learn?
2020年6月16日更新 :最近,我找到了一种将Sklearn Pipeline与GridSearchCV结合以搜索最佳预处理步骤的方法。 如果有兴趣,请查看此- 您是否在Scikit-Learn中使用管道?
翻译自: https://medium.com/swlh/start-your-data-science-journey-today-37366ee463f
大数据技术 学习之旅


 1917
1917


 被折叠的 条评论
为什么被折叠?
被折叠的 条评论
为什么被折叠?
 到【灌水乐园】发言


