


python处理自然语言
How a company can better understand the consumer’s perception of its products, in order to improve them?
公司如何才能更好地了解消费者对其产品的看法,以便对其进行改进?
Marketing consulting companies or inside teams have been analyzing consumer’s perceptions to understand how to make improvements on its products, branding, and marketing campaigns. But the traditional methods for addressing this used to be in-dept interviews or surveys, which often don’t follow the statistical sampling techniques and require resources for data collection.
营销咨询公司或内部团队一直在分析消费者的看法,以了解如何改进其产品,品牌和营销活动。 但是解决此问题的传统方法曾经是专访或访谈,通常不遵循统计抽样技术,并且需要资源来收集数据。
In the era of social networks, we produce vasts amounts of data on a daily basis. The company’s Facebook page, for example, can serve as a valuable resource for collecting comments, inbox messages, and reactions. Other sources of data are reviews and evaluations of consumers in e-commerce platforms like Amazon and Lowe’s. Here I’m going to present how one can use Python and Natural Language Processing (NLP) to analyze text data and get insights from these reviews.
在社交网络时代,我们每天都会产生大量数据。 例如,该公司的Facebook页面可以用作收集评论,收件箱消息和React的宝贵资源。 其他数据来源是在电子商务平台(如Amazon和Lowe's)中对消费者的评论和评估。 在这里,我将介绍如何使用Python和自然语言处理(NLP)来分析文本数据并从这些评论中获得见解。
Down below, we can see the data set used for example, which consists of 20473 consumer reviews from different retailers and products (mainly refrigerators). The goal is to (1) extract words within a text that encode a characteristic of products functioning, structure, or the purchase process; (2) identify what is being said in the sale’s channel ; (3) explore this information to generate insights — for example, which features are most related to positive reviews? and finally, (4) generate data visualizations to communicate the results.
在下方,我们可以看到例如使用的数据集,其中包括来自不同零售商和产品(主要是冰箱)的20473条消费者评论。 目的是(1)在文本中提取编码产品功能,结构或购买过程特征的单词; (2)识别销售渠道中所说的内容; (3)探索这些信息以产生见解-例如,哪些功能与正面评价最相关? 最后,(4)生成数据可视化以传达结果。
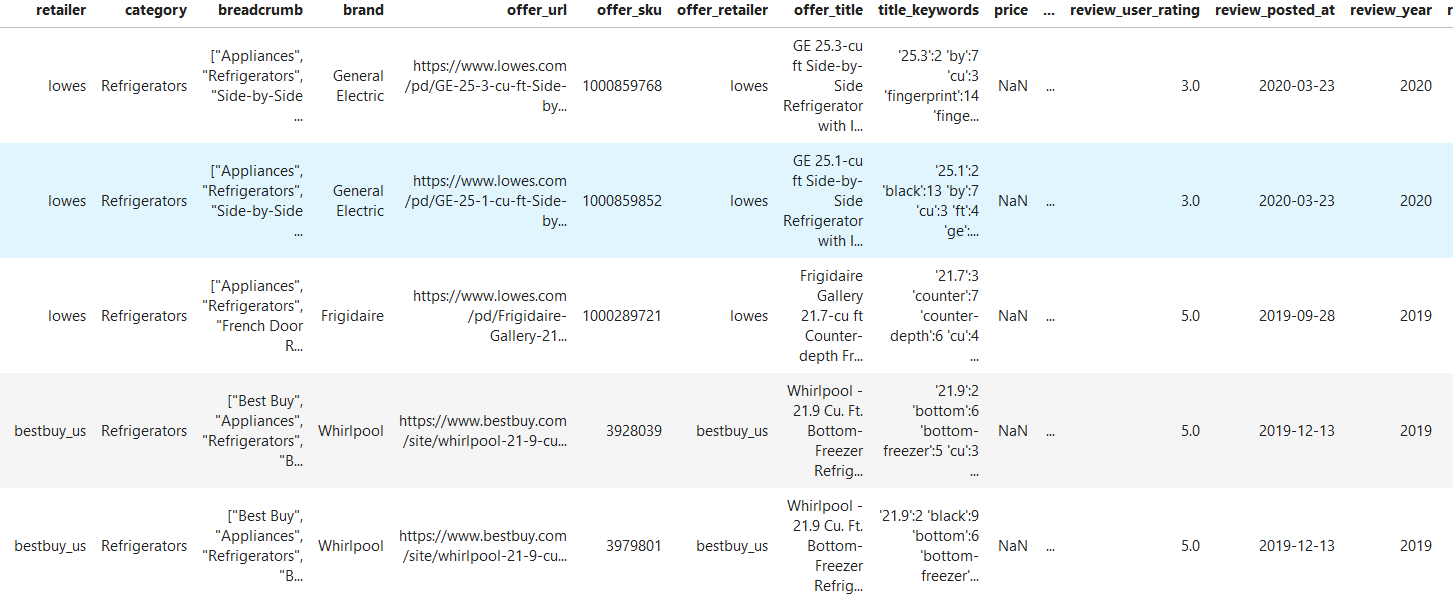
Exploring which attributes (columns) we are going to use, one can see that we have useful information like a retailer, category, brand, review user rating, and the text review itself. Therefore we can think of the steps needed to achieve our goals:
在探索我们将要使用的属性(列)时,可以看到我们具有有用的信息,例如零售商,类别,品牌,评论用户评分以及文本评论本身。 因此,我们可以考虑实现目标所需的步骤:
A. Preprocessing and Exploratory Analysis: (1) clean and tokenize text; (2) count total words to identify features as most common nouns; (3) create a binary valuation of the product (good/bad). B. Sentiment Analysis: (1) Identify valuable features to explore; (2) word cloud visualization for most frequent adjectives near a feature; (3) sentiment for a feature in time.
A.预处理和探索性分析:(1)清理并标记化文本; (2)计算单词总数以将特征识别为最常见的名词; (3)对产品进行二元评估(好/坏)。 B.情感分析:(1)找出有价值的特征进行探索; (2)词云可视化功能最常见的形容词; (3)对于某功能的情绪及时。
预处理和探索性分析 (Preprocessing and Exploratory Analysis)
First, we import the libraries and NLTK models. If you don’t have one of these libraries, you can use pip install library in the terminal to install it. Attention to the use of the NLTK package for natural language processing, pandas for data manipulation and plotly and cufflinks for data visualization.
首先,我们导入库和NLTK模型。 如果您没有这些库之一,则可以在终端中使用pip install库进行安装。 注意将NLTK软件包用于自然语言处理,将熊猫用于数据处理和绘图以及将袖扣用于数据可视化。
# import packages
import pandas as pd
import nltk
from wordcloud import WordCloud
import matplotlib.pyplot as plt
import plotly.graph_objs as go
import plotly.graph_objs as go
import plotly.offline as py
from plotly.offline import download_plotlyjs, init_notebook_mode, plot, iplot
import cufflinks as cf
from plotnine import *


# download nltk models (only 1st time)
nltk.download('punkt')
nltk.download('averaged_perceptron_tagger')
An initial procedure is to identify duplicated reviews based on the review_id columns and remove them. 69% of data were duplicated, which is a high number and should be verified with the responsible team that collected this data from the websites.
初始过程是根据review_id列标识重复的评论并将其删除。 69%的数据被重复,这是一个很高的数字,应与负责从网站收集此数据的负责团队核实。
# count % of duplicated reviews
print(round(sum(data.duplicated('review_id'))/len(data)*100, 2),'% duplicated')


# remove duplicated reviews
data = data.drop_duplicates('review_id')
After importing and exploring, we can preprocess the comments and put the words in lower case, remove numbers, remove stopwords (connectives) and apply the lemmatization algorithm for word standardization. This process standardizes our text in order to make feature extraction more efficient, so we make “Enjoyable” and “Enjoy” goes to “enjoy”, for example.
导入和浏览后,我们可以对注释进行预处理,并将单词小写,删除数字,删除停用词(连接词)并应用词形化算法进行单词标准化。 此过程使我们的文本标准化,以使特征提取更加高效,因此我们将“ Enjoyable”和“ Enjoy”改为“ enjoy”。
def cleanTextToken(text, tokenization = True):
    ''' standardize text to extract words
    '''
    # text to lowercase
    text = text.lower()
    # remove numbers
    text = ''.join([i for i in text if not i.isdigit()])
    # remove punctuation
    from nltk.tokenize import RegexpTokenizer
    tokenizer = RegexpTokenizer(r'\w+') # preserve words and alphanumeric
    text = tokenizer.tokenize(text)
    # remove stopwords
    from nltk.corpus import stopwords
    stop = set(stopwords.words('english'))
    text = [w for w in text if not w in stop]
    # lemmatization
    from nltk.stem import WordNetLemmatizer
    lemmatizer = WordNetLemmatizer()
    text = [lemmatizer.lemmatize(word) for word in text]
    # return clean token
    return(text)

 # generate variable with preprocessed text
data['review_body_token'] = [cleanTextToken(text) for text in data['review_body']]
Now we can count the words in the reviews and identify the word class (noun, adjective, verb, adverb, etc.). With this step, we will be able to identify relevant features expressed in nouns.
现在我们可以对评论中的单词进行计数并识别单词类别(名词,形容词,动词,副词等)。 通过这一步骤,我们将能够识别以名词表达的相关特征。
def wordCount(txt_list):
    ''' count frequency of words in tokenized list
        and save in dataframe
    '''
    wordfreq = {'word':[],'freq':[]}
    for word in txt_list:
        if word not in wordfreq['word']:
            wordfreq['word'].append(word)                   # save word
            wordfreq['freq'].append(txt_list.count(word))   # save freq
    count = pd.DataFrame(wordfreq)
    # sort_values in df
    count.sort_values('freq', inplace=True, ascending=False)
    return count

# combine all words in reviews
all_tokens = []
for comment in data['review_body_token']:
    for word in comment:
        all_tokens.append(word)

# count words in reviews
all_count = wordCount(all_tokens)


# identify grammar class for words in all_count
all_count['category'] = [nltk.pos_tag([word])[0][1] for word in all_count['word'] ]


# view most commom words
all_count[0:20]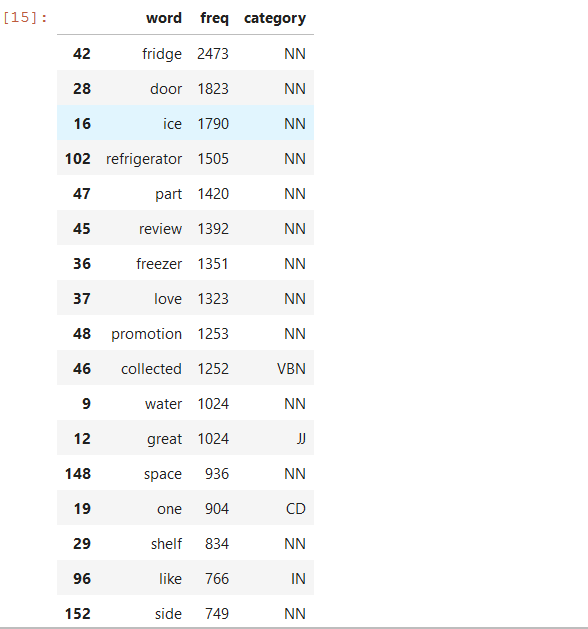
Here we can see relevant features like fridge, door, ice, refrigerator, water, space, and others. The next step then is to explore which sentiments are linked to these features.
在这里,我们可以看到相关功能,例如冰箱,门,冰,冰箱,水,空间等。 然后,下一步就是探索哪些情感与这些功能相关。
情绪分析 (Sentiment Analysis)
To perform the sentiment analysis, I’ve made a list of the relevant features observed in the previous analysis. We will use this list to create other attributes in the data set: (1) one that identifies if there is a relevant feature on each review; (2) a column with the adjectives (sentiments) and; (3) an attribute that tells us if the review was positive (≥4 stars ) or negative (<4 stars).
为了进行情感分析,我列出了先前分析中观察到的相关功能。 我们将使用此列表在数据集中创建其他属性:(1)用于标识每个评论是否具有相关功能的属性; (2)包含形容词(情感)的列;以及(3)告诉我们评论是正面(≥4星)还是负面(<4星)的属性。
features = ['door',
            'ice',
            'refrigerator',
            'freezer',
            'water',
            'space',
            'dispenser',
            'time',
            'size',
            'light',
            'temperature',
            'noise']


def wordsInRow(words, token_row):
    ''' indentify if words is in list of tokens,
        return list with words intersected
    '''
    new_row = []
    for word in words:
        if word in token_row:
            new_row.append(word)
    return new_row

# get features present in review
data['review_aspects'] = data['review_body_token'].apply(lambda row: wordsInRow(features, row))


# get adjectives in review
adjectives = list(all_count['word'][all_count['category'] == 'JJ'])
data['review_adjectives'] = data['review_body_token'].apply(lambda row: wordsInRow(adjectives, row))


# review user binary classification
data['review_classification'] = [1 if x >= 4 else -1 for x in data['review_user_rating']]


# reset index
data.reset_index(inplace=True)
It is now possible to perform a search for words and adjectives close to the features to understand what people are saying about each aspect. I also highlight that this process could be driven to a specific brand or product just by implementing a simple filter and comparing your brand with other brands, but for educational purposes, we include every brand in this analysis.
现在,可以搜索功能附近的单词和形容词,以了解人们对每个方面的看法。 我还强调指出,仅通过实施简单的过滤器并将您的品牌与其他品牌进行比较,就可以将此过程驱动到特定品牌或产品,但是出于教育目的,我们在此分析中包括了每个品牌。
Here I coded three different strategies of analysis to aggregate the text near the feature that we are looking for, so in the next step, the counting is on the text extracted. We can identify all words in the feature review (ruleAll), the words right next to the feature word (ruleNext), or near the feature by 3 words of distance from the feature (ruleNear).
在这里,我编码了三种不同的分析策略,以将文本聚集在我们要寻找的特征附近,因此在下一步中,对提取的文本进行计数。 我们可以识别特征评论中的所有单词(ruleAll),特征单词旁边的单词(ruleNext)或特征附近距特征3个单词的距离(ruleNear)。
def ruledSentimentTextAgg(token_list, category, rule='near'):
    ''' aggregate text in token list based on rules:
        all - agg all tokens in list
        next - agg tokens next to the word
        near - agg tokens 3 words far from category word
     '''
    text = ''
    for i in range(len(token_list)):
        if category in token_list[i]:
            row = token_list[i]
            cat_index = row.index(category)
            if rule == 'all':
                text = ruleAll(text, row)
            if rule == 'next':
                text = ruleNext(text, cat_index, row)
            if rule == 'near':
                text = ruleNear(text, cat_index, row)
    return text


def ruleAll(text, row):
    for word in row:
        text = text + word + ' '
    return text


def ruleNext(text, cat_index, row):
    if cat_index > 0:
        text += row[cat_index-1] + ' '
    if cat_index < (len(row)-1):
        text += row[cat_index+1] + ' '
    return text

def ruleNear(text, cat_index, row):
    count_id = 0
    while count_id < 3:
        try:
            word = row[cat_index+count_id]
            if nltk.pos_tag([word])[0][1] == 'JJ':
                text += word + ' '
        except:
            pass
        count_id += 1
    count_id = 0
    while count_id > -3:
        try:
            word = row[cat_index+count_id]
            if nltk.pos_tag([word])[0][1] == 'JJ':
                text += word + ' '
        except:
            pass
        count_id -= 1
    return text
Finally, we code the wordcloud visualization, which counts the words in a text string, which is returned by the previous search algorithm.
最后,我们对wordcloud可视化进行编码,该可视化将对文本字符串中的单词进行计数,该字符串由先前的搜索算法返回。
def wordcloudVisualization(text, max_words):
    ''' generate wordcloud plot based on text entry
    '''
    %matplotlib inline
    from wordcloud import WordCloud
    import matplotlib.pyplot as plt
    wordcloud = WordCloud(max_font_size=50, max_words=max_words, background_color="white").generate(text)
    plt.figure()
    plt.imshow(wordcloud, interpolation="bilinear")
    plt.axis("off")
    plt.show()

def aspectSentimentWordcloud(data, classification, aspect, max_words, rule='near'):
  ''' execute the sentiment wordcloud analysis,
      filter classification positive (1) or negative (-1),
      combine ruledSentimentTextAgg and wordcloudVisualization
  '''
  data_posi = data[data['review_classification'] == classification].reset_index()
  text = ruledSentimentTextAgg(data_posi['review_body_token'], aspect, rule)
  wordcloudVisualization(text, max_words)
And now we can visualize the results:
现在我们可以可视化结果:
# words next to 'ice'
aspectSentimentWordcloud(data, classification=1, aspect='ice', max_words=10, rule='next')


# positive sentiment near 'ice'
aspectSentimentWordcloud(data, classification=1, aspect='ice', max_words=10, rule='next')


# negative sentiment near 'ice'
aspectSentimentWordcloud(data, classification=-1, aspect='ice', max_words=10, rule='next')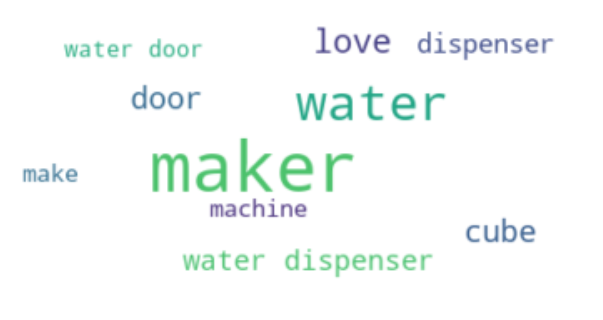
The first comes from exploring the words next to the feature ice, which leads to the words maker, machine, and dispenser, indicating that many reviews are related to this aspect of the refrigerators.
首先来自探索功能冰旁边的单词,该单词指向maker , machine和分配器,这表明许多评论都与冰箱的这一方面有关。
A more in-depth analysis is to identify negative and positive sentiments related to the word ‘ice’ so we can get insights from the consumer’s perception of the ice makers. The left wordcloud below is based on the words close to the feature ice in positive reviews, in which relevant adjectives such as easy, big, spacious, large are observed, which denote a consumer interest for a large ice maker.
更深入的分析是识别与“冰”一词相关的消极和积极情绪,以便我们从消费者对制冰机的理解中获得洞察。 下面的左词云是基于在正面评论中靠近特征冰的词,其中观察到了诸如形容词“容易” ,“大”,“宽敞”,“大”之类的相关形容词,表示消费者对大型制冰机的兴趣。
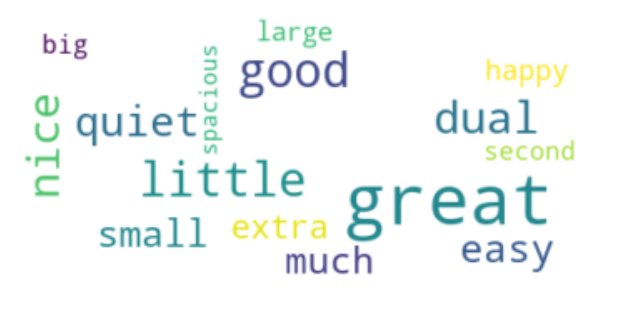
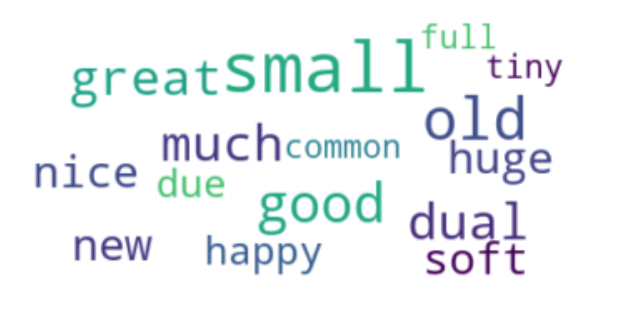
The right wordcloud captures words close to ice in negative reviews, here we can see the highlight of the adjectives small and tiny, that reinforces the interest of consumers on a large ice producer, but not too big since we find huge as a bad review for ice.
右wordcloud捕获的话接近负面评论冰,在这里我们可以看到形容词小和微小的亮点,从而加强消费者对一个大冰生产者的利益,但不能太大,因为我们发现巨大的坏审查冰。
At the same time, it is also possible to see positive sentiments related to ice in bad reviews, like good and great, which suggests that even in negative reviews people can still indicate a good feature of the product.
同时,也有可能在不好的评论中看到与冰有关的正面情绪,例如好和好,这表明即使在负面评论中,人们仍然可以表明产品的良好功能。
This same model can be replicated for any other feature just by changing the ‘aspect’ in the function aspectSentimentWordcloud().
只需更改功能AspectSentimentWordcloud()中的“方面”,就可以为任何其他功能复制相同的模型。
时间序列情感分析(Times Series Sentiment Analysis)
As we saw in the beginning, there is date information in the data set that can be used to give us insights about the distribution of positive reviews for a specific brand, product, or feature. Here I show the code to count positive reviews by date, and visualize it using plotly interactive plots.
正如我们在一开始所看到的,数据集中存在日期信息,可用于为我们提供有关特定品牌,产品或功能的正面评论分布的见解。 在这里,我展示了按日期对正面评论进行计数的代码,并使用绘图交互式绘图将其可视化。
# transform day/month/year to week/month/year
data['date_month'] = pd.to_datetime(data['review_year'], format='%Y') + \
             pd.to_timedelta(data['review_week'].mul(7).astype(str) + ' days')


def aspectTimesSeries(df, token_column, aspect):
    ''' preprocess times series data for a specific category (feature/aspect)
        in a column (token_column), generating positive porcent of reviews by week
    '''
    # select aspect data
    data = df[df[token_column].apply(lambda x: aspect in x)]
    # crate dict to append results
    timeseries_positive = {'date':[],'positive_percent':[]}
    # loop through weks
    data['date_month'].unique()
    for date in data['date_month'].unique():
        # select date
        date_data = data[data['date_month'] == date]
        # calculate percent of positive reviews
        date_count = pd.DataFrame(date_data[['review_classification']].groupby('review_classification').size()).reset_index()
        date_count.columns=['review_classification', 'freq']
        date_count['percent'] = round(date_count['freq'] / sum(date_count['freq'] ) *100, 2)
        value = date_count['percent'][date_count['review_classification'] == 1]
        try:
            value = float(value)
        except:
            value = 0
        # save in dict
        timeseries_positive['positive_percent'].append(value)
        timeseries_positive['date'].append(date)
    # return df
    timeseries_positive = pd.DataFrame(timeseries_positive).sort_values('date')
    return timeseries_positive

def layoutLine(min, max):
  ''' define layout of line plot
      based on min and max entries for y axis
  '''
  import plotly.graph_objs as go
  layout = go.Layout( {'legend': {'bgcolor': '#F5F6F9', 'font': {'color': '#4D5663'}},
                 'paper_bgcolor': '#F5F6F9', 'plot_bgcolor': '#F5F6F9',
                 'title': {'font': {'color': '#4D5663'}},
                 'xaxis': {'gridcolor': '#E1E5ED', 'showgrid': True, 'tickfont': {'color': '#4D5663'},
                           'title': {'font': {'color': '#4D5663'}, 'text': ''}, 'zerolinecolor': '#E1E5ED'},
                 'yaxis': {'gridcolor': '#E1E5ED', 'range' : (min, max),'showgrid': True, 'tickfont': {'color': '#4D5663'},
                           'title': {'font': {'color': '#4D5663'}, 'text': ''}, 'zerolinecolor': '#E1E5ED'}})
  return layout


def timesSeriesVisualization(data, bestfit=True):
    ''' execute plotly timeseries visualization
        based on date and positive percentage of reviews
        and generate regression line
    '''
    # modules
    import plotly.graph_objs as go
    import plotly.offline as py
    from plotly.offline import download_plotlyjs, init_notebook_mode, plot, iplot
    import cufflinks as cf
    # set notebook and offline config
    %matplotlib inline
    init_notebook_mode(connected=True)
    cf.go_offline()
    # layout
    layout = layoutLine(0, 100)
    # visualization
    data.iplot(x = 'date',
               y='positive_percent' ,
               mode='lines+markers',
               size = 8,
               bestfit=bestfit,
               colors=['#87cded'],
               bestfit_colors=['pink'],
               layout=layout.to_plotly_json(),
               filename='test')

# generate times series visualization for feature 'ice'
date_eval2 = aspectTimesSeries(data, token_column='review_aspects',aspect= 'ice')
timesSeriesVisualization(date_eval2)
In the plot generated we can see that there is no clear long-term trend, as there is almost no variation in the regression line (trace1). Nevertheless, there are expressive variations in the positive percent line itself, like from September to October 2019, when we observe a downside to almost only 60% of positive reviews, followed by a boost in positive reviews that reaches 90%. This analysis can inform the consumer’s perception of a product that was launched during this period.
在生成的图中,我们可以看到没有明确的长期趋势,因为回归线(trace1)几乎没有变化。 但是,正百分比线本身也存在表达差异,例如从2019年9月到2019年10月,当我们观察到 正面评价几乎只有60%下降,其次正面评价则达到90%。 这个分析 可以告知消费者对该期间推出的产品的看法。
结论(Conclusion)
In this article, I wanted to show how an analyst or data scientist can use Python tools to process, analyze, and visualize text data to get insights from the consumer’s perception.
在本文中,我想展示分析师或数据科学家如何使用Python工具来处理,分析和可视化文本数据,以从消费者的感知中获得见解。
The usage of these tools can not only reduce the costs of collecting data but also get trends and ideas that are spontaneous, once the source is large amounts of reviews and comments from satisfied or unsatisfied consumers and not closed questions from a survey.
这些工具的使用不仅可以减少收集数据的成本,而且可以获得自发的趋势和想法,一旦来源是来自满意或不满意的消费者的大量评论和评论,而不是调查中未解决的问题。
One can also use it for analyzing open questions in surveys or in-depth interviews. Although the amount of data may be not that large as it is in online platforms.
人们还可以使用它来分析调查或深入访谈中的未解决问题。 尽管数据量可能不如在线平台中的数据量大。
I express my gratitude to Birdie for the data set. For data access and view the complete project, you can visit https://github.com/claudioalvesmonteiro/nlp_birdie
我对Birdie的数据集表示感谢。 要访问数据并查看完整的项目,可以访问https://github.com/claudioalvesmonteiro/nlp_birdie
python处理自然语言


 3465
3465

 被折叠的 条评论
为什么被折叠?
被折叠的 条评论
为什么被折叠?
 到【灌水乐园】发言


