


什么是确定性? (What is Ascertainment?)
Under-reporting of COVID-19 cases is one of the biggest obstacles to effectively dealing with the pandemic.¹ Two main factors are responsible for this issue, the first being a lack of available testing and the second being the possibility of pre-symptomatic and asymptomatic transmission. These factors make it hard to determine the level of ascertainment (the number of recorded cases divided by the true number of cases). This interferes with the ability to understand the true size of the pandemic and introduce non-pharmaceutical interventions appropriately.²
未能充分报告COVID-19病例是有效应对这种大流行的最大障碍之一。 ¹造成此问题的主要原因有两个,第一个是缺乏可用的测试 ,第二个是有症状和无症状传播的可能性。 这些因素使得难以确定查明水平(已记录病例数除以真实病例数)。 这会干扰了解大流行病真实规模并适当引入非药物干预措施的能力。 ²
Since it’s difficult to immediately solve the issue of under-reporting by eliminating its causes, estimating its effects is a priority. There are numerous established approaches to estimating under-ascertainment of infectious diseases, including community-based studies, returning traveler studies, and capture-recapture studies,³ but we’re particularly interested in mathematical modeling approaches.
由于很难通过消除其原因立即解决举报不足的问题,因此,评估其影响是当务之急。 有许多确定的方法来估计传染病的不确定性,包括基于社区的研究,回国旅客研究和捕获再捕获研究, ³但是我们对数学建模方法特别感兴趣。
What this means for our risk engine at Track My Exposure is that the risk of getting COVID-19 is higher than it might seem at first. There are asymptomatic carriers in our communities who don’t know they have COVID-19 but can still transmit it to other people. Our risk engine is made more accurate by factoring in the ascertainment rate. In this article, we’ll explain two approaches to determining the county-level ascertainment rate and reveal how they inspire the methodology that we use for our risk engine.
这对我们在Track My Exposure中的风险引擎来说意味着获得COVID-19的风险比起初看起来要高。 我们社区中有无症状的携带者,他们不知道自己有COVID-19,但仍然可以将其传播给其他人。 通过考虑确定率,我们的风险引擎变得更加准确。 在本文中,我们将解释确定县级确定率的两种方法,并揭示它们如何激发我们用于风险引擎的方法。
方法1:使用病死率计算查明率 (Approach 1: Using the Case Fatality Ratio to Calculate Ascertainment)
The first approach applies the novel methodology used by researchers at the Centre for the Mathematical Modeling of Infectious Diseases to counties. Previous modeling approaches have factored in characteristics such as unemployment, urbanization, and population density,⁴ but the method in this paper relies on the case fatality ratio (CFR), which is the ratio of the number of deaths to the number of cases. First, the CFR needs to be adjusted for infection-to-death delay.
第一种方法是将传染病数学模型中心研究人员所使用的新颖方法应用于县。 先前建模的方法已经在因素特性,如失业,城市化和人口密度,但⁴本文的方法依赖于病死率 (CFR),它是死亡的病例数的数目的比率。 首先,需要根据病死率的延迟来调整病死率。
Dividing the number of cases by the number of deaths to date leads to a crude estimate of the CFR. It should answer the question, “What proportion of all cases are fatal?” On any given day, there are some cases that are resolved, or have either resulted in recovery or death, and there are others that are unresolved. These unresolved cases skew the CFR to be lower than it should be because the crude ratio counts cases that may eventually result in deaths. Since the distribution of the time from infection to death has been previously established, we can account for delay by estimating how many cases to date have run their course.
用病例数除以迄今为止的死亡数可以得出对病死率的粗略估计。 它应回答以下问题:“在所有病例中有多少是致命的?” 在任何一天,都有一些案件已经解决,或者导致康复或死亡,还有一些案件尚未解决。 这些未解决的案件使CFR偏向低于应有的比率,因为原始比率计算可能最终导致死亡的案件。 由于已经确定了从感染到死亡的时间分布,因此我们可以通过估计迄今为止有多少例病例来解决延迟问题。
The next step is to compare this delay-adjusted CFR to a baseline that’s adjusted for under-reporting. Assuming almost all deaths are reported, this comparison will reveal the proportion of all cases that are reported. Based on the results of a study done by researchers at the MRC Centre for Global Infectious Disease Analysis and the Jameel Institute for Disease and Emergency Analytics, we use 1.4% as the baseline CFR. Then, to determine the fraction of cases that are reported, we simply divide the baseline CFR by the delay-adjusted CFR for the region in question. For example, if the delay-adjusted CFR for a region is 20%, we can estimate that only 1.4/20 = 7% of cases in that region are actually reported. Additionally, the ascertainment rate fluctuates from day to day. Therefore, we calculate the delay-adjusted CFR for each day in each region.
下一步是将延迟调整后的CFR与针对报告不足而调整的基准进行比较。 假设几乎所有死亡病例均已报告,则该比较将揭示所有报告病例中所占的比例。 根据结果的研究 ,研究人员在做MRC中心全球传染病分析和贾米尔研究所疾病和紧急分析 ,我们用1.4%作为基准CFR。 然后,为了确定所报告病例的比例,我们只需将基线CFR除以所讨论区域的延迟调整CFR。 例如,如果某个区域的经延迟调整的CFR为20%,我们可以估计该区域实际报告的病例只有1.4 / 20 = 7%。 另外,确定率每天都在波动。 因此,我们计算每个区域每天的延迟调整CFR。
There are some limitations to this method. While convenient, the baseline-adjusted CFR does not capture differences in demographics and healthcare between regions. The method also assumes that deviations from the baseline are solely due to under-ascertainment instead of, for instance, the misattribution of deaths to reasons other than COVID-19. We can clearly improve upon the first method in terms of accuracy.
此方法有一些限制。 虽然方便,但基线调整后的病死率并未反映出地区之间人口统计学和医疗保健方面的差异。 该方法还假定与基线的偏差仅是由于不确定性造成的,而不是例如由于COVID-19以外的其他原因导致的死亡归因。 我们可以在准确性方面明显改进第一种方法。
方法2:使用人口分布来计算确定性 (Approach 2: Using Population Distributions to Calculate Ascertainment)
Remember that study we mentioned earlier that gave us an estimate for the adjusted baseline CFR? Let’s take a closer look at that for more insight into how it accounts for under-reporting in the first place.
还记得我们之前提到的研究为我们提供了调整后的基准CFR的估算值吗? 让我们仔细研究一下,以便更深入地了解它是如何解决报告不足的原因的。
This study utilizes the assumption that COVID-19 has a uniform attack rate across all age groups. This means that, all else being equal, people of varying ages are equally likely to get COVID-19. This assumption is consistent with other infectious respiratory diseases.⁵ (Of course, the outcomes of COVID-19 infection vary significantly between different age groups.) Based on this assumption, the age distribution of a population should be the same as the age distribution of its COVID-19 patients. Using Missouri as an example, we can compare a state’s overall population distribution with the distribution of its COVID-19 cases:
这项研究利用了这样的假设,即COVID-19在所有年龄段的人群中都有统一的发病率。 这意味着,在其他所有条件相同的情况下,不同年龄的人也有可能获得COVID-19。 该假设与其他传染性呼吸道疾病一致。 ⁵ ( 当然,COVID-19感染的结果在不同年龄组之间差异很大。 )基于此假设,人群的年龄分布应与其COVID-19患者的年龄分布相同。 以密苏里州为例,我们可以将一个州的总体人口分布与其COVID-19病例的分布进行比较:
Theoretically, these two distributions should be identical, but the fact that they’re not tells us that under-reporting is present. For instance, under-reporting is more common in children than in elderly people because complications and symptoms in children tend to be more mild and therefore less likely to be reported.
从理论上讲,这两个分布应该是相同的,但是它们没有告诉我们存在报告不足的事实。 例如,少报儿童在儿童中要比老年人多见,因为儿童的并发症和症状往往较轻 ,因此不太可能被报道。
Next, we observe which of the age groups has the highest number of reported cases relative to its population. Let’s take a look at Missouri’s COVID-19 cases per capita for each age group:
接下来,我们观察相对于其人口,哪个年龄组的报告病例数最高。 让我们看一下每个年龄段的密苏里州人均COVID-19病例:
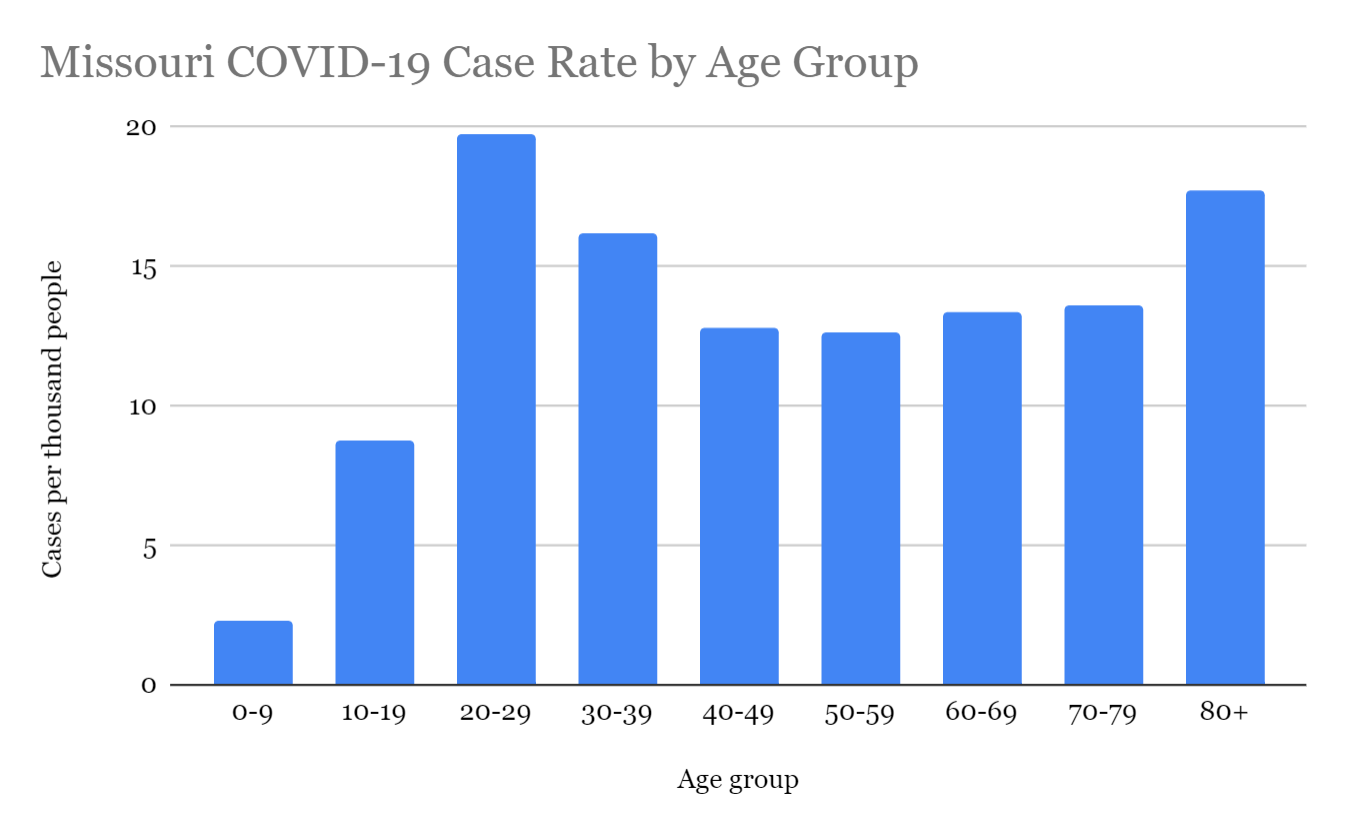
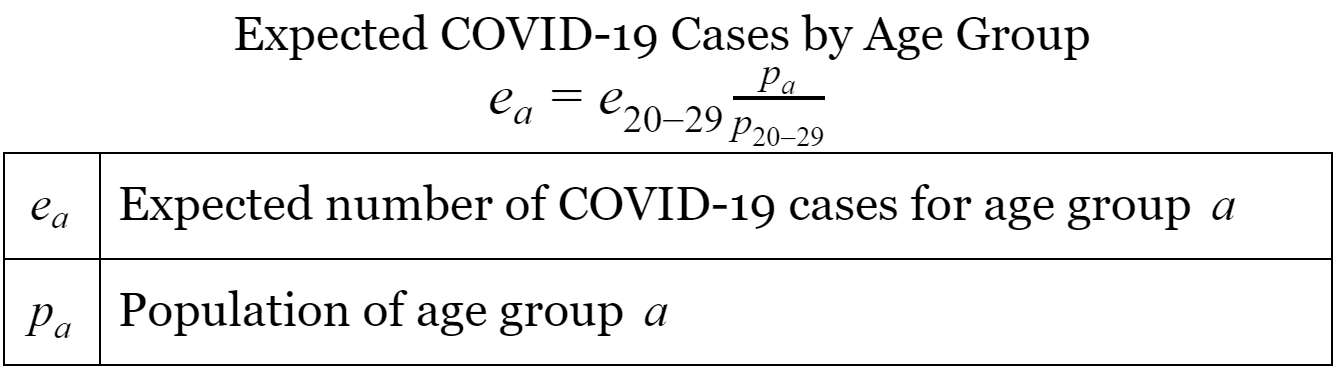
The 20–29 age group has the most reported COVID-19 cases relative to its population, with nearly twenty cases per thousand people. We then assume that this age group has 100% ascertainment and scale the number of expected cases for every other age group accordingly.⁵ This can be done with the following formula:
相对于其人口,20-29岁年龄组的COVID-19病例报道最多,每千人中有近20例病例。 然后,我们假定该年龄组具有100%的确定性,并相应地对其他每个年龄组的预期病例数进行缩放。 ⁵这可以通过以下公式完成:
Note that age group 20–29 is used because it had the highest recorded COVID-19 case rate out of all age groups.
请注意,使用20-29岁年龄组是因为它在所有年龄组中记录的COVID-19病例率最高。
Finally, we calculate the ascertainment rate for each age group by dividing the number of recorded cases by the number of expected cases. The total ascertainment rate is found by summing the recorded and expected cases across all age groups and then dividing. The results for Missouri are shown below:
最后,我们通过记录病例数除以预期病例数来计算每个年龄组的确诊率。 通过将所有年龄段的已记录病例和预期病例相加然后相除,可以得出总确定率。 密苏里州的结果如下所示:
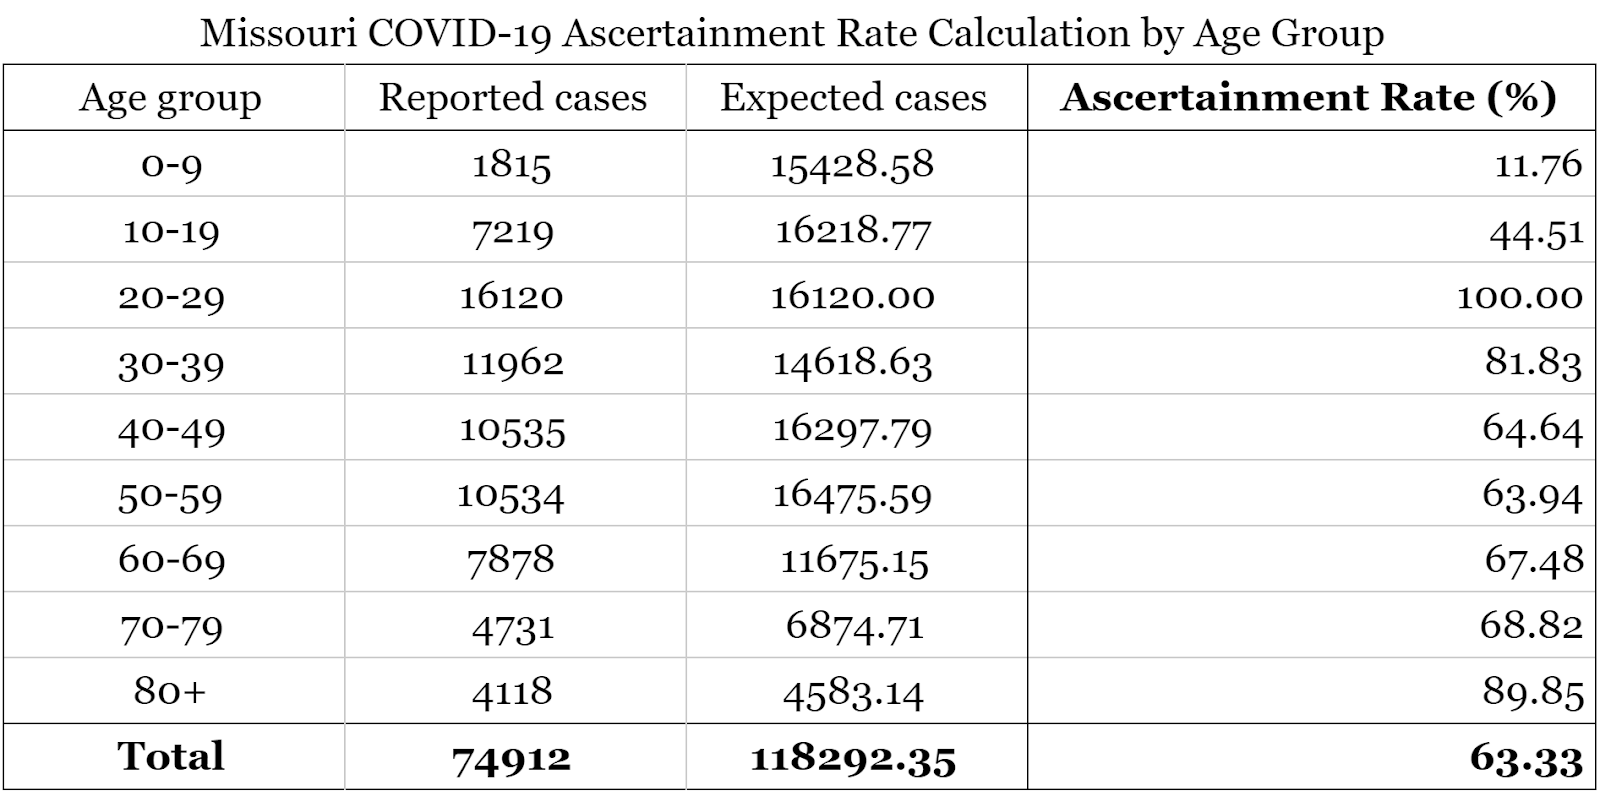
We estimate the overall COVID-19 ascertainment rate for the state of Missouri to be 63.33%, meaning that 63.33% of COVID-19 cases are recorded. Based on this method, we expect there to be nearly 120,000 cases in the state instead of the nearly 75,000 that have been recorded.
我们估计密苏里州的整体COVID-19查明率是63.33%,这意味着记录了63.33%的COVID-19病例。 基于这种方法,我们预计该州将有近120,000例病例,而不是已记录的近75,000例病例。
Unfortunately, this method makes the rather dubious assumption that the age group with the highest reported case rate has 100% ascertainment. This is far from the reality, so the second method gives a better upper bound than a sensible estimate. Since this method also informs the baseline adjusted CFR used in the first method, neither one is a viable choice for us.
不幸的是,这种方法做出了一个相当可疑的假设,即报告病例率最高的年龄组的确诊率是100%。 这与实际情况相去甚远,因此第二种方法给出的上限比明智的估计要好。 由于此方法还可以告知在第一种方法中使用的经过基线调整的CFR,因此对于我们来说,这都不是一个可行的选择。
方法3:使用血清学调查和测试率计算确定性 (Approach 3: Using Serological Surveys and Testing Rates to Calculate Ascertainment)
We can still take what we’ve learned from these approaches to inform our own approach to this problem. The paper that influences the second method suggests that the results of serological surveys will improve ascertainment rate estimates.⁵ Serological, or seroprevalence, surveys look for antibodies in blood.⁶ The presence of antibodies in an individual would indicate a past or recent infection. Conducting serological testing on a random sample of the general population could reveal how many people have COVID-19 antibodies but never got tested for the disease, which would be useful for determining the ascertainment rate.
我们仍然可以利用从这些方法中学到的知识来告知我们自己解决此问题的方法。 影响第二种方法的论文表明,血清学调查的结果将提高确定率的估计。 ⁵血清学或血清阳性率调查会在血液中寻找抗体。 ⁶抗体在个体的存在将表明过去或近期感染。 对普通人群的随机样本进行血清学检测可以揭示有多少人具有COVID-19抗体,但从未对该疾病进行过检测,这对确定查明率很有用。
There is now enough seroprevalence data for a reasonable estimate of the United States ascertainment rate.⁷ Researchers from the CDC and Departments of Health in multiple U.S. states conducted seroprevalence testing in various states over a two-month period to estimate the proportion of the general population with COVID-19 antibodies. Crucially, testing was done on a random sample of the population, rather than people thought to have had COVID-19. Averaging the results in all locations gives approximately 11.63 COVID-19 infections per reported case, for a national ascertainment rate of 1/11.63 = 8.6%. This value can help us find county-specific rates.
现在有足够的血清流行率数据,可以合理估计美国的确诊率。 从健康的在多个美国疾病预防控制中心和部门⁷研究者各州进行测试血清阳性率在各种状态下历时2个月的时间来估算的总人口与COVID-19抗体的比例。 至关重要的是,对人群的随机样本进行了测试,而不是认为COVID-19的人群进行了测试。 在所有地区平均结果的平均结果是,每例报告病例中约有11.63例COVID-19感染,全国确诊率为1 / 11.63 = 8.6%。 此值可以帮助我们找到特定于县的费率。
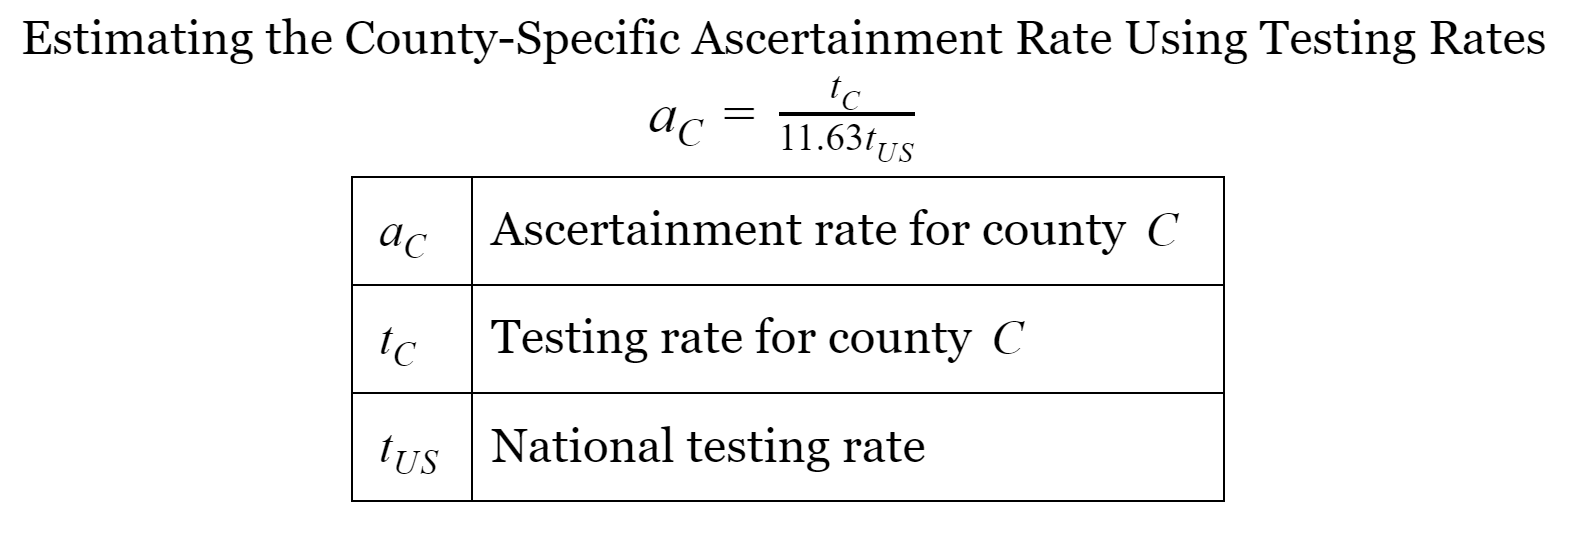
The first method’s reliance on the CFR is flawed because of comorbidities, or deaths attributed to COVID-19 and one or more additional factors (such as diabetes).⁸ However, the concept of comparing to a baseline is valuable, so we use two benchmarks in our methodology: the national ascertainment rate and the national testing rate, measured in tests administered per person. Given the difficulty of conducting seroprevalence tests in every county in the nation, we compare the testing rate for each county to the national rate to see how much each county undercounts cases compared to the nation as a whole. The national ascertainment rate of 1/11.63 is scaled by the ratio of the county testing rate to the national testing rate, as shown in this formula:
第一种方法对CFR的依赖是有缺陷的,因为合并症,COVID-19和一个或多个其他因素(例如糖尿病)导致的死亡。 ⁸但是,与基准进行比较的概念很有价值,因此我们在方法中使用两个基准:国家确定率和国家测试率,以每个人进行的测试来衡量。 鉴于在美国每个县进行血清阳性检体的难度很大,我们将每个县的检出率与国家检出率进行比较,以查看每个县相对于整个国家的计数不足。 国家确定率1 / 11.63由县测试率与国家测试率之比进行缩放,如以下公式所示:
我们如何在风险引擎中使用确定率? (How Do We Use the Ascertainment Rate in Our Risk Engine?)
Our risk engine estimates the probability that you have COVID-19 at the moment you take our survey. Because of this, we estimate the number of active cases by assuming that all cases from the past fourteen days are active and that all severe cases, or about 20% of all cases, from fourteen to twenty-eight days ago are still active.⁹ We then compute the ascertainment rate using the above method with the number of tests administered over the past fourteen days. We divide the case rate by the ascertainment rate for each county to get a more realistic estimate of the base rate that our engine starts with.
我们的风险引擎会在您进行调查时估算您出现COVID-19的可能性。 因此,我们通过假设过去14天以来的所有病例都处于活动状态,并且假设所有严重病例(约占14天至28天前的所有病例的20%)仍处于活跃状态,来估计活跃病例的数量。 then然后,我们使用上述方法计算确定率,并计算了过去14天进行的测试次数。 我们将案例率除以每个县的确定率,以更实际地估算我们的引擎所基于的基本率。
Under-ascertainment is an often overlooked aspect of the pandemic, but it’s vital for health and government officials to consider how it affects their COVID-19 response. It’s also important for you — and us — to understand. Until the under-reporting problem can be solved through better community outreach and testing availability, we need to harness creative mathematical modeling methods to obtain the most accurate picture from the data currently available. If you, the reader, have any thoughts or suggestions for improving upon our approach, we would love to hear from you. Please reach out to us at ideas@trackmyexposure.com.
确定性不足是大流行病中经常被忽视的一个方面,但对于卫生和政府官员来说,考虑它如何影响其COVID-19React至关重要。 了解您和我们也很重要。 在可以通过更好的社区联系和测试可用性解决举报不足的问题之前,我们需要利用创造性的数学建模方法从当前可用数据中获取最准确的图像。 如果您(读者)对改进我们的方法有任何想法或建议,我们将很高兴收到您的来信。 请通过idea@trackmyexposure.com与我们联系 。
***
***
脚注参考 (Footnote References)
- Golding, N., Russell, T. W., Abbott, S., Hellewell, J., Pearson, C. A., Zandvoort, K. V., . . . Kucharski, A. J. (2020). Reconstructing the global dynamics of under-ascertained COVID-19 cases and infections. doi:10.1101/2020.07.07.20148460 戈尔丁,N。,罗素,TW,雅培,S。,赫勒威尔,J。,皮尔森,CA,赞德沃特,KV ,。 。 。 Kucharski,AJ(2020年)。 重建尚未确定的COVID-19病例和感染的全球动态。 doi:10.1101 / 2020.07.07.20148460
Flaxman, S., Mishra, S., Gandy, A., Unwin, H. J., Mellan, T. A., Coupland, H., . . . Bhatt, S. (2020). Estimating the effects of non-pharmaceutical interventions on COVID-19 in Europe. Nature, 584(7820), 257–261. doi:10.1038/s41586–020–2405–7
Flaxman,S.,Mishra,S.,Gandy,A.,Unwin,HJ,Mellan,TA,Coupland,H。,。 。 。 Bhatt,S.(2020年)。 估计欧洲非药物干预对COVID-19的影响。 自然, 584 (7820),257–261。 doi:10.1038 / s41586–020–2405–7
Gibbons, C. L., Mangen, M. J., Plass, D., Havelaar, A. H., Brooke, R. J., Kramarz, P., . . . Kretzschmar, M. E. (2014). Measuring underreporting and under-ascertainment in infectious disease datasets: A comparison of methods. BMC Public Health, 14(1). doi:10.1186/1471–2458–14–147
Gibbons,CL,Mangen,MJ,Plass,D.,Havelaar,AH,Brooke,RJ,Kramarz,P.。 。 。 Kretzschmar,ME(2014)。 在传染病数据集中测量报告不足和确定性不足:方法的比较。 BMC公共卫生,第 14 (1)页。 doi:10.1186 / 1471–2458–14–147
Stoner, O., Economou, T., & Silva, G. D. (2019). A Hierarchical Framework for Correcting Under-Reporting in Count Data. Journal of the American Statistical Association, 114(528), 1481–1492. doi:10.1080/01621459.2019.1573732
斯托纳(O.) 纠正计数数据中报告不足的层次结构框架。 美国统计协会杂志, 114 (528),1481-1492。 doi:10.1080 / 01621459.2019.1573732
Verity, R., Okell, L. C., Dorigatti, I., Winskill, P., Whittaker, C., Imai, N., . . . Ferguson, N. M. (2020). Estimates of the severity of coronavirus disease 2019: A model-based analysis. The Lancet Infectious Diseases, 20(6), 669–677. doi:10.1016/s1473–3099(20)30243–7
Verity,R.,Okell,LC,Dorigatti,I.,Winskill,P.,Whittaker,C.,Imai,N。,。 。 。 新墨西哥州弗格森(2020年)。 2019年冠状病毒疾病严重程度估计:基于模型的分析。 《柳叶刀传染病》, 20 (6),669–677。 doi:10.1016 / s1473–3099(20)30243–7
COVID-19 Serology Surveillance Strategy. (n.d.). Retrieved from https://www.cdc.gov/coronavirus/2019-ncov/covid-data/serology-surveillance/index.html
COVID-19血清学监测策略。 (nd)。 取自https://www.cdc.gov/coronavirus/2019-ncov/covid-data/serology-surveillance/index.html
Havers, F. P., Reed, C., Lim, T., Montgomery, J. M., Klena, J. D., Hall, A. J., . . . Thornburg, N. J. (2020). Seroprevalence of Antibodies to SARS-CoV-2 in 10 Sites in the United States, March 23-May 12, 2020. JAMA Internal Medicine. doi:10.1001/jamainternmed.2020.4130
Havers,FP,Reed,C.,Lim,T。,蒙哥马利,JM,Klena,JD,Hall,AJ 、。 。 。 新泽西州索恩堡(2020)。 2020年3月23日至5月12日在美国10个地点的SARS-CoV-2抗体的血清阳性率。JAMA内科学 。 doi:10.1001 / jamainternmed.2020.4130
Pearce, K. (2020, September 01). Excess deaths show the true impact of COVID-19 in the U.S. Retrieved from https://hub.jhu.edu/2020/09/01/comorbidities-and-coronavirus-deaths-cdc/
皮尔斯(K.Pearce)(2020年9月1日)。 过量死亡显示了COVID-19在美国的真实影响。取自https://hub.jhu.edu/2020/09/01/comorbidities-and-coronavirus-deaths-cdc/
Report of the WHO-China Joint Mission on Coronavirus Disease 2019 (COVID-19). (2020, February 24). Retrieved from https://www.who.int/docs/default-source/coronaviruse/who-china-joint-mission-on-covid-19-final-report.pdf
2019年世卫组织-中国冠状病毒病联合特派团(COVID-19)的报告。 (2020年2月24日)。 取自https://www.who.int/docs/default-source/coronaviruse/who-china-joint-mission-on-covid-19-final-report.pdf


 884
884

 被折叠的 条评论
为什么被折叠?
被折叠的 条评论
为什么被折叠?
 到【灌水乐园】发言


