


哥伦布视图
As a Blue Jackets fan, it is a common experience to lament the team’s seeming to start the season on the wrong foot. Anecdotally, the Blue Jackets seem to perform worse in the beginning of the season, making it difficult for them to make the playoffs in the end even when they do gain momentum in the latter part of the season. Fans talk about the Jackets “digging a hole” for themselves in the beginning of the season that forces them to make up lost ground later, but I was curious to see if this pattern holds up statistically, or if it is just something that fans perceive but is not borne out by the data.
作为蓝夹克的球迷,通常会为球队似乎错误地开始赛季感到遗憾。 有趣的是,蓝夹克在本赛季开始时表现较差,即使他们在本赛季后期确实获得了动力,他们也很难进入季后赛。 球迷们谈论夹克在赛季开始之初为自己“挖一个洞”,迫使他们后来弥补失地,但我很好奇,看看这种模式是否在统计上仍然成立,或者仅仅是球迷认为的事情但是并没有被数据证实。
To answer this question, I obtained data from hockey-reference.com about every game the Blue Jackets played in the 2013–14 through 2018–19 seasons. For each game, the dataset contained the location (home vs. away), the opponent, the result, and various statistics for both the Jackets and their opponents, including goals scored, Corsi For and Against, Fenwick For and Against, and faceoff percentage.
为了回答这个问题,我从hockey-reference.com获得了有关Blue Jackets在2013-14赛季至2018-19赛季打过的每场比赛的数据。 对于每个游戏,数据集都包含位置(主场对客场),对手,结果以及夹克及其对手的各种统计信息,包括进球数,Corsi赞成和反对,Fenwick赞成和反对以及对位率。
I created new variables dividing the season in two different ways to compare performance across the season. First, I assigned games to one of three subseasons, the first being before the holiday break, second between the holiday break and the All-Star break, and third after the All-Star break. On the one hand, this division was logical, but on the other hand it was not an even division, as the middle subseason frequently had far fewer games than the other subseasons. Because of this, I also separated the season into four parts, each with 20 or 21 games. This division was even but not necessarily logical, so I conducted analysis using both kinds of divisions.
我创建了新的变量,以两种不同的方式划分了季节,以比较整个季节的表现。 首先,我将游戏分配给三个子季节之一,第一个在假期之前,第二个在假期和全明星之间,第三个在全明星之后。 一方面,这种划分是合乎逻辑的,但另一方面,它并不是一个均匀的划分,因为中间子赛季的比赛次数通常比其他子赛季少得多。 因此,我也将本赛季分为四个部分,每个部分进行20或21场比赛。 该划分甚至是逻辑划分,但不一定是逻辑划分,因此我使用两种划分进行了分析。
The first response variable I wanted to look at was win percentage because that was the most logical measure of team success in a period of time. I recorded the win percentage for each subseason across all the seasons in the dataset.
我要查看的第一个响应变量是获胜百分比,因为这是一段时间内团队成功的最合逻辑的度量。 我在数据集中记录了所有子赛季每个子赛季的胜率。
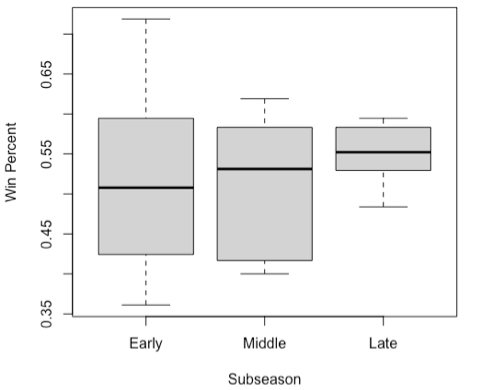
Looking at the side-by-side boxplots of win percentage across the subseasons, it does appear that the Jackets perform better in the later part of the season than in the early part of the season. However, there is quite a lot of variability in the early part of the season, so it would require a formal statistical test to see if this conclusion was true.
纵观各个子赛季的胜率百分比,看来夹克在赛季后期的表现要好于赛季初期。 但是,在赛季初期会有很大的可变性,因此需要进行正式的统计检验才能确定该结论是否正确。
I decided to conduct an ANOVA to see if the difference between the subseasons is statistically significant. The null hypothesis for the test is that there is no effect on win percentage by subseason, while the alternative hypothesis is that at least one subseason has an effect on win percent.
我决定进行方差分析,以查看子季之间的差异是否在统计上显着。 该检验的零假设是,每个子赛季对胜率没有影响,而另一种假设是,至少一个子季节对胜率有影响。
H0: α1 = α2 = α3 = 0
H0:α1=α2=α3= 0
H1: at least one αi ≠ 0
H1:至少一个αi≠0
Assessing the conditions for the ANOVA, there is some discrepancy in the standard deviations between groups, and there might be some problems with normality, so the conditions for ANOVA may not be perfectly met here.
在评估ANOVA的条件时,各组之间的标准差存在一些差异,并且正态性可能存在一些问题,因此此处可能无法完全满足ANOVA的条件。
However, the conclusion of the ANOVA makes the violation of the assumptions irrelevant, as the F-value on 2 and 15 degrees of freedom is only 0.237, corresponding to a p-value of 0.792. Because the p-value is greater than the alpha-level of 0.05, we fail to reject the null hypothesis and conclude that we do not have evidence to say that the Blue Jackets have different win percentages across the three subseasons.
但是,ANOVA的结论使得与假设的无关紧要,因为2自由度和15自由度的F值仅为0.237,对应于0.792的p值。 因为p值大于0.05的alpha值,所以我们无法拒绝原假设,并得出结论,我们没有证据表明蓝夹克在三个子赛季中的胜率不同。
I also ran another ANOVA using a block design taking into account the season, but this did not change the conclusion: the p-value for the effect of subseason was 0.752, so again we fail to reject the null hypothesis.
我还考虑了季节情况,使用区组设计进行了另一次方差分析,但这并没有改变结论:亚季节效应的p值为0.752,因此我们仍然不能拒绝原假设。
To be thorough, I also conducted a similar analysis using the division of the season into four even quarters to see if the fact that the subseasons were not evenly balanced had an effect on the conclusions.
确切地说,我还使用季节划分为四个均匀季度来进行了类似的分析,以查看子季平衡不均衡的事实是否对结论产生影响。

Once again, it looks like there might be some differences between quarters, but it will require a test to see. For the second quarter, notice the outliers that appear on this boxplot.
同样,两个季度之间可能会有一些差异,但是需要进行测试才能看到。 对于第二季度,请注意此箱图中显示的异常值。
Again, I conducted an ANOVA to examine the effect of season quarter on win percentage. The null hypothesis is again that win percentage is the same across the quarters, while the alternative hypothesis is that at least one quarter differs from the others in win percentage.
再次,我进行了方差分析,以检查季季对获胜百分比的影响。 零假设再次是在各个季度中获胜百分比相同,而另一种假设是至少一个季度与其他季度的获胜百分比不同。
H0: α1 = α2 = α3 = α4 = 0
H0:α1=α2=α3=α4= 0
H1: at least one αi ≠ 0
H1:至少一个αi≠0
Assessing the conditions for the ANOVA, I found that the assumption of equal variances was met, as the standard deviations for the four groups were a lot closer together, at 0.149, 0.155, 0.109, and 0.122. None of these exceed the usual rule of thumb of having one group’s standard deviation be twice that of another group. However, the normality assumption appears to be somewhat problematic, as there is some bowing at the lower end of the normality plot.
在评估方差分析的条件时,我发现满足了方差相等的假设,因为四组的标准偏差更接近,分别为0.149、0.155、0.109和0.122。 这些都没有超出通常的经验法则,即一组标准偏差是另一组标准偏差的两倍。 但是,正态性假设似乎有些问题,因为在正态性图的下端有些弯曲。
Once again, though, the status of the assumptions does not end up making a difference, as the F-value for the effect of quarter on win percentage, with 3 and 20 degrees of freedom, is only 1.468, corresponding to a p-value of 0.253. Because the p-value is greater than the alpha level of 0.05, we fail to reject the null hypothesis and conclude that we do not have evidence to say that the Blue Jackets’ win percentage differs across the quarters of the season.
但是,假设的状态并没有最终改变,因为具有3和20自由度的四分之一对获胜百分比的影响的F值仅为1.468,对应于p值为0.253。 由于p值大于0.05的alpha值,因此我们无法拒绝原假设,并得出结论,我们没有证据表明蓝夹克的获胜百分比在整个赛季的各个季度都不同。
For completeness, I also ran a blocked ANOVA taking into account season, as well as the nonparametric competitors to these tests, the Kruskal-Wallis test and the Friedman test because of the outliers that appeared on the initial boxplot. However, all of these tests came to the same conclusion as the original ANOVA (blocked ANOVA: F(3,15) = 1.462, p = 0.265; Kruskal-Wallis: χ2 = 2.7729, p = 0.428; Friedman: χ2 = 3.1034, p = 0.3759). So the conclusion does not change — all signs point to the Blue Jackets not having as wide a gap in performance between different chunks of the season, no matter how I divide the season.
为了完整起见,由于最初箱形图中出现了异常值,我还考虑了季节以及针对这些测试的非参数竞争对手,Kruskal-Wallis测试和Friedman测试进行了封闭ANOVA。 但是,所有这些测试都得出与原始ANOVA相同的结论(封闭ANOVA:F(3,15)= 1.462,p = 0.265; Kruskal-Wallis:χ2= 2.7729,p = 0.428; Friedman:χ2= 3.1034, p = 0.3759)。 因此结论并没有改变-所有迹象都表明,无论我如何划分赛季,蓝夹克在赛季不同部分之间的表现差距都没有那么大。
However, it is important to note that because of how win percentage had to be calculated, the sample size for the tests was quite small. Rather than looking at the results of individual games I had to look at the results of the whole subseason or quarter to get the win percentage, so the sample size was only the number of subseasons or quarters there were. Because of this, it is entirely possible that the power of the tests was too low to capture any true differences in win percentage across the season.
但是,必须注意的是,由于必须计算赢率,因此测试的样本量很小。 不必查看单个游戏的结果,我必须查看整个子季或季度的结果才能获得获胜百分比,因此样本数量仅为子季或季度的数量。 因此,测试的功效很可能太低而无法捕捉到整个赛季获胜率的真正差异。
One way to address this would be to use logistic regression to look at the outcomes of individual games, but I also decided to look at more specific statistics that were measured for individual games, giving me a better look at what aspects of the Jackets’ game might be different, as well as getting around the small sample size problem created by combining games into subseasons and quarters to get win percentage.
解决此问题的一种方法是使用逻辑回归分析各个游戏的结果,但我也决定查看针对各个游戏测量的更具体的统计信息,从而使我可以更好地了解Jackets游戏的哪些方面可能会有所不同,还要解决将游戏合并到子赛季和下半场以获取获胜百分比所产生的小样本问题。
Corsi is an advanced metric measuring shot attempts at even strength, and it is calculated by summing up shots, blocks, and misses. Corsi For (CF), or the shot attempts for the Jackets, is used as a proxy for offensive performance, while Corsi Against (CA), or attempts by the Jackets’ opponent, is used as a proxy for defensive performance.
Corsi是一种先进的度量标准,可以以均匀的力量来测量击球次数,它是通过对击球,盖帽和未击球求和而得出的。 Corsi For(CF)或对夹克的投篮尝试被用作进攻表现的代表,而Corsi Against(CA)或对夹克的对手尝试被用作防守表现的代表。
First, I wanted to look at the impact of time across the season on offensive performance, so I created side-by-side boxplots to examine the relationship between subseason and CF.
首先,我想看看整个赛季的时间对进攻表现的影响,因此我创建了并排的箱线图,以研究次赛季和CF的关系。

There does appear to be a slight difference between subseasons, increasing over the course of the season, but we will have to see if it is significant. Also, we may be concerned about those outliers.
子季之间似乎确实存在细微的差异,并且在整个赛季中有所增加,但是我们将不得不看看它是否有意义。 此外,我们可能会担心这些异常值。
I conducted an ANOVA to see if the effect of subseason on CF is significant. Once again the null hypothesis is that there is no difference in CF across the subseasons, while the alternative hypothesis is that at least one of the subseasons differs in its CF per game.
我进行了方差分析,以了解子季对CF的影响是否显着。 同样,零假设是整个子赛季的CF值没有差异,而另一种假设是,每个比赛中至少有一个子赛季的CF值不同。
H0: α1 = α2 = α3 = 0
H0:α1=α2=α3= 0
H1: at least one αi ≠ 0
H1:至少一个αi≠0
I first need to assess the conditions for ANOVA, and I find that the assumption of equal variance is satisfied, but the assumption of normality might be slightly problematic. Even with this problem, I decide to proceed with the ANOVA to see if the relationship was statistically significant. The F-value on 2 and 488 degrees of freedom is 5.905, corresponding to a p-value of 0.00292. Because the p-value is less than the alpha level of 0.05, we can reject the null hypothesis and conclude that there is a difference in CF across the subseasons.
我首先需要评估ANOVA的条件,并且发现满足方差相等的假设,但是正态性的假设可能会有些问题。 即使存在此问题,我还是决定进行ANOVA,以查看该关系在统计上是否有意义。 2个自由度和488个自由度的F值为5.905,对应于0.00292的p值。 因为p值小于0.05的alpha值,所以我们可以拒绝原假设,并得出结论认为各个子季节的CF有所不同。
After reaching this conclusion, I used follow-up multiple comparisons to determine the nature of the difference between the subseasons. I used a Tukey’s HSD procedure, which revealed that the late subseason was significantly different from the early subseason, but none of the other comparisons were significant.
在得出这个结论之后,我使用了后续的多重比较来确定子赛季之间差异的性质。 我使用了Tukey的HSD程序,该程序揭示了亚季节后期与亚季节早期明显不同,但其他比较均无显着性。
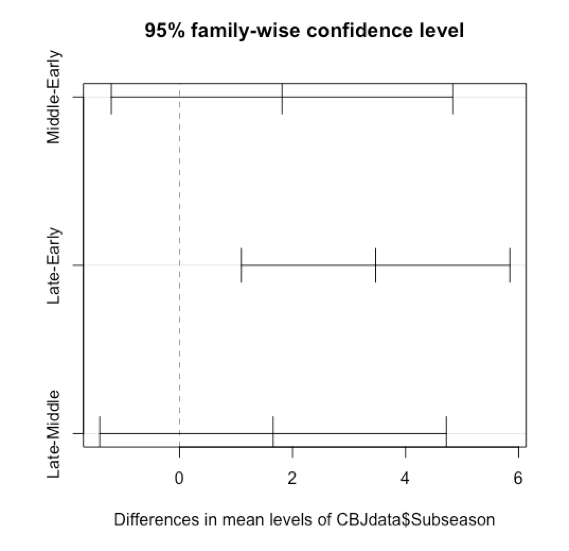
So we can conclude that offensive performance as measured by CF is significantly better in the later part of the season than the early part of the season.
因此,我们可以得出结论,以CF衡量的进攻表现在赛季后期比赛季初期明显好得多。
As before, I also ran an ANOVA blocked on season as well as a Kruskal-Wallis test, both of which led to the same conclusion as the original F-test (blocked ANOVA: F (2, 483) = 6.507, p = 0.00163; Kruskal-Wallis: χ2 = 11.09, p = 0.00397). The conclusion remains the same, that we should reject the null hypothesis and conclude that there is a difference in CF across the subseasons.
和以前一样,我还进行了按季节封闭的方差分析以及Kruskal-Wallis检验,两者均得出与原始F检验相同的结论(封闭方差分析:F(2,483)= 6.507,p = 0.00163 ; Kruskal-Wallis:χ2= 11.09,p = 0.00397)。 结论仍然是相同的,我们应该拒绝原假设,并得出各个子季节CF的差异。
I also wanted to see if there was a difference in defensive performance across the subseasons as well, so I examined CA between the different parts of the season.
我还想看看在各个子赛季的防守表现上是否也存在差异,因此我检查了赛季不同部分之间的防守效率。
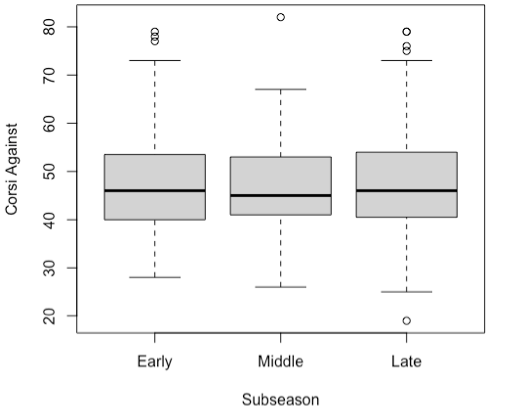
Looking at the side-by-side boxplots, the subseasons really do not appear to differ in their CA numbers, but it would require a test to verify that there is no statistically significant difference. As with the boxplots for CF, there are some outliers that might cause problems for the analysis.
从并排的箱图来看,子赛季的CA编号似乎并没有差异,但是需要进行测试以验证没有统计学上的显着差异。 与CF的箱型图一样,有些异常值可能会引起分析问题。
To specify the hypotheses for the ANOVA F-test, the null hypothesis is that there is no effect of subseason on CA, while the alternative hypothesis is that at least one subseason differs in CA.
为了指定ANOVA F检验的假设,零假设是分季对CA没有影响,而替代假设是至少一个分季在CA中有所不同。
H0: α1 = α2 = α3 = 0
H0:α1=α2=α3= 0
H1: at least one αi ≠ 0
H1:至少一个αi≠0
Assessing the conditions for the test, the standard deviations appear to satisfy the assumption of equal variance, but just as with CF, there is some bowing in the normality plot, indicating that this assumption may be violated.
在评估测试条件时,标准偏差似乎满足方差相等的假设,但是与CF一样,正态图中有些弯曲,表明该假设可能被违反。
The F-value on 2 and 488 degrees of freedom was 0.159, corresponding to a p-value of 0.853. Because the p-value is greater than the alpha level of 0.05, we fail to reject the null hypothesis and conclude that we do not have evidence to say that CA differed across the subseasons.
2自由度和488自由度的F值为0.159,对应于0.853的p值。 因为p值大于0.05的alpha值,所以我们无法拒绝原假设,并得出结论,我们没有证据表明在各个子赛季中,CA有所不同。
Once again, I also run the block design ANOVA and Kruskal-Wallis procedure to see if the conclusion changes, but both these tests have the same result as the original ANOVA (blocked ANOVA: F (2, 483) = 0.162, p = 0.8501; Kruskal-Wallis: χ2 = 0.165, p = 0.9207), so we can be quite sure that we fail to reject the null hypothesis and conclude that we do not have evidence to say that there is a relationship between time in the season and defensive performance.
再次,我还运行了块设计方差分析和Kruskal-Wallis过程,以查看结论是否改变,但是这两个测试的结果均与原始方差分析相同(被阻止的方差分析:F(2,483)= 0.162,p = 0.8501 ; Kruskal-Wallis:χ2= 0.165,p = 0.9207),因此我们可以确定我们不能拒绝原假设,并得出结论,我们没有证据表明本赛季的时间和防守之间存在关系性能。
Though fans have observed that the Jackets seem to play differently at different times in the season, this analysis did not find much difference in their data across three chunks of the season. However, this may also be due to a lack of power resulting from small sample sizes caused by computing win percentage across the subseasons rather than taking game results individually. Future work would benefit from taking a closer look at individual game performance, perhaps by using logistic regression.
尽管球迷们注意到夹克在赛季的不同时间似乎有不同的表现,但这项分析并未发现他们在整个赛季的三个部分中的数据有很大的不同。 但是,这也可能是由于由于计算子赛季的胜率而不是单独获取比赛结果而导致的样本量较小而导致的能力不足。 仔细研究各个游戏的性能可能会受益于未来的工作,也许可以使用逻辑回归。
In spite of not finding any sweeping differences in overall win percentage, there was a statistically significant difference in Corsi For (CF) between subseasons, such that the Jackets got significantly higher CF scores in the late part of the season compared with the early part of the season. This suggests that the fan perception may not be too far off — that the Blue Jackets start the season with a weak offense and ramp up their offensive performance late in the season. However, it is important to consider the practical importance of a conclusion like this. Just because there was a statistically significant difference in CF between subseasons, it may not mean much for the team overall. How impactful is 3.5 extra CF points in the later part of the season compared with the early part of the season? Can three extra shot attempts make that much of a difference in outcomes for the team? It is unclear.
尽管未发现总体获胜百分比有任何明显的差异,但各子赛季之间的Corsi For(CF)在统计上存在显着差异,因此,与本赛季早期相比,夹克在赛季后期的CF得分显着更高本赛季。 这表明球迷的看法可能相距不远-蓝夹克在本赛季开始时进攻较弱,并在赛季后期提高了进攻表现。 但是,重要的是要考虑这样一个结论的实际重要性。 仅仅因为子赛季之间CF的统计差异显着,对整个球队来说可能并不意味着什么。 与季节初期相比,季节后期3.5个额外的CF点有多大影响? 能否再尝试3次,对团队的结果有很大的影响? 目前尚不清楚。
On the other hand, this analysis did not find any difference across the subseasons in defensive performance as measured by Corsi Against (CA). It appears that the Blue Jackets are actually pretty consistent in their defensive play, but looking back at the boxplots of CA across the subseasons raises another question, which is that the variability is different in each one, so future work could examine if the Blue Jackets are more consistent in one subseason versus another. In other words, the average CA might be similar in all three subseasons, but in one subseason they might have some games where they really shut down the opposition and others where they let a lot of opposing chances, while in another subseason they performed more in the middle the whole time. Other response variables could benefit from this kind of analysis as well, especially the win percent, as this analysis found large differences in the standard deviation of win percent across the subseasons.
另一方面,根据科西反对(CA)的测量,该分析并未发现子赛季在防守表现上的任何差异。 看来,蓝夹克在防守方面实际上是相当一致的,但是回顾一下子赛季中CA的框线图,就会引起另一个问题,那就是每个方面的可变性都不同,因此未来的工作可以检查蓝夹克是否在一个子赛季比另一个子赛季更一致。 换句话说,在所有三个子赛季中,平均CA可能都相似,但是在一个子赛季中,他们可能有一些比赛真正关闭了对手,而在其他子赛季中他们给了很多反对机会,而在另一个子赛季中,他们的表现更多。整个过程中间。 其他响应变量也可以从这种分析中受益,尤其是获胜百分比,因为该分析发现各个子赛季的获胜百分比标准偏差存在很大差异。
Finally, it is important to look at the impact on the team’s season outcomes from these subseason performance questions. After all, it is the team’s goal (and fans’ hope) to make the playoffs at the end of the season, so it is important to assess how performance across the subseasons relates to overall performance. Future work could look at ranking the performance in each subseason and seeing if the Blue Jackets tend to do better in the end when they have a good start vs. a solid middle vs. a strong finish.
最后,重要的是要考虑这些次赛季表现问题对球队赛季结果的影响。 毕竟,在赛季结束后进入季后赛是球队的目标(也是球迷的希望),因此评估子赛季的表现与整体表现之间的关系非常重要。 未来的工作可能会考虑对每个子赛季的表现进行排名,并查看蓝夹克在开局良好,中路稳固还是结局强劲的情况下,最终是否会表现更好。
哥伦布视图


 1115
1115

 被折叠的 条评论
为什么被折叠?
被折叠的 条评论
为什么被折叠?
 到【灌水乐园】发言


