


清理数据 python
In this post, we will be using the Pandas library with Python to demonstrate how to clean the real-world data so that it is ready-to-be-used for any processing task. Frankly, most of the data obtained from real-world sensors contain a lot of garbage and null values. Oftentimes, data are in a format that is not supported by data analysis or machine learning algorithms. Hence data cleansing is almost always the first step in most data analytics/ML/AI jobs.
在本文中,我们将使用Pandas库和Python来演示如何清除现实世界的数据,以便随时将其用于任何处理任务。 坦白说,从现实世界的传感器获得的大多数数据都包含大量垃圾和空值。 通常,数据采用数据分析或机器学习算法不支持的格式。 因此,在大多数数据分析/ ML / AI作业中,数据清理几乎始终是第一步。
Pandas is an immensely powerful library for data manipulation. Earlier, I was a huge Matlab fan and thought that there is no match for Matlab when it comes to data analysis. But ever since I have moved to Pandas (Python actually), I hate going back to Matlab again.
Pandas是一个功能强大的数据处理库。 早些时候,我是Matlab的忠实拥护者,并认为在数据分析方面Matlab无法与之匹敌。 但是自从我搬到Pandas(实际上是Python)以来,我就讨厌再次回到Matlab。
Anyways, keep Matlab aside now, and let’s begin with Pandas.
无论如何,现在就把Matlab放在一边,让我们从熊猫开始吧。
The data that I will be using is the real-world call data record (CDR) that was made public by Telecom Italia as part of a Big Data competition in 2014. You can find and download the complete dataset here (I should warn that this is a very huge data set. Each file is over 300 MB, and there are 62 files in total — one file per day). I am sharing one file only that I will be using in this blog via my google drive. Click here to get that file.
我将使用的数据是真实电话数据记录(CDR),该数据是由Italia Telecom在2014年大数据竞赛中公开发布的。您可以在此处找到并下载完整的数据集 (我应该警告这是一个非常大的数据集。每个文件超过300 MB,总共有62个文件-每天一个文件)。 我仅共享一个文件,该文件将通过Google驱动器在此博客中使用。 单击此处获取该文件。
The dataset captures the calls, SMS, and internet usage of Telecom Italia’s users in the city of Milan, Italy for two whole months. Each day is recorded as a single file. However, for this blog, I will only be using the data for a single day (i.e. single file) from this CDR.
该数据集捕获了意大利米兰市两个月的意大利电信用户的呼叫,短信和互联网使用情况。 每天都记录为一个文件。 但是,对于此博客,我将仅使用该CDR中一天的数据(即单个文件)。
Let’s first start with importing all the necessary packages
让我们首先从导入所有必要的包开始
import pandas as pd
from pandas import read_csv
After importing all the necessary packages, let’s do the real stuff. Pandas provide a function read_csv(…) (which we have imported earlier) to read different kinds of data files. In our files, the data is stored in a tab-delimited format. Hence we will use <delimiter = ‘\t’> argument to specify during the reading process to break whenever a tab (\t) exist in the file.
导入所有必需的程序包后,让我们开始实际工作。 熊猫提供了一个read_csv(…)函数(我们之前已经导入了它)来读取不同类型的数据文件。 在我们的文件中,数据以制表符分隔的格式存储。 因此,我们将使用<delimiter ='\ t'>参数指定在读取过程中只要文件中存在制表符(\ t)时就中断。
I always prefer not to mess with the actual variable that stores data. Hence, we will clone data in another dataframe and call it df. The command df.head() will display the first few members of the dataset.
我始终不希望弄乱存储数据的实际变量。 因此,我们将在另一个数据帧中克隆数据,并将其称为df 。 命令df.head()将显示数据集的前几个成员。
dataset = pd.read_csv('D:/Research/dataset/sms-call-internet-mi-2013-11-1.txt', delimiter='\t')
df = dataset
df.head()
Observe that the dataset is in a raw format (See Fig. 1 below). Even the names of the columns are not mentioned.
观察到数据集是原始格式的(请参见下面的图1)。 甚至没有提到列名。
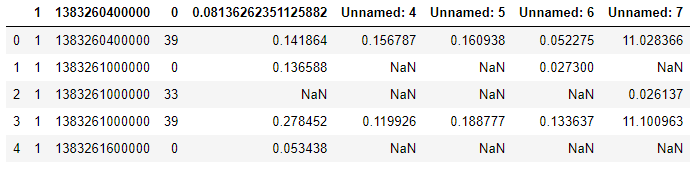
First of all, we will give appropriate names to all the columns using df.columns. In this particular case, the dataset provider (i.e. Telecom Italia) has given all the information about the columns. Hence we will use this information to appropriately name each column.
首先,我们将使用df.columns为所有列指定适当的名称。 在这种特殊情况下,数据集提供者(即意大利电信)已经给出了有关列的所有信息。 因此,我们将使用此信息来适当地命名每一列。
df.columns = ['Grid ID', 'Time Stamp','Caller ID','SMS in',
             'SMS out','Call in','Call out','Internet']
数据清理 (Data Cleansing)
Data cleansing is very crucial and almost always-needed (as mentioned earlier) step when working with real-world data as captured data may have a lot of discrepancies, missing values, etc.
处理真实数据时,数据清理非常关键,几乎总是需要采取的步骤(如前所述),因为捕获的数据可能存在很多差异,缺少值等。
For example, observe that in Figure 1 above that there are several NaN values within the raw dataset. These values indicate the data acquiring sensors could not get any values for whatever reasons. We will replace all NaN values with Zero (0). For this purpose, pandas provide a simple function fillna(…). We will use this function to replace NaN with Zeros (0). Also, note that using inplace = True is equivalent to stating df = df.fillna(0). This is another strong feature in pandas that allow a cleaner and shorter version of code.
例如,观察上面的图1,原始数据集中有多个NaN值。 这些值表明数据采集传感器无论出于何种原因都无法获得任何值。 我们将所有NaN值替换为零(0)。 为此,熊猫提供了一个简单的功能fillna(...) 。 我们将使用此功能将NaN替换为零(0)。 另外,请注意,使用inplace = True等效于声明df = df.fillna(0) 。 这是熊猫的另一个强大功能,可以使代码更简洁,更短。
The time unit for each record entry is given in milliseconds. Hence we will also change the time unit into minutes. Finally, we will display the formatted data in Figure 2 below.
每个记录条目的时间单位以毫秒为单位。 因此,我们还将时间单位更改为分钟。 最后,我们将在下面的图2中显示格式化的数据。
# Fill all the NaN values with 0
df.fillna(0,inplace = True)
#The time is in milli-seconds. We will change it to minutes.
df['Time Stamp'] = df['Time Stamp']/(1000*60)
df.head()
Observe that all NaN values are replaced by 0. The timestamp has also been changed into minutes.
观察所有NaN值都被替换为0。时间戳记也已更改为分钟。
Finally, we will display the Internet activity to observe what kind of data we have (You can play around with other activities such as Call in, Call out, etc as well). You can try an insert other activities as well.
最后,我们将显示Internet活动以观察我们拥有什么样的数据(您也可以参与其他活动,如“呼入”,“呼出”等)。 您也可以尝试插入其他活动。
%matplotlib inline
import matplotlib
import matplotlib.pyplot as plt
plt.plot(df['Internet'])
plt.grid()
plt.xlabel('Time (in 10-minute interval)', fontsize =12)
plt.ylabel('Activity', fontsize = 12)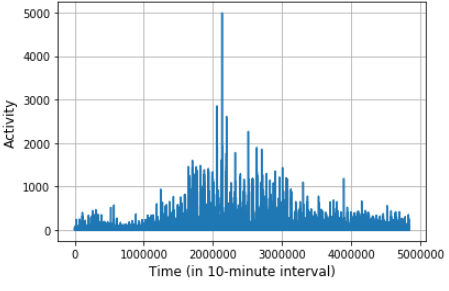
We will stop here this week. Next week, we will use this cleaner version of data to predict cellular traffic using Deep Neural Network (Recurrent Neural Net). Till then…
我们本周将在这里停止。 下周,我们将使用更干净的数据版本,通过深度神经网络(递归神经网络)预测蜂窝网络流量。 直到那时…
The complete code is present here.
完整的代码在这里 。
翻译自: https://medium.com/analytics-vidhya/data-cleansing-using-pandas-in-python-33204242d3b2
清理数据 python


 243
243


 被折叠的 条评论
为什么被折叠?
被折叠的 条评论
为什么被折叠?
 到【灌水乐园】发言


