


For data scientists, handling missing data is an important part of the data cleaning and model development process. Often times, real data contains multiple sparse fields or fields that are laden with bad values. In this post, we will discuss how to build models that can be used to impute missing or bad values in data.
对于数据科学家来说,处理丢失的数据是数据清理和模型开发过程的重要组成部分。 通常,真实数据包含多个稀疏字段或包含错误值的字段。 在本文中,我们将讨论如何构建可用于估算数据中缺失或错误值的模型。
Let’s get started!
让我们开始吧!
For our purposes, we will be working with the wines dataset which can be found here.
为了我们的目的,我们将使用可在此处找到的葡萄酒数据集。
To start, let’s read the data into a Pandas data frame:
首先,让我们将数据读取到Pandas数据框中:
import pandas as pd
df = pd.read_csv("winemag-data-130k-v2.csv")
Next, let’s print the first five rows of data:
接下来,让我们打印数据的前五行:
print(df.head())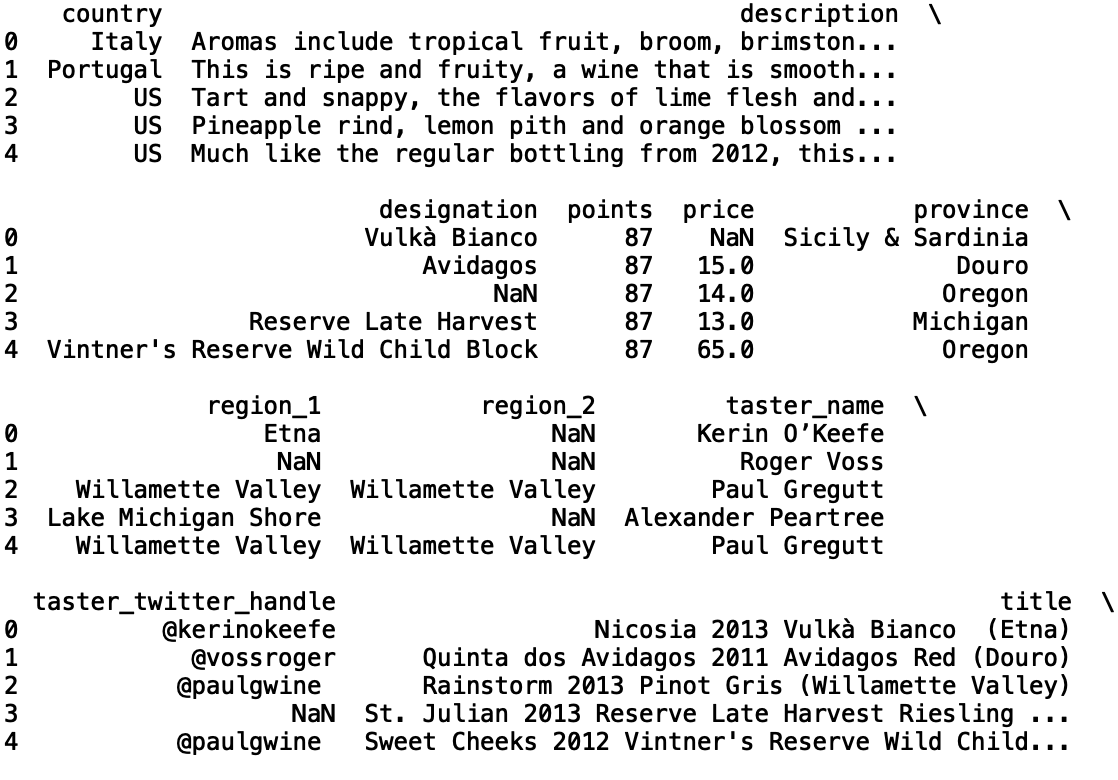

Let’s take a random sample of 500 records from this data. This will help with speeding up model training and testing, though it can easily be modified by the reader:
让我们从该数据中随机抽取500条记录。 尽管读者可以轻松地对其进行修改,但这将有助于加快模型训练和测试的速度:
import pandas as pd
df = pd.read_csv("winemag-data-130k-v2.csv").sample(n=500, random_state = 42)
Now, let’s print the info corresponding to our data which will give us an idea of which columns have missing values:
现在,让我们打印与数据相对应的信息,这将使我们了解哪些列缺少值:
print(df.info())
Several columns have less than 500 non-null values, which correspond to missing values. First let’s consider building a model that imputes missing ‘price’ values using the ‘points’. To start, let’s print the correlation between ‘price’ and ‘points’:
几列具有少于500个非空值,它们对应于缺失值。 首先,让我们考虑建立一个模型,该模型使用“点”来估算缺失的“价格”值。 首先,让我们打印“价格”和“点”之间的相关性:
print("Correlation: ", df['points'].corr(df['price']))
We see that there is a weak positive correlation. Let’s build a linear regression model that uses ‘points’ to predict the ‘price’. First, let’s import the ‘LinearRegresssion’ module from ‘scikit-learn’:
我们看到存在弱的正相关。 让我们构建一个线性回归模型,该模型使用“点”来预测“价格”。 首先,让我们从“ scikit-learn”导入“ LinearRegresssion”模块:
from sklearn.linear_model import LinearRegressionNow, let’s split our data for training and testing. We’d like to be able to predict missing values, but we should use ground truth ‘price’ values to validate our predictions. Let’s filter out the missing values by selecting only positive price values:
现在,让我们分割数据以进行培训和测试。 我们希望能够预测缺失的值,但是我们应该使用地面真实的“价格”值来验证我们的预测。 让我们通过仅选择正价格值来过滤掉缺失值:
import numpy as np
df_filter = df[df['price'] > 0].copy()
Let’s also initialize lists we will use to store our predictions and actual values:
让我们还初始化将用于存储预测和实际值的列表:
y_pred = []
y_true = []
We will use K-fold cross validation to validate our model. Let’s import the ‘KFolds’ module from ‘scikit-learn’. We will use 10 folds to validate our model:
我们将使用K折交叉验证来验证我们的模型。 让我们从“ scikit-learn”导入“ KFolds”模块。 我们将使用10折来验证我们的模型:
from sklearn.model_selection import KFold
kf = KFold(n_splits=10, random_state = 42)
for train_index, test_index in kf.split(df_filter):
    df_test = df_filter.iloc[test_index]
    df_train = df_filter.iloc[train_index]
We can now define our input and output:
现在我们可以定义输入和输出:
for train_index, test_index in kf.split(df_filter):
    ...
    X_train = np.array(df_train['points']).reshape(-1, 1)
    y_train = np.array(df_train['price']).reshape(-1, 1)
    X_test = np.array(df_test['points']).reshape(-1, 1)
    y_test = np.array(df_test['price']).reshape(-1, 1)
And fit our linear regression model:
并拟合我们的线性回归模型:
for train_index, test_index in kf.split(df_filter):
    ...
    model = LinearRegression()
    model.fit(X_train, y_train)
Now let’s generate and store our predictions:
现在让我们生成并存储我们的预测:
for train_index, test_index in kf.split(df_filter):
    ...
    y_pred.append(model.predict(X_test)[0])
    y_true.append(y_test[0])
Now let’s evaluate the performance of our model. Let’s use mean squared error to evaluate the performance of our model:
现在让我们评估模型的性能。 让我们使用均方误差来评估模型的性能:
print("Mean Square Error: ", mean_squared_error(y_true, y_pred))
We see that the performance isn’t too great. We can improve this by training on prices bound by the mean price plus one standard deviation:
我们看到性能不太好。 我们可以通过对受平ASP格加一个标准差约束的价格进行培训来改善这一点:
df_filter = df[df['price'] <= df['price'].mean() + df['price'].std() ].copy()
...
print("Mean Square Error: ", mean_squared_error(y_true, y_pred))
While this significantly improves performance this comes at the price of not being able to accurately impute values for highly priced wines. Instead of using a regression model of a single feature to predict price, we can used tree base models, such as random forests, which can handle categorical and numerical variables. Let’s build a random forest regression model that uses ‘country’, ‘province’, ‘variety’, ‘winery’ and ‘points’ to predict wine ‘price’. First, let’s convert the categorical variables into categorical codes that can be handled by the random forests model:
虽然这可以显着提高性能,但是却以无法准确估算高价葡萄酒的价格为代价。 代替使用单个功能的回归模型来预测价格,我们可以使用树基模型(例如随机森林)来处理分类变量和数值变量。 让我们建立一个随机的森林回归模型,该模型使用“国家”,“省”,“品种”,“酒厂”和“积分”来预测葡萄酒的“价格”。 首先,让我们将分类变量转换为可由随机森林模型处理的分类代码:
df['country_cat'] = df['country'].astype('category')
df['country_cat'] = df['country_cat'].cat.codesdf['province_cat'] = df['province'].astype('category')
df['province_cat'] = df['province_cat'].cat.codesdf['winery_cat'] = df['winery'].astype('category')
df['winery_cat'] = df['winery_cat'].cat.codesdf['variety_cat'] = df['variety'].astype('category')
df['variety_cat'] = df['variety_cat'].cat.codes
Let’s increase the random sample size to 5000 :
让我们将随机样本的大小增加到5000:
df = pd.read_csv("winemag-data-130k-v2.csv").sample(n=5000, random_state = 42)Next, let’s import the random forest regressor module from scikit-learn. Let’s also define the list of features we will use to train our model:
接下来,让我们从scikit-learn导入随机森林回归模块。 让我们还定义用于训练模型的功能列表:
from sklearn.ensemble import RandomForestRegressor
features = ['points', 'country_cat', 'province_cat', 'winery_cat', 'variety_cat']
Let’s train our model using a random forest with 1000 estimators and a max depth of 1000. Let’s then generate predictions and append them to a new list:
让我们使用具有1000个估计量和最大深度为1000的随机森林训练模型。然后生成预测并将其附加到新列表中:
for train_index, test_index in kf.split(df_filter):
    df_test = df_filter.iloc[test_index]
    df_train = df_filter.iloc[train_index]

    X_train = np.array(df_train[features])
    y_train = np.array(df_train['price'])
    X_test = np.array(df_test[features])
    y_test = np.array(df_test['price'])
    model = RandomForestRegressor(n_estimators = 1000, max_depth = 1000, random_state = 42)
    model.fit(X_train, y_train)    y_pred_rf.append(model.predict(X_test)[0])
    y_true_rf.append(y_test[0])
Finally, let’s evaluate the mean squared error for both the random forest and the linear regression models:
最后,让我们评估随机森林模型和线性回归模型的均方误差:
print("Mean Square Error (Linear Regression): ", mean_squared_error(y_true, y_pred))
print("Mean Square Error (Random Forest): ", mean_squared_error(y_pred_rf, y_true_rf))
We see that the random forests model has superior performance. Now, let’s predict the missing price values using our models and display sample predictions:
我们看到随机森林模型具有优越的性能。 现在,让我们使用我们的模型预测缺失的价格值并显示样本预测:
df_missing = df[df['price'].isnull()].copy()X_test_lr = np.array(df_missing['points']).reshape(-1, 1)
X_test_rf = np.array(df_missing[features])X_train_lr = np.array(df_filter['points']).reshape(-1, 1)
y_train_lr = np.array(df_filter['price']).reshape(-1, 1)X_train_rf = np.array(df_filter[features])
y_train_rf = np.array(df_filter['price'])model_lr = LinearRegression()
model_lr.fit(X_train_lr, y_train_lr)
print("Linear regression predictions: ", model_lr.predict(X_test_lr)[0][0])model_rf = RandomForestRegressor(n_estimators = 1000, max_depth = 1000, random_state = 42)
model_rf.fit(X_train_rf, y_train_rf)
print("Random forests regression predictions: ", model_rf.predict(X_test_rf)[0])
I’ll stop here but I encourage you to play around with feature selection and hyper-parameter tuning to see if you can improve performance. Further, I encourage you to extend this data imputation model to impute missing values in categorical fields such as ‘region_1’ and ‘designation’. Here you can build a tree-based classification model trained on categorical and numerical features to predict the missing values for the categories listed.
我将在这里停止,但我鼓励您尝试一下功能选择和超参数调整,以查看是否可以提高性能。 此外,我鼓励您扩展此数据归因模型,以归类诸如“ region_1”和“ designation”之类的类别中的缺失值。 在这里,您可以构建基于树的分类模型,该模型经过分类和数字特征训练,可以预测所列类别的缺失值。
结论 (CONCLUSIONS)
To summarize, in this post we discussed how to build machine learning models that we can use to impute missing values in data. First, we built a linear regression model trained on ‘points’ for reviewed wines to predict the price of wines. We then built a random forest model trained on ‘points’ and additional categorical variables to predict wine prices. We saw that the random forests model significantly outperformed the linear regression based data imputation model. I hope you found this post useful/interesting. The code from this post is available on GitHub. Thank you for reading!
总而言之,在这篇文章中,我们讨论了如何构建机器学习模型,我们可以使用该模型来估算数据中的缺失值。 首先,我们建立了一个基于“点”训练的线性回归模型,用于评价葡萄酒以预测葡萄酒的价格。 然后,我们建立了一个随机森林模型,该模型基于“点”和其他分类变量进行训练,以预测葡萄酒价格。 我们发现随机森林模型明显优于基于线性回归的数据归因模型。 我希望您发现这篇文章有用/有趣。 这篇文章中的代码可在GitHub上找到 。 感谢您的阅读!
翻译自: https://towardsdatascience.com/predicting-missing-values-with-python-41e581511117


 2363
2363

 被折叠的 条评论
为什么被折叠?
被折叠的 条评论
为什么被折叠?
 到【灌水乐园】发言


