


Schools and colleges regularly conduct tests. The basic idea behind this is to measure the performance of the students. To understand which is their strong subject and where they need to work harder. In a similar way, we also test our machine learning model to measure their performance and based on this performance we try to understand what the model is doing right and where it needs to work harder (basically we need to work harder)
学校和学院定期进行测试。 这背后的基本思想是衡量学生的表现。 要了解哪个是他们的强项,以及他们需要在哪里努力工作。 以类似的方式,我们还测试了机器学习模型以衡量其性能,并基于此性能,尝试了解该模型在做什么正确,以及在哪里需要更努力地工作(基本上,我们需要更加努力地工作)
In the field of machine learning, other than building models, it's equally important to measure the performance of the model. Basically, we check how good are the predictions made by our model.
在机器学习领域中,除了构建模型之外,衡量模型的性能同样重要。 基本上,我们检查我们的模型所做的预测有多好。
In this series of articles, we will try to understand what are the various performance measures of a model.
在本系列文章中,我们将尝试了解模型的各种性能指标。
准确性 (Accuracy)
This is probably the simplest performance metrics. It is defined as:
这可能是最简单的性能指标。 它定义为:
Accuracy value lies between 0 and 1. If the value is closer to 0 it's considered as bad performance, whereas if the value is closer to 1 then its considered good performance. It is one of the simplest and easy to understand metric.
精度值介于0和1之间。如果该值接近0,则认为是性能不佳;而如果该值接近1,则认为其性能良好。 它是最简单易懂的指标之一。
Let’s understand this metric using an example:
让我们通过一个例子来了解这个指标:
Assume we have already trained our model using training data. Now, we want to use the test data and check how accurate the predictions are. Let's say we have a classification problem with 100 data points in our test data set. The objective is to classify whether the point is positive or negative. Assume out of the 100 points, we have 60 positive points and 40 negative points (Note that this is the original/actual class label). Now, when we feed this test data to our model and suppose we get the below output:
假设我们已经使用训练数据训练了模型。 现在,我们要使用测试数据并检查预测的准确性。 假设我们在测试数据集中有100个数据点的分类问题。 目的是对该点是正面还是负面进行分类。 假设在100分中,我们有60个正点和40个负点(请注意,这是原始/实际分类标签)。 现在,当我们将此测试数据提供给我们的模型并假设获得以下输出时:

So basis the above example, our model has misclassified 7 points as negative and 5 points as positive. So overall misclassified points = 7+5 = 12.
因此,根据上面的示例,我们的模型将7点错误分类为负面,将5点错误分类为正面。 因此,总的错误分类分数= 7 + 5 = 12。
So the accuracy of the model can be calculated as:
因此,模型的准确性可以计算为:

Now that we have understood how to calculate accuracy, let's understand some of the problems associated with it.
既然我们已经了解了如何计算精度,那么让我们了解一些与精度相关的问题。
数据集不平衡 (Imbalanced data set)
Let's say we have a model that returns negative class as my output. Now, suppose we have an imbalanced data set which is also my test data set, and say 90% of the total test data set is negative. Now when we input this test data to our model, we will get 90% of the classification correct as my model returns negative class label and 90% of my test data set is negative. In such a scenario, even the dumb model gives me an accuracy of 90%. So stay away from accuracy when you have an imbalanced data set.
假设我们有一个返回负类作为我的输出的模型。 现在,假设我们有一个不平衡的数据集,它也是我的测试数据集,并且说总测试数据集的90%是负数。 现在,当我们将此测试数据输入到模型中时,由于我的模型返回负类标签,而我们的测试数据集的90%为负,因此我们将获得90%的正确分类。 在这种情况下,即使是哑巴模型也能给我90%的精度。 因此,当数据集不平衡时,请远离准确性。
准确性不考虑概率分数 (Accuracy doesn’t consider probability scores)
Consider the below example to understand this:
请看下面的例子来理解这一点:

x ➜ Datapoints
x➜数据点
y ➜ Actual class label
y➜实际班级标签
M1➜ Probability score of model M1
M1➜模型M1的概率得分
M2 ➜ Probability score of model M2
M2 model模型M2的概率得分
Y1 ➜ Predicted class label of model M1
Y1➜预测的M1型标签
Y2 ➜ Predicted class label of model M2
Y2➜预测的M2型标签
Let's assume we ran our data through 2 models M1 and M2 and these models returned the probability scores. So given a data point, we get a probability of P(y=1).
假设我们通过2个模型M1和M2运行数据,并且这些模型返回了概率得分。 因此,给定一个数据点,我们得到P(y = 1)的概率。
M1 can be read as the probability score of x1 having y1=1 is 0.9 when ran through model M1. Similarly, the probability score of x3 having y3=1 is 0.1, which means the probability of y3=1 is very less when ran through model M1 (means P(y3=0) = 0.9).
当通过模型M1运行时,可以将M1读为y1 = 1的x1的概率得分为0.9。 类似地,具有y3 = 1的x3的概率得分为0.1,这意味着当通过模型M1运行时y3 = 1的概率非常小(平均值P(y3 = 0)= 0.9)。
Consider x1. For x1, the actual class label is 1. Our model M1 gives a probability score of P(y=1) = 0.9 and is predicted to belong to class label 1. On the other hand model, M2 gives a probability score of P(y=1) = 0.6, and hence it is also classified as class label 1. But if we consider the probability scores, its clear that my model M1 is performing better than my model M2. Similarly, for x2, x3, and x4 the probability scores of model M1 are much better compared to model M2. However, their predicted class labels remain the same in both models. Accuracy as a measure doesn’t distinguish which model is better since it doesn’t use probability scores. It can only use predicted class labels and since it uses predicted class labels to calculate accuracy it will say that model M1 and M2 have the same accuracy but from probability scores, it is clear that M1 is better than M2.
考虑x1。 对于x1,实际类别标签为1。我们的模型M1给出概率得分P(y = 1)= 0.9,并且被预测为属于类别标签1。另一方面,模型M2给出概率得分为P( y = 1)= 0.6,因此它也被分类为类别标签1。但是,如果考虑概率得分,很明显我的模型M1比我的模型M2表现更好。 类似地,对于x2,x3和x4,与模型M2相比,模型M1的概率得分要好得多。 但是,它们的预测类别标签在两个模型中都相同。 准确性作为一种度量不能区分哪个模型更好,因为它不使用概率分数。 它只能使用预测的类别标签,并且由于使用预测的类别标签来计算准确性,因此可以说模型M1和M2具有相同的准确性,但是从概率分数来看,很明显M1优于M2。
混淆矩阵 (Confusion Matrix)
To understand the confusion matrix, let's take a binary classification task where the objective is to classify the class label as either 0 (negative) or 1 (positive). Let's construct the confusion matrix for the same.
为了理解混淆矩阵,让我们进行一个二进制分类任务,目标是将类标签分类为0(负)或1(正)。 让我们为它构造混淆矩阵。
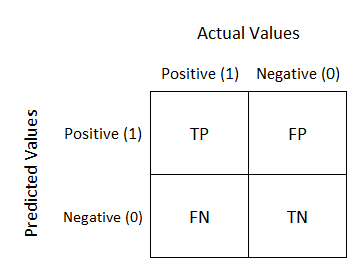
TN ➜ True NegativeFN ➜ False NegativeFP ➜ False PositiveTP ➜ True PositiveN ➜ Total no. of negative pointsP ➜ Total no. of positive points
TN➜真负FN➜假负FP➜假正TP➜真正N➜总编号 负点数P➜总数 积极点
Let's understand each of the above terms:
让我们了解以上每个术语:
True Negative ➔ when the actual value is 0 and the model predicted value is also 0
实际值为0并且模型预测值为0时为True负 ➔
False Negative ➔ when the actual value is 1 and the model predicted value is 0
假负 ➔实际值为1且模型预测值为0时
True Positive ➔ when the actual value is 1 and the model predicted value is also 1
实际值为1且模型预测值为1时为True正 ➔
False Positive ➔ when the actual value is 0 and the model predicted value is 1
假正 ➔实际值为0且模型预测值为1时
Now that we have understood how to construct a confusion matrix and also its basic terminologies, let's understand some of the key metrics associated with it.
现在,我们已经了解了如何构造混淆矩阵及其基本术语,下面让我们了解与之相关的一些关键指标。
True Positive Rate (TPR) = # of TP / Total # of P
真实阳性率(TPR)= TP数量/ P总数
True Negative Rate (TNR) = # of TN / Total # of N
真实负利率(TNR)= TN数量/ N总数
False Positive Rate (FPR) = # of FP / Total # of N
误报率(FPR)= FP数量/ N总数
False Negative Rate (FNR) = # of FN / Total # of P
假阴性率(FNR)= FN数量/ P总数
Precision = TP / (TP + FP)It means, of all the points the model predicted to be positive, what % of them are actually positive. In precision, we are not bothered about the negative class. Our only focus is on the positive class label.
精度= TP /(TP + FP)这意味着在模型预测为阳性的所有点中,实际上有多少是阳性。 准确地说,我们不关心否定类。 我们唯一的重点是积极的阶级标签。
Recall = TPR = TP / Total # of PIt means, of all the points that “actually” belong to class label 1, how many the model predicted to be class label 1.
召回= TPR = TP / PIt的总数#表示在“实际上”属于类标签1的所有点中,有多少模型预计为类标签1。
For a good model, we would always want the values of precision and recall to be high.
对于一个好的模型,我们总是希望精度和召回率都很高。
F1-score:It’s the combination of both metrics precision and recall and is given as follows:
F1分数:它是指标精度和召回率的结合,如下所示:

结论 (Conclusion)
So far we have covered the accuracy and confusion matrix and we also understood various terms under confusion matrix. In the second part of this series, we’ll understand ROC and AUC, log loss, co-efficient of determination, and median absolute deviation of errors.
到目前为止,我们已经涵盖了准确性和混淆矩阵,并且我们也了解了混淆矩阵下的各种术语。 在本系列的第二部分中,我们将了解ROC和AUC,对数损失,确定系数以及误差的中值绝对偏差。
Until then, Happy Learning!
在此之前,祝您学习愉快!
迪帕克·贾恩(Deepak Jain) (Deepak Jain)
If you enjoyed this, follow me on Medium for more
如果您喜欢这个,请 在Medium上 关注我 以了解更多
Let’s connect on LinkedIn
让我们在 LinkedIn上建立联系
翻译自: https://towardsdatascience.com/performance-measures-of-models-51aee741a36f


 1617
1617


 被折叠的 条评论
为什么被折叠?
被折叠的 条评论
为什么被折叠?
 到【灌水乐园】发言


