


机器学习 放射学 图像
Lung cancer has been one of the leading causes of cancer-related deaths in Canada because of its high incidence and low survival rate. Based on the 2012–2014 data, the 5-year survival rate for lung cancer is 19%, while lung cancer is one of the four most commonly diagnosed cancers in Canada. The most common type of lung cancer is non-small-cell lung carcinoma (NSCLC).
由于肺癌的高发病率和低存活率,它一直是加拿大癌症相关死亡的主要原因之一。 根据2012-2014年的数据,肺癌的5年生存率是19%,而肺癌是加拿大最常被诊断的四种癌症之一。 肺癌最常见的类型是非小细胞肺癌(NSCLC)。
The survival outcomes are strongly dependent on the staging of the disease when it is diagnosed, but one can wonder if there are other factors at play. Is it possible to use diagnostic images that are often obtained as part of the treatment workflow and derive additional prognostic values from them? I tried to use various machine learning models to find out.
诊断结果时,其生存结果在很大程度上取决于疾病的分期,但是人们可能想知道是否还有其他因素在起作用。 是否可以使用通常在治疗工作流程中获得的诊断图像并从中得出其他预后价值? 我试图使用各种机器学习模型来找出答案。
(1) Dataset
(1)数据集
This may be the hard part since patient data is usually confidential. Fortunately, machine learning techniques are finding their way into diagnostic radiology. Radiologists and medical physicists are embracing the “open data” culture. I used the NSCLC data set from the Cancer Imaging Archive:
这可能是困难的部分,因为患者数据通常是机密的。 幸运的是,机器学习技术正在进入诊断放射学。 放射科医生和医学物理学家正在拥抱“开放数据”文化。 我使用了来自癌症影像档案馆的NSCLC数据集:
Along with the image sets, there is also a separate text file containing information on age, sex, staging, histology, and most importantly, survival time and survival outcome. All the CT images have also been contoured by oncologists, which ensures consistency in the accuracy. (I have never been an oncologist, so you can see how contours drawn by me will be problematic.)
除图像集外,还有一个单独的文本文件,其中包含有关年龄,性别,分期,组织学以及最重要的是生存时间和生存结果的信息。 所有的CT图像也已由肿瘤科医生绘制轮廓,以确保准确性的一致性。 (我从来没有当过肿瘤科医生,所以您可以看到我绘制的轮廓有问题。)
(2) Data wrangling
(2)数据整理
Among the 422 CT image sets, 2 of them were found to have the contours not matching the tumour. I removed them from my analysis.
在422个CT图像集中,发现其中2个的轮廓与肿瘤不匹配。 我从分析中删除了它们。
Then I used the Pyradiomics library — more specifically, the Pyradiomics plugin of the open-source radiotherapy analysis software SlicerRT — to extract the features.
然后,我使用了Pyradiomics库(更具体地说,是开源放射疗法分析软件SlicerRT的Pyradiomics插件)来提取特征。
https://pyradiomics.readthedocs.io/en/latest/
https://pyradiomics.readthedocs.io/en/latest/
To remove some of the multicollinearity in the features, I used pair plots to visually inspect the features. Yes, there is a lot of them:
为了消除特征中的某些多重共线性,我使用了对图来直观地检查特征。 是的,其中有很多:
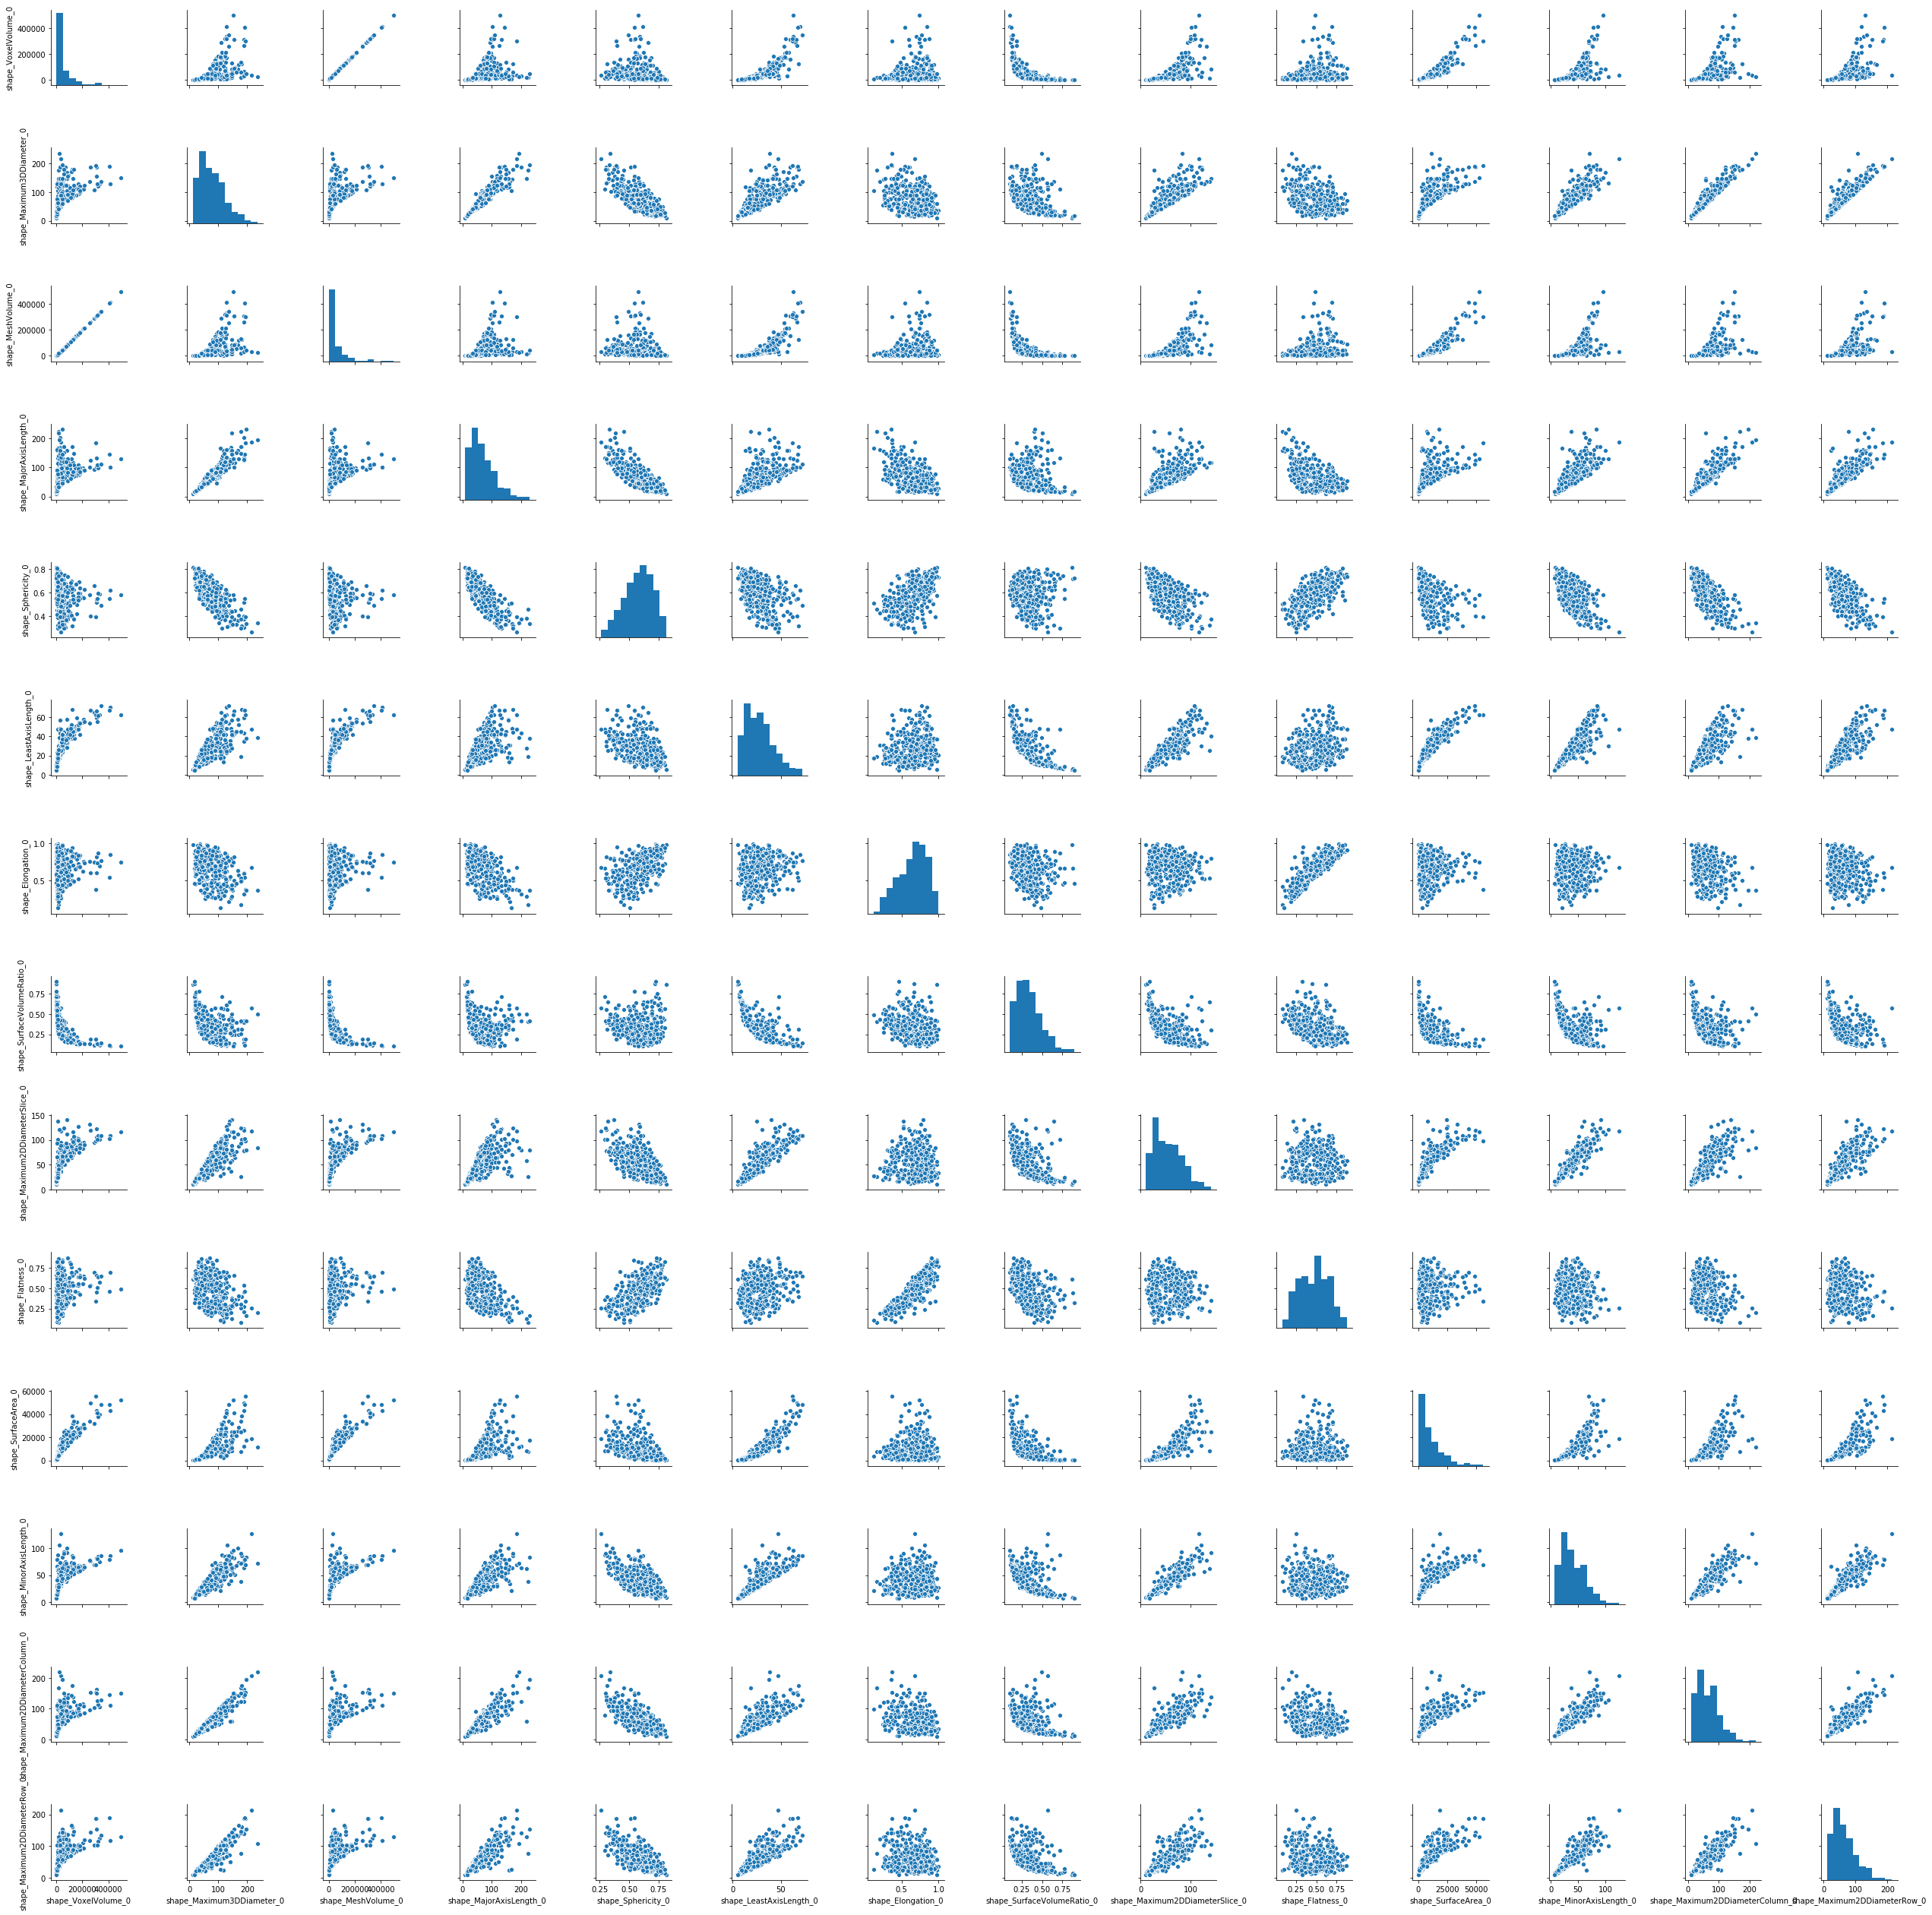
The criterion for leaving out features is if two or more features have a pairwise correlation coefficient larger than 0.95, then only one is kept.
遗漏特征的标准是,如果两个或多个特征的成对相关系数大于0.95,则仅保留一个特征。
The Seaborn pairplot function is nice to use because it also gives the probability distribution of the feature. This provides me with a way to skim and inspect any highly skewed distributions. If it looks highly skewed, then I would use either a logarithmic transform or, failing that, a Box-Cox transform to make the data less skewed. I used a QQ-plot to check for normalcy.
Seaborn对图函数很好用,因为它还给出了特征的概率分布。 这为我提供了一种浏览和检查任何高度偏斜分布的方法。 如果它看起来高度偏斜,那么我将使用对数变换,或者如果不成功,则使用Box-Cox变换来减少数据偏斜。 我使用QQ图检查正常情况。

(3) Machine Learning — Methodology
(3)机器学习-方法论
I have divided my project into two parts:
我将项目分为两个部分:
(3.1) Supervised machine learning: I tried to use various classification techniques to predict whether the patient can survive past the 1-year, 3-year and 5-year mark. Originally I was considering doing a linear regression to predict the survival time, but a lot of the patients did not expire at the survival time, which means their definite survival time is not known. The classification problem instead would allow me to keep the patients who had survived past the specific point in time regardless of their final survival status (i.e. dead or alive).
(3.1)有监督的机器学习 :我尝试使用各种分类技术来预测患者是否可以存活超过1年,3年和5年。 最初,我考虑进行线性回归来预测生存时间,但是很多患者并未在生存时间到期,这意味着他们的确切生存时间尚不清楚。 相反,分类问题将使我能够保留在特定时间点之后仍然存活的患者,而不管其最终存活状态(即死亡还是活着)。
I used a grid search and 5-fold validation to optimize the models. The models were:- logistic regression with regularization- support vector machine- random forest- quadratic discriminant- decision trees- XGBoost decision trees- neural network
我使用了网格搜索和5倍验证来优化模型。 这些模型是:-带正则化的逻辑回归-支持向量机-随机森林-二次判别-决策树-XGBoost决策树-神经网络
There was also a class imbalance problem, especially for the 3-year and 5-year classification problems. To rectify this, I used various flavours of oversampling methods (SMOTE and SVMSMOTE). The oversampling method was also incorporated in the grid search optimization pipeline.
还存在班级失衡问题,尤其是3年和5年分类问题。 为了解决这个问题,我使用了多种形式的过采样方法(SMOTE和SVMSMOTE)。 过采样方法也并入了网格搜索优化管道。
To eliminate some of the noise, I also used principal component analysis to compare the effect that the number of principal components has on the performance of the model.
为了消除一些噪声,我还使用了主成分分析来比较主成分数量对模型性能的影响。
(3.2) Unsupervised machine learning: I constructed tumour types by clustering based on their features in the CT image. Then I used the Kaplan-Meier estimator to compute the median survival time for each cluster. This had the advantage of keeping all patients in the analysis since the Kaplan-Meier estimator could handle censured events. After clustering the data, I looked at the features that were most statistically different in their distributions across the clusters by ranking their p-values from smallest to biggest.
(3.2)无监督机器学习 :我根据肿瘤在CT图像中的特征进行聚类,从而构建了肿瘤类型。 然后,我使用Kaplan-Meier估计器来计算每个群集的中值生存时间。 由于Kaplan-Meier估计器可以处理受谴责的事件,因此具有将所有患者保留在分析中的优势。 在对数据进行聚类之后,我通过将它们的p值从最小到最大进行排名,研究了在整个分布中统计上差异最大的特征。
I used k-means clustering and OPTICS clustering (a density-based clustering algorithm). How did I determine the number of clusters for k-means clustering? I looked at the inertia and looked at the “elbow point”, and then I played around since two clusters had their Kaplan-Meier curves almost overlapping each other.
我使用了k均值聚类和OPTICS聚类(基于密度的聚类算法)。 如何确定k均值聚类的聚类数目? 我看着惯性,然后看着“肘点”,然后我就玩了,因为两个星团的Kaplan-Meier曲线几乎互相重叠。
(4) Results
(4)结果
Supervised learning model:
监督学习模型:
I hate to sell myself short, but the findings here are not terribly exciting:
我讨厌卖空自己,但是这里的发现并不令人兴奋:
Although we see some models having an accuracy of more than 80%, bear in mind that this is mainly due to class imbalance. For the 5-year classification problem, for instance, the class imbalance was about 80:20 because most of the patients, unfortunately, did not survive that long. SMOTE and using f1-score to optimize the model did not help.
尽管我们看到某些模型的准确率超过80%,但请记住,这主要是由于类别不平衡所致。 例如,对于5年分类问题,班级失衡约为80:20,因为不幸的是,大多数患者都没有存活那么长时间。 SMOTE和使用f1-score优化模型没有帮助。
Unsupervised learning model:
无监督学习模型:
OPTICS yielded one main cluster and more than 400 outliers, so it was not particularly useful. K-means yielded three clusters at the end:
OPTICS产生了一个主群集和400多个离群值,因此它并不是特别有用。 最后,K均值产生了三个聚类:

If we look closely, the blue curve lies above the orange curve significantly (i.e. their confidence bands do not overlap for some part of the curve). That is promising. Indeed, the 1-year and 3-year survival probabilities for the blue and orange clusters are significantly different (p < 0.005). Then I ran a t-test for each of the features in the two clusters and looked at the p-values. It turns out the feature that is most different between the blue and orange cluster has to do with the gray level non-uniformity, which describes how non-uniform the tumour is in the CT image. Namely, the cluster associated with lower survivability tends to be composed of tumours that appear more non-uniform in the CT image.
如果我们仔细观察,蓝色曲线明显位于橙色曲线上方(即,它们的置信带在曲线的某些部分不重叠)。 那是有希望的。 确实,蓝色和橙色星团的1年和3年生存概率显着不同(p <0.005)。 然后,我对两个聚类中的每个要素进行了t检验,并查看了p值。 事实证明,蓝色和橙色簇之间最不同的特征与灰度不均匀有关,后者描述了CT图像中肿瘤的不均匀程度。 即,与较低的生存能力相关的簇倾向于由在CT图像中显得更加不均匀的肿瘤组成。
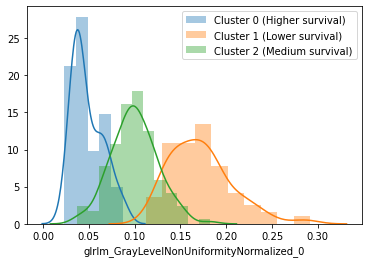
At first, I thought the size would be the main factor, but in reality, size did not come in among the top 5 distinguishing features.
起初,我认为尺寸是主要因素,但实际上,尺寸并没有排在前五位。
(5) Applications
(5)应用
Before using them in a clinical setting, there are certain points that need to be addressed:
在临床环境中使用它们之前,需要注意以下几点:
(5.1) Are the features clinically stable? The features are extracted from patients at one point in time. But what if the patient was to be rescanned, say, after 15 minutes because the first set of CT images had some problems? Would the features change so much that it changed the outcome from the model?
(5.1)这些特征在临床上是否稳定? 在某个时间点从患者中提取特征。 但是,如果要在15分钟后重新扫描患者,因为第一组CT图像出现问题,该怎么办? 功能会发生很大变化,从而改变模型的结果吗?
(5.2) Does additional information change the prognosis? In this study, the histology of the tumour, the staging of the tumour, sex and age of the patient, the location of the tumour and the prescribed treatment were not considered. Surely that would have some bearing on the patient’s survival. For example, a lung tumour nodule that is located closer to the heart is more likely to result in higher toxicity from radiation therapy because of the inadvertent spill-over of the radiation dose.
(5.2)其他信息会改变预后吗? 在这项研究中,未考虑肿瘤的组织学,肿瘤的分期,患者的性别和年龄,肿瘤的位置和处方治疗。 当然,这将对患者的生存产生影响。 例如,由于放射剂量的意外溢出,更靠近心脏的肺肿瘤结节更有可能导致放射治疗产生更高的毒性。
The location of the tumour may be able to be taken into account by incorporating a convolutional neural network that takes in the whole CT image and not just the masked portion (i.e. the tumour). The problem, however, is that the length of the CT image set can differ from patient to patient due to the differing scan lengths.
通过结合一个卷积神经网络可以考虑到肿瘤的位置,该卷积神经网络不仅可以吸收被遮盖的部分(即肿瘤),而且可以吸收整个CT图像。 然而,问题在于,由于不同的扫描长度,CT图像集的长度可能因患者而异。
Any questions or comments? Please let me know.
有任何问题或意见吗? 请告诉我。
机器学习 放射学 图像


 1025
1025


 被折叠的 条评论
为什么被折叠?
被折叠的 条评论
为什么被折叠?
 到【灌水乐园】发言


