


贝叶斯判别分析器
Sentiment Analysis is contextual mining of text which identifies and extracts subjective information in the source material and helping a business to understand the social sentiment of their brand product or service while monitoring online conversations. So basically, here I have used the IMDb 50k Movie Review dataset to predict whether a given movie review strikes the positive sentiment or the negative sentiment. I have used Naive Bayes here because it outperforms most other Machine Learning Algorithms when the data is textual. Though I will be using some NLP libraries, the basic focus would be on using Naive Bayes. The accuracy of my predictions is coming out to be more or less 89 %. So I would say not bad. You can use other techniques like Bert or various Deep Learning techniques to increase the accuracy further.
情感分析是对文本的上下文挖掘,该文本识别和提取源材料中的主观信息,并帮助企业在监视在线对话的同时了解其品牌产品或服务的社会情感。 因此,基本上,这里我使用了IMDb 50k电影评论数据集来预测给定的电影评论是正面情绪还是负面情绪。 我在这里使用过朴素贝叶斯(Naive Bayes),因为当数据为文本时,它优于大多数其他机器学习算法。 尽管我将使用一些NLP库,但基本重点是使用朴素贝叶斯。 我的预测准确性大约为89%。 所以我会说还不错。 您可以使用其他技术(例如Bert)或各种深度学习技术来进一步提高准确性。
Let us take our baby steps towards Natural Language Processing using Naive Bayes:33
让我们迈出第一步,使用朴素贝叶斯(Naive Bayes)进行自然语言处理:33
To know About Naive Bayes you can Refer the following:
要了解关于朴素贝叶斯,您可以参考以下内容:
让我们开始吧 (Let’s get Started)
So our target would be to convert the entire textual reviews into a Bag of Words i.e to convert each unique word in our dataset to a column name and simply storing the frequency count of each word in each row of a review. Our steps involved in the process would be:
因此,我们的目标是将整个文本评论转换为词袋,即将数据集中的每个唯一单词转换为列名,然后简单地将每个单词的频率计数存储在评论的每一行中。 该过程涉及的步骤如下:
Text preprocessing
文字预处理
Vectorize(Bag of Words)
Vectorize(单词袋)
Creating a Machine Learning Model
创建机器学习模型
Deployment
部署方式
文字预处理 (Text Preprocessing)
So at first, we have to analyze and clean the data before fitting into the ML models otherwise we will get…..
因此,首先,我们必须先分析并清理数据,然后再拟合到ML模型中,否则我们将获得.....

The steps involved in data cleaning are
数据清理涉及的步骤是
Remove HTML tags
删除HTML标签
Remove special characters
删除特殊字符
Convert everything to lowercase
将所有内容转换为小写
Remove stopwords
删除停用词
Stemming
抽干
We will import the necessary libraries at first that we are going to need for our sentiment analyzer.
首先,我们将导入情感分析器所需的必要库。
First, we are going to need NumPy and pandas, our essential data science tools. “Re” stands for regular expression which is used to extract a certain portion of a string. Nltk is an NLP library and we are going to import it in certain parts of our code to process the textual data. Then we are going to import sklearn for model creation. We are also importing some metrics from sklearn to analyze model performance.
首先,我们将需要NumPy和pandas ,这是我们必不可少的数据科学工具。 “ Re”代表正则表达式 ,用于提取字符串的特定部分。 Nltk是一个NLP库 ,我们将在代码的某些部分中将其导入以处理文本数据。 然后,我们将导入sklearn以进行模型创建。 我们还从sklearn导入了一些指标来分析模型性能。
Then we will import our dataset and casually go through it just to get a rough idea about the data provided to us.
然后,我们将导入我们的数据集,并随意进行遍历,以大致了解提供给我们的数据。

So we have 50000 rows with only one feature column that is the “review”. You can already see the HTML tags that need processing.
因此,我们有50000行,其中只有一个要素列是“评论”。 您已经可以看到需要处理HTML标记。
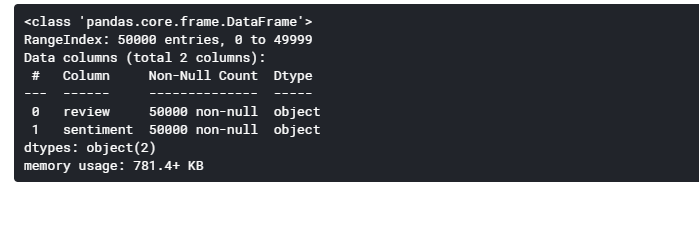
There are know missing values as we can see from above. Phew!!
从上面我们可以看到缺少的值。 ew!
Now we will convert the positive sentiment with 1 and the negative sentiment with -1. We get
现在,我们将正情绪转换为1,将负情绪转换为-1。 我们得到

删除HTML标签 (Removing HTML tags)
We will now remove the HTML tags with the help of “regular expression” library from python. This is used to extract a part of the string that follows a certain pattern. For example, if somehow the phone number and the email id are merged into one column and we want to create two separate columns, one for the phone numbers and the other for the email id. It would be impossible for us to manually compute each row. In that case, we use regular expression (also known as regex). To know more about regex click here.
现在,我们将借助python中的“ 正则表达式 ”库删除HTML标签。 这用于提取遵循特定模式的字符串部分。 例如,如果以某种方式将电话号码和电子邮件ID合并到一列中,而我们想创建两个单独的列,一列用于电话号码,另一列用于电子邮件ID。 对于我们来说,手动计算每一行是不可能的。 在这种情况下,我们使用正则表达式(也称为regex)。 要了解有关正则表达式的更多信息, 请单击此处。

As you can see all the HTML tags have been removed.
如您所见,所有HTML标记均已删除。
删除特殊字符 (Remove special characters)
We don’t want the punctuation signs or any other non-alphanumeric characters in our Bag of Words, so we will remove those.
我们不希望我们的单词袋中使用标点符号或任何其他非字母数字字符,因此我们将其删除。

All the non-alphanumeric characters have been removed.
所有非字母数字字符均已删除。
将所有内容转换为小写 (Convert everything to lowercase)
For better analysis, we will convert everything to lower case.
为了更好的分析,我们将所有内容都转换为小写。

删除停用词 (Removing stopwords)
Stopwords are those words that might not add much value to the meaning of the document. So converting these words into our Bag of words column would be a waste of time and space. These will add an unnecessary feature to our dataset and may affect our correctness of the predictions. These are articles, prepositions, or conjunctions like “the”, “is”, “in”, “for”, “where”, “when”, “to”, “at” etc. The “nltk” library of python for Natural Language Processing comes with a class where all the probable stopwords are stored. For this purpose, we import “stopwords” from the “nltk. corpus” library for processing stop words.
停用词是那些可能不会给文档含义带来太大价值的词。 因此,将这些单词转换为“单词袋”列将浪费时间和空间。 这些将为我们的数据集添加不必要的功能,并可能影响我们对预测的正确性。 这些是文章,介词或连词,例如“ the”,“ is”,“ in”,“ for”,“ where”,“ when”,“ to”,“ at”等。python的“ nltk ”库自然语言处理附带了一个类,其中存储了所有可能的停用词。 为此,我们从“ nltk ”中导入“停用词” 。 语料库”库,用于处理停用词。

It returns a list of all the words without stopwords.
它返回所有不带停用词的单词的列表。
抽干 (Stemming)
This means words that have different forms of the same common word has to be removed. The basic agenda of stemming is reducing a word to its word stem that affixes to suffixes and prefixes or the roots of words known as a lemma. Stemming is important in natural language understanding (NLU) and natural language processing (NLP). Suppose we are given words like playing, played, play- all these words have the same stem word known as “play”. The only word that would be useful as a vector in our Bag of Words is “play”. Other words would not contribute significant meaning to our dataset or predictions and these are unnecessary. The “nltk” library again comes with a class for stemming words. Here we import “SnowballStemmer” from the “nltk.stem” library for the purpose.
这意味着必须删除具有相同公共字词不同形式的字词。 词干的基本议程是将一个词减少为其词干,该词干附有后缀和前缀或称为词根的词根。 词干在自然语言理解(NLU)和自然语言处理 ( NLP )中很重要。 假设我们给了类似玩耍,玩耍,玩耍的单词,所有这些单词都具有称为“玩耍”的相同词干。 在我们的“词袋”中,唯一可用作向量的词是“游戏”。 其他词语不会对我们的数据集或预测起重要作用,而这些都是不必要的。 “ nltk”库再次带有词干类。 为此,我们从“ nltk.stem ”库中导入“ SnowballStemmer ”。

With this, we are done with our text processing.
这样,我们就完成了文本处理。
形成单词袋并将其实现到我们的模型中 (Forming Bag of Words and implementing them into our model)
As I have mentioned earlier, like all other Natural Language Processing methods we have to vectorize all the unique words and store the frequency of each word as their datapoint. In this article, we will be vectorizing the unique words with
如前所述,像所有其他自然语言处理方法一样,我们必须向量化所有唯一单词并将每个单词的频率存储为它们的数据点。 在本文中,我们将使用
- CountVectorizer CountVectorizer
- TfidfVectorizer TfidfVectorizer
We will construct a separate model for both of these vectorizers and check their accuracy.
我们将为这两种矢量化器构建一个单独的模型,并检查其准确性。
使用CountVectorizer建立模型 (Building Model with CountVectorizer)
CountVectorizer simply converts all the unique words into columns and store their frequency count. It is the simplest vectorizer used in Machine Learning.
CountVectorizer只需将所有唯一字转换为列并存储其频率计数。 它是机器学习中使用的最简单的矢量化程序。

Now we will split the data
现在我们将拆分数据
Then we will create our models and fit the data into them. Here we will be using GaussianNB, Multinomial NB, and Bernoulli NB.
然后,我们将创建模型并将数据拟合到其中。 在这里,我们将使用GaussianNB,Multinomial NB和Bernoulli NB。
We will understand the performance of the model by calculating the accuracy score, precision score, and recall score. You will say we can very well say the performance of the model by calculating the accuracy score. But it is not that simple dear. So let us understand it. In our classification model, we can predict the performance considering the following factors:
我们将通过计算准确性得分,准确性得分和召回得分来了解模型的性能。 您会说我们可以通过计算准确性得分很好地说明模型的性能。 但这不是那么简单的亲爱的。 因此,让我们了解它。 在我们的分类模型中,我们可以考虑以下因素来预测性能:
True Positives (TP) — These are the correctly predicted positive values which mean that the value of the actual class is positive and the value of the predicted class is also positive.
真实正值(TP) -这些是正确预测的正值,这意味着实际类别的值是正,而预测类别的值也是正。
True Negatives (TN) — These are the correctly predicted negative values which mean that the value of the actual class is negative and the value of the predicted class is also negative.
真实负数(TN) -这些是正确预测的负值,这意味着实际类别的值是负的,而预测类别的值也是负的。
False Positives (FP) — When the actual class is negative and the predicted class is positive.
误报(FP) -当实际类别为负面并且预测类别为正面时。
False Negatives (FN) — When actual class is positive but predicted class is negative.
假阴性(FN) -当实际分类为正但预测分类为负时。
Accuracy — Accuracy is the most intuitive performance measure and it is simply a ratio of correctly predicted observation to the total observations. One may think that, if we have high accuracy then our model is best. Yes, accuracy is a great measure but only when you have symmetric datasets where values of false positive and false negatives are almost the same. Therefore, you have to look at other parameters to evaluate the performance of your model
准确性 -准确性是最直观的性能指标,它只是正确预测的观测值与总观测值的比率。 可能有人认为,如果我们具有很高的准确性,那么我们的模型是最好的。 是的,准确性是一个很好的衡量标准,但是只有当您拥有对称数据集时,假阳性和假阴性的值几乎相同。 因此,您必须查看其他参数以评估模型的性能
Accuracy = TP+TN/TP+FP+FN+TN
精度 = TP + TN / TP + FP + FN + TN
Precision -is the ratio of correctly predicted positive observations to the total predicted positive observations. The question that this metric answer is of all reviews that were labeled as positive, how many were positive?
精度 -是正确预测的阳性观察值与总预测的阳性观察值的比率。 这个度量标准答案是所有被标记为肯定的评论的问题,有多少是肯定的?
Precision = TP/TP+FP
精度 = TP / TP + FP
Recall -is the ratio of correctly predicted positive observations to all observations in actual class — yes. The question recall answers are: Of all the truly positive reviews, how many did we label?
回忆-是正确预测的积极观察与实际课堂中所有观察的比率-是。 回想问题的答案是:在所有真正积极的评论中,我们标记了多少?
Recall = TP/TP+FN
召回 = TP / TP + FN
So let us check the scores:
因此,让我们检查分数:

By far Bernoulli NB is acting as the best predictor here with an accuracy of 82.8%, precision of 81.6 %, and recall of 84.5 %. Thus we can say the model is performing well on the data.
到目前为止,Bernoulli NB以82.8%的准确 度 , 81.6%的准确度和84.5 %的召回率充当最佳预测器。 因此,可以说该模型在数据上表现良好。
我们可以进一步提高高斯朴素贝叶斯的性能 (We can further increase the performance of Gaussian Naive Bayes)
In Gaussian naive Bayes the algorithm assumes the data to be normally distributed for a particular feature. This assumption is very wrong. In most cases, the data would not be normally distributed. It might be skewed. Moreover, the smoothening factor also varies depending on the data which determines the accuracy of GaussianNB. So here we will use the PowerTransformer class which makes the numerical features normally distributed so they can perform well on GaussianNB. Then we will use GridSearchCV to find the best smoothening factor.
在高斯朴素贝叶斯算法中,算法假设数据针对特定特征正态分布。 这个假设是非常错误的。 在大多数情况下,数据不会以正态分布。 它可能会倾斜。 此外,平滑因子还取决于确定高斯NB精度的数据。 因此,在这里我们将使用PowerTransformer类,该类使数值特征呈正态分布,以便它们在GaussianNB上表现良好。 然后,我们将使用GridSearchCV找到最佳的平滑因子。

Thus we see the GaussianNB accuracy score increased from being 78 percent to 80 percent here. So clearly it has enhanced the performance of Gaussian Naive Bayes here. The best smoothening factor is coming out to be 0.00351.
因此,我们看到GaussianNB准确性得分从78%提高到了80%。 显然,它增强了高斯朴素贝叶斯的表现。 最好的平滑因子为0.00351。
现在让我们用Tfidfvectorizer建立模型 (Now let’s build the model with Tfidfvectorizer)
CountVectorizer与TfidfVectorizer (CountVectorizer Vs TfidfVectorizer)
In CountVectorizer we only count the number of times a word appears in the document which results in bias in favor of most frequent words. this ends up ignoring rare words that could have helped us in processing our data more efficiently.
在CountVectorizer中,我们仅计算单词在文档中出现的次数,这会导致偏向于最常用的单词。 最终导致忽略了稀有词,这些词本可以帮助我们更有效地处理数据。
To overcome this, we use TfidfVectorizer.
为了克服这个问题,我们使用TfidfVectorizer 。
In TfidfVectorizer we consider the overall document weightage of a word. It helps us in dealing with the most frequent words. Using it we can penalize them. TfidfVectorizer weights the word counts by a measure of how often they appear in the documents. Thus the integrity of the rare words which possess a lot of information regarding a document is preserved.
在TfidfVectorizer中,我们考虑单词的整体文档权重 。 它有助于我们处理最常用的单词。 使用它我们可以惩罚他们。 TfidfVectorizer通过衡量单词计数在文档中出现的频率来加权单词计数。 因此,保留了拥有大量有关文档信息的稀有词的完整性。
So as above we will vectorize the data, split the data, and then we will create out models.
因此,如上所述,我们将矢量化数据,拆分数据,然后创建模型。
Note:TfdifVectorized data cannot be implemented by Gaussian NB
注意:TfdifVectorized数据无法由高斯NB实现
Now we will fit the data into the models and calculate their scores.
现在,我们将数据拟合到模型中并计算其分数。

Wow. We observe significant changes in the scores as compared to CountVectorizer. Here MultinomialNB is giving the best accuracy score of around 88.3% with a precision of 88.2% and recall of 88.4% percent. Thus the performance of the analyzer has significantly increased with the TF-IDF vectorizer. So we shall use this in our project deployment.
哇。 与CountVectorizer相比,我们观察到了分数的显着变化。 在这里, MultinomialNB给出的最佳准确性得分大约为88.3% , 精度为88.2% , 召回率为88.4% 。 因此,借助TF-IDF矢量化器,分析仪的性能已大大提高。 因此,我们将在项目部署中使用它。
卡方检验 (Chi-Square Test)
To enhance the performance of the analyzer more, we can perform the chi-square test which helps us ineffective sampling as well as helps us to predict which features carry more importance than others. When our dataset becomes huge with lakhs of features, there will be some features that do not contribute much information about the dataset. We can very well drop those features using the Chi-Square test. Moreover, an effective way of NLP is to rank the features by the chi-square test and then use it in our models. Further knowledge can about the chi-square test be found here.
为了进一步提高分析仪的性能,我们可以执行卡方检验,这有助于我们降低采样效率,并帮助我们预测哪些功能比其他功能更重要。 当我们的数据集变得庞大而又有成千上万的要素时,将有一些要素无法提供有关该数据集的大量信息。 我们可以使用卡方检验很好地删除这些功能。 此外,NLP的一种有效方法是通过卡方检验对特征进行排名,然后将其用于我们的模型中。 在这里可以找到有关卡方检验的更多知识。
I have kept this entire article as simple as possible. I hope you find the information useful. :)))))
我已使整篇文章尽可能简单。 希望您能找到有用的信息。 :)))))
翻译自: https://medium.com/@chaudhurysrijani/building-a-sentiment-analyzer-with-naive-bayes-c96cc8aa52a5
贝叶斯判别分析器


 1万+
1万+

 被折叠的 条评论
为什么被折叠?
被折叠的 条评论
为什么被折叠?
 到【灌水乐园】发言


