


好消息,ggplot2更新了。有了新的提升,改进了一些小错误。减少了对一些包的依赖,且保持足够精简。
There are also a range of smaller features in this release that may not be earth shattering, but could mean the world to some
下面就是一些简单的介绍,
ggplot2 3.3.0版本是昨天更新的,emmm,我看了官方的教程发布说明,感觉我还是看不懂,英语不熟悉,一些ggplot2的专有术语。
从我个人而言,这次更新关于地理填充的那个对我有用。之前就是画出来就是这样的,我还以为是数据问题,没想到是函数问题。这次好像是更新了。

对我而言还有一个就是画水平的条形图不用再旋转坐标了,可以直接生成。这次确实很方便

这次还有更新一些东西,我不太能看得懂,我也不经常用到。
大神可以看Rstudio的blog:
ggplot2 3.3.0 - Tidyversewww.tidyverse.org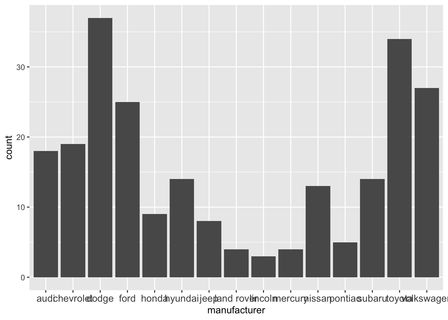
如果是小白,我建议还是不要看了,因为我感觉用处不大,
下面都是屁话(可以图个乐)
重新写了坐标轴代码
library(ggplot2)

p <- ggplot(mpg) +
  geom_bar(aes(x = manufacturer)) +
  theme(axis.text.x = element_text(size = 11))

# Overlapping labels
plot(p)
# Use guide_axis to dodge the labels
p +
  scale_x_discrete(guide = guide_axis(n.dodge = 2))
# Or to remove overlapping labels
p +
  scale_x_discrete(guide = guide_axis(check.overlap = TRUE))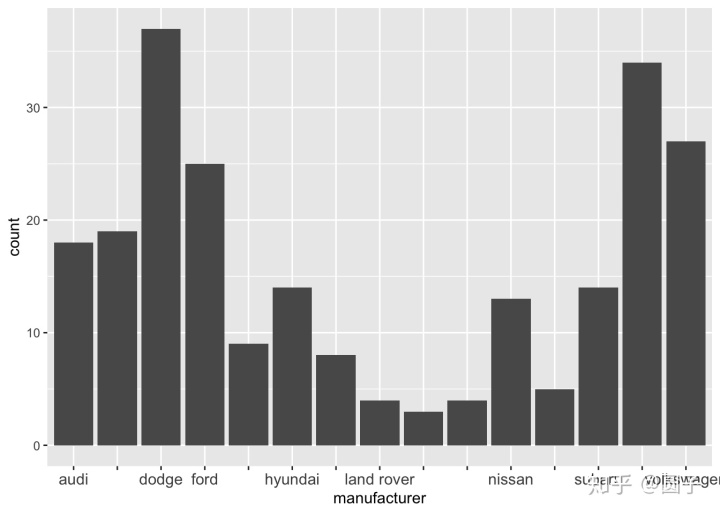
加入了新的图例
以前离散的数据只能用离散型的图例函数,现在不用管了。
p <- ggplot(mpg) +
  geom_point(aes(displ, cty, size = hwy, colour = hwy))

p +
  scale_size_binned()
p +
  scale_colour_binned()
p +
  scale_size_binned(guide = guide_bins(show.limits = TRUE))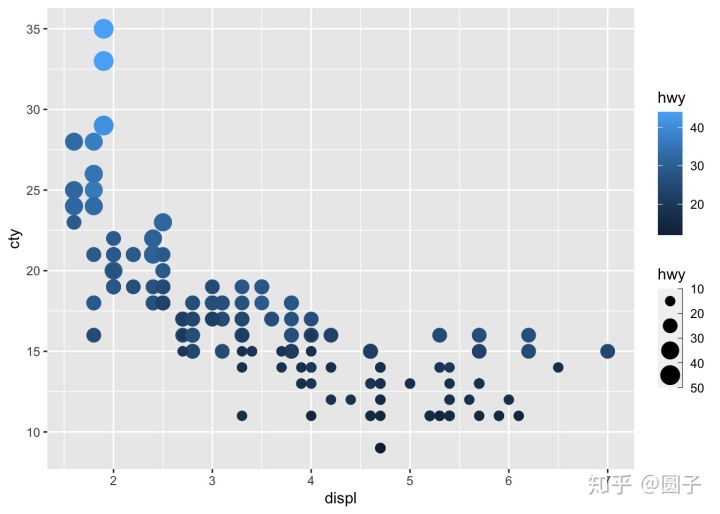
p +
  scale_x_binned()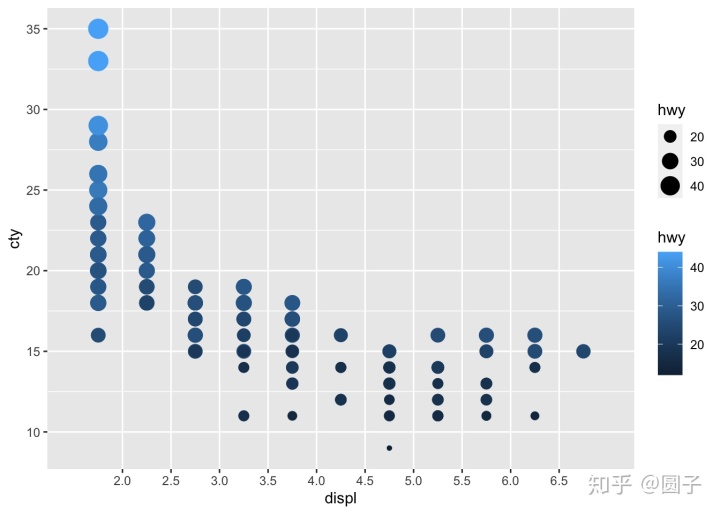
ggplot(mpg) +
  geom_bar(aes(displ)) +
  scale_x_binned()
画水平的条形图不需要之前那么麻烦了
以前的代码
ggplot(mpg) +
  geom_bar(aes(x = manufacturer)) +
  coord_flip()
新版本里面:
ggplot(mpg) +
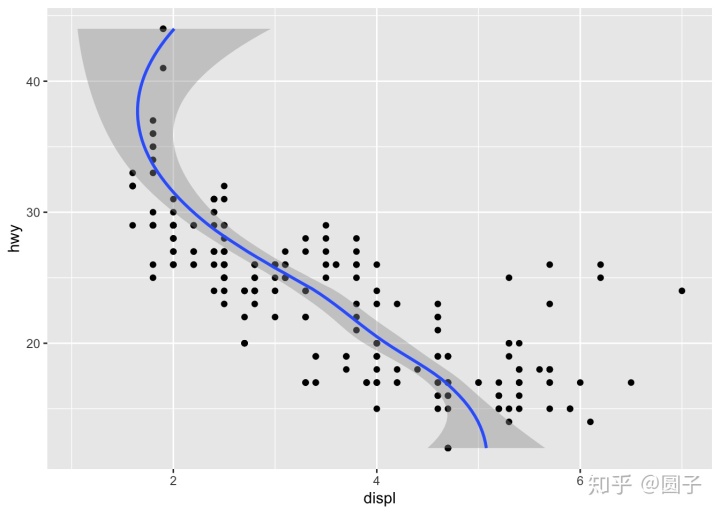
geom_bar(aes(y = manufacturer))ggplot(mpg, aes(displ, hwy)) +
geom_point() +
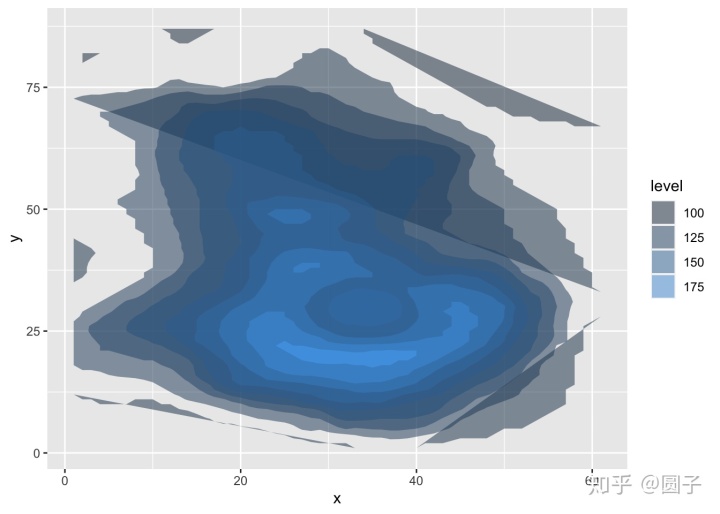
geom_smooth(orientation = "y")画轮廓图
以前的错误代码:
volcano_long <- data.frame(
  x = as.vector(col(volcano)),
  y = as.vector(row(volcano)),
  z = as.vector(volcano)
)

ggplot(volcano_long, aes(x, y, z = z)) +
  geom_polygon(aes(fill = stat(level)), alpha = 0.5, stat = "contour") +
  guides(fill = "legend")
现在改进的代码:
ggplot(volcano_long, aes(x, y, z = z)) +
  geom_contour_filled(aes(fill = stat(level)), alpha = 0.5)
ggplot(volcano_long, aes(x, y, z = z)) +
geom_contour_filled(aes(fill = stat(level))) +
guides(fill = guide_colorsteps(barheight = unit(10, "cm")))


 1431
1431


 被折叠的 条评论
为什么被折叠?
被折叠的 条评论
为什么被折叠?
 到【灌水乐园】发言


