


持续行动1期 52/100,“AI技术应用于量化投资研究”。
今天聊聊backtrader——号称最强大的“工业级”单机版量化框架。可能需要一系列的文章能把这个讲清楚,不只是简单使用,要改造成适合A股市场,电子货币实盘,接入机器学习生态等。
版本1.9,比较成熟,海外很多机构在用,而且支持实盘,支持电子货币等。
我比较看重实盘、生态。所以值得系统学习一下,并整合进我们的投研生态中。backtrader本身包很小,才420k左右,而且依赖包也不多,不像qlib,很多用户估计安装都有些许困难。
写一个简单的量化回测框架很简单,但要把问题考虑全,对上下游生态的整合,并不容易。而且要知道,我们的核心是策略,策略,策略(因子)。
backtrader是否方便整合机器学习生态,这个有待深入研究。
另外backtrader有一个缺点,就是代码比较难懂。这是我一直对这个框架没有提上日程的原因。但仔细一想,我们真正要改框架的地方不会太多,qlib很容易看懂,我也只是复用过它的代码,并没有扩展和修改过它的组件。
安装指令:pip install backtrader。
文档地址:https://www.backtrader.com/docu/quickstart/quickstart/
01 数据源
首先要解决的就是数据源的问题。
官网上的示例使用yahoofinance,国内访问不稳定,而且使用的示例数据也是美股,给我们的感觉是不太熟悉。
backtrader支持PandasData就是Dataframe,这就好办了。
最简单的,就是从本地加载csv,而本地数据我早就准备好了。
这是一个通用的datafeed_csv.py(大家从gitee ailabx可以下载)
# encoding:utf8
import os
import pandas as pd
from loguru import logger


class CSVDatafeed:
    def __init__(self):
        self.code_dfs = {}

    def add_data(self, code, csv_file):
        if not os.path.exists(csv_file):
            logger.error('{}csv文件不存在!'.format(code))
            return
        df = pd.read_csv(csv_file)
        if len(df) == 0:
            logger.error('{}没有数据!'.format(code))
            return
        for col in ['date']:
            if col not in df.columns:
                logger.error('{}字段{}不存在!'.format(code, col))
                return
        df['code'] = code
        df['date'] = df['date'].apply(lambda x: str(x))
        df.sort_values(by='date', inplace=True)

        df['rate'] = df['close'].pct_change()
        df['equity'] = (df['rate']+1).cumprod()

        self.code_dfs[code] = df

    def get_df(self, instrument):
        if instrument in self.code_dfs.keys():
            df = self.code_dfs[instrument]
            df.index = df['date']
            return df
        else:
            logger.info('{}未加载'.format(instrument))
            return None
    def get_all_df(self):
        df_all = pd.concat(self.code_dfs.values(), axis=0)
        df_all.dropna(inplace=True)
        df_all.index = df_all['date']
        df_all.sort_index(inplace=True)

        return df_all


if __name__ == '__main__':
    from engine.config import DATA_DIR_CSV
    feed = CSVDatafeed()
    code = '000300.SH'
    feed.add_data(code, DATA_DIR_CSV.joinpath('{}.csv'.format(code)))
    df = feed.get_df(code)
    print(df)
读出沪深300指数如下:
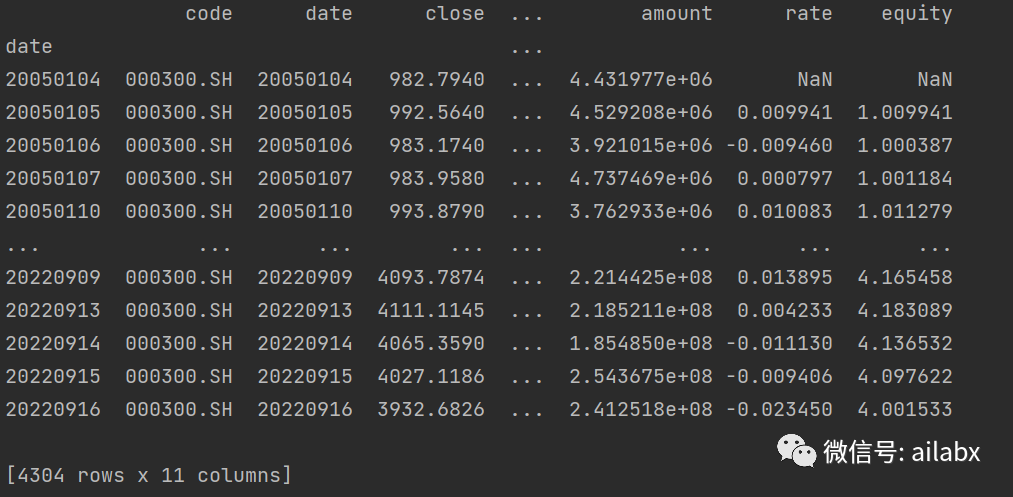
数据规整成backtrader格式,
index转为datetime格式,加一列openinterest(这个是期货里的概念,未平仓合约,不知为何要作为必选列,没有就置为0即可),然后把不需要的列去掉。
def to_backtrader_dataframe(df):
    df.index = pd.to_datetime(df.index)
    df['openinterest'] = 0
    df = df[['open', 'high', 'low', 'close', 'volume', 'openinterest']]
    return df
02 均线策略
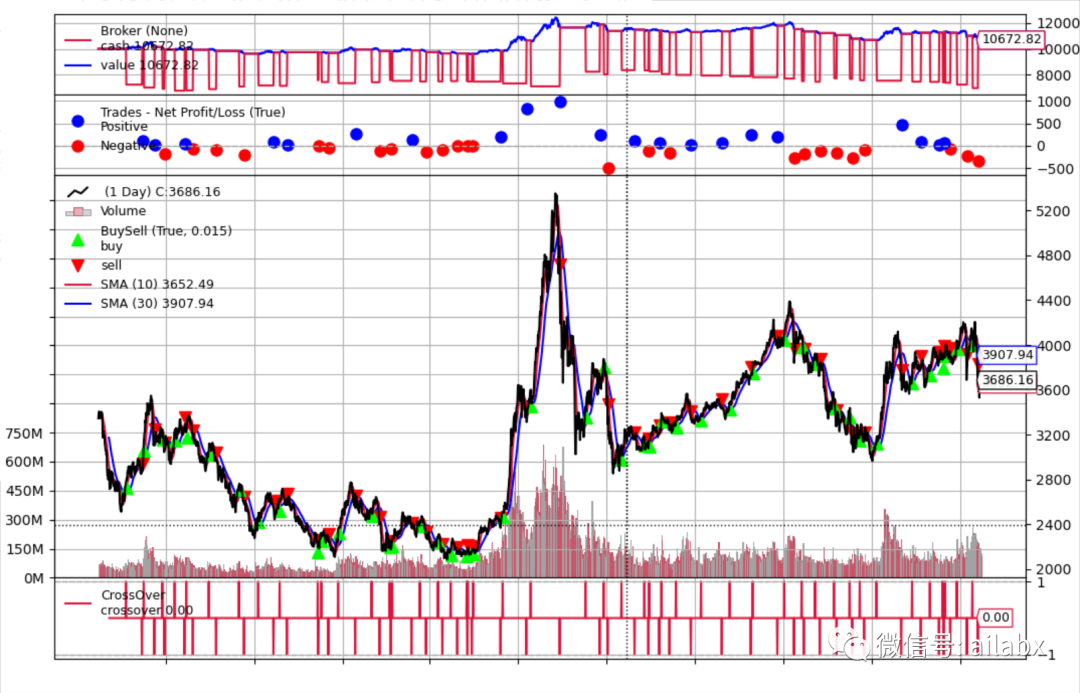
这是官网的第一个策略,一般用来测试系统,快线MA10与慢线MA30之间,金叉时买入,死叉时卖出。
class SmaCross(bt.Strategy):
    # list of parameters which are configurable for the strategy
    params = dict(
        pfast=10,  # period for the fast moving average
        pslow=30   # period for the slow moving average
    )

    def __init__(self):
        sma1 = bt.ind.SMA(period=self.p.pfast)  # fast moving average
        sma2 = bt.ind.SMA(period=self.p.pslow)  # slow moving average
        self.crossover = bt.ind.CrossOver(sma1, sma2)  # crossover signal

    def next(self):
        if not self.position:  # not in the market
            if self.crossover > 0:  # if fast crosses slow to the upside
                self.buy()  # enter long

        elif self.crossover < 0:  # in the market & cross to the downside
            self.close()  # close long position
看样子没有亏,这张图后面会细说,只是先演示一下用法。
另外这里使用的matplotlib的版本==3.2.2,高版本会报错。
另外我们可以有bokeh的web版本的可视化,这个后续的文章再聊。
这只是演示系统功能的例子。
这也是回测的好处,很多讲技术分析的书,一上来什么均线策略,你回测一下就知道均线策略有没有用——买来卖去十年赚了600多块钱——还好就是至少没亏。
几个细节:
一、买卖模式,使用buy/close根据信号来开仓/平仓
if not self.position:  # not in the market
    if self.crossover > 0:  # if fast crosses slow to the upside
        self.buy()  # enter long
    elif self.crossover < 0:  # in the market & cross to the downside
        self.close()  # close long position
二、目标仓位模式,order_target_size(仓位比例)
def next(self):
    if not self.position:  # not in the market
        if self.crossover > 0:  # if fast crosses slow to the upside
            self.order_target_size(target=1)  # enter long

    elif self.crossover < 0:  # in the market & cross to the downside
          self.order_target_size(target=0)  # close long position
三、交易信号模式,把crossover添加为交易信号,就不需要实现next函数了,这个功能特别有用——尤其是我们要整合机器学习时。模型就是输出交易信号。
需要继承自bt.SignalStrategy
def __init__(self):
    sma1 = bt.ind.SMA(period=self.p.pfast)  # fast moving average
    sma2 = bt.ind.SMA(period=self.p.pslow)  # slow moving average
    crossover = bt.ind.CrossOver(sma1, sma2)  # crossover signal
    self.signal_add(bt.SIGNAL_LONG, crossover)  # use it as LONG signal
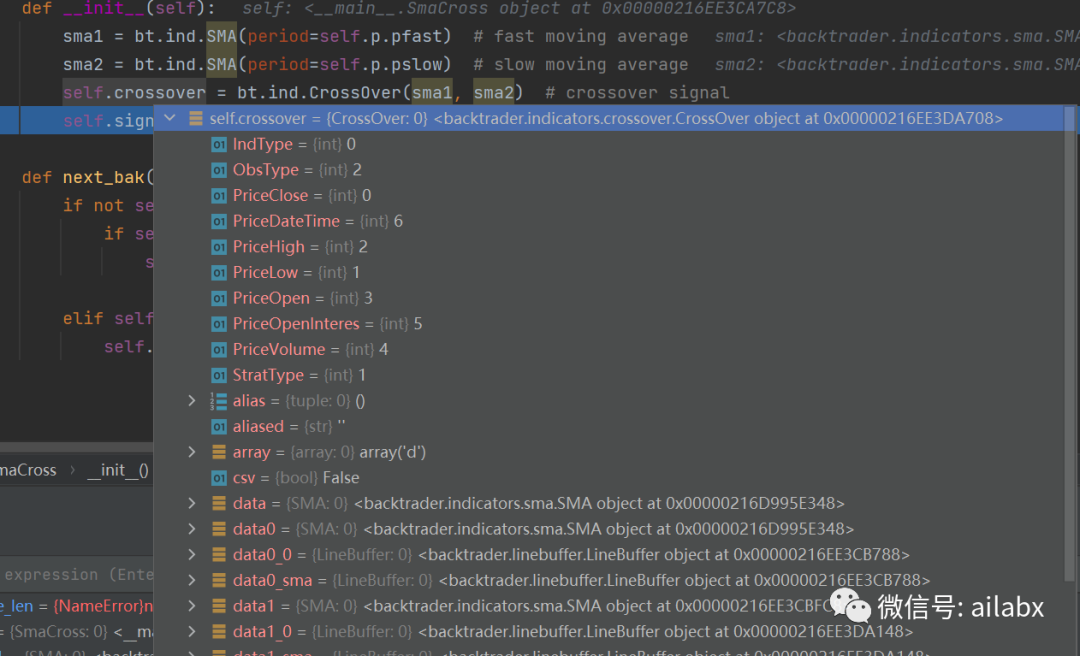
backtrader不好调试的地方,如果你想看下crossover到底是啥,debug进去,看到这样的东西,还是找不到数据。它用了大量的元编程,让我们访问数据很方便,但你想看到内存中的数据就不容易了。
03 数据序列DataSeries
要自己写策略,next函数(其他框架里加onbar),正确读取DataSeries里的数据。bt框架里使用0下标访问当前值,而且会自动走next(onbar),这一点很方便——但也是一开始不好理解的地方。
明天继续。
反思
大部分事情一开始是想不清楚细节的,一个模糊的正确的方向即可,然后朝着这个方向前进。而且直奔核心而去。比如你要开一家煎饼摊,最重要就是做出煎饼,口味很重要,至于品牌,营销都是之后的事情。
对于量化而言,策略是第一位的。
找一个框架,能让你的策略快速落地;更进一步,生态全,能够很快找到各个策略加以改进。


 993
993


 被折叠的 条评论
为什么被折叠?
被折叠的 条评论
为什么被折叠?
 到【灌水乐园】发言


