最近看到 Mukherjee et al. (2021, JFE) 的文章,受到了点启发,想找中国的云层数据来试试,但是没有质量特别高的数据,只好老老实实按照这篇论文中的做法从NOAA 下数据洗出来。
数据来源
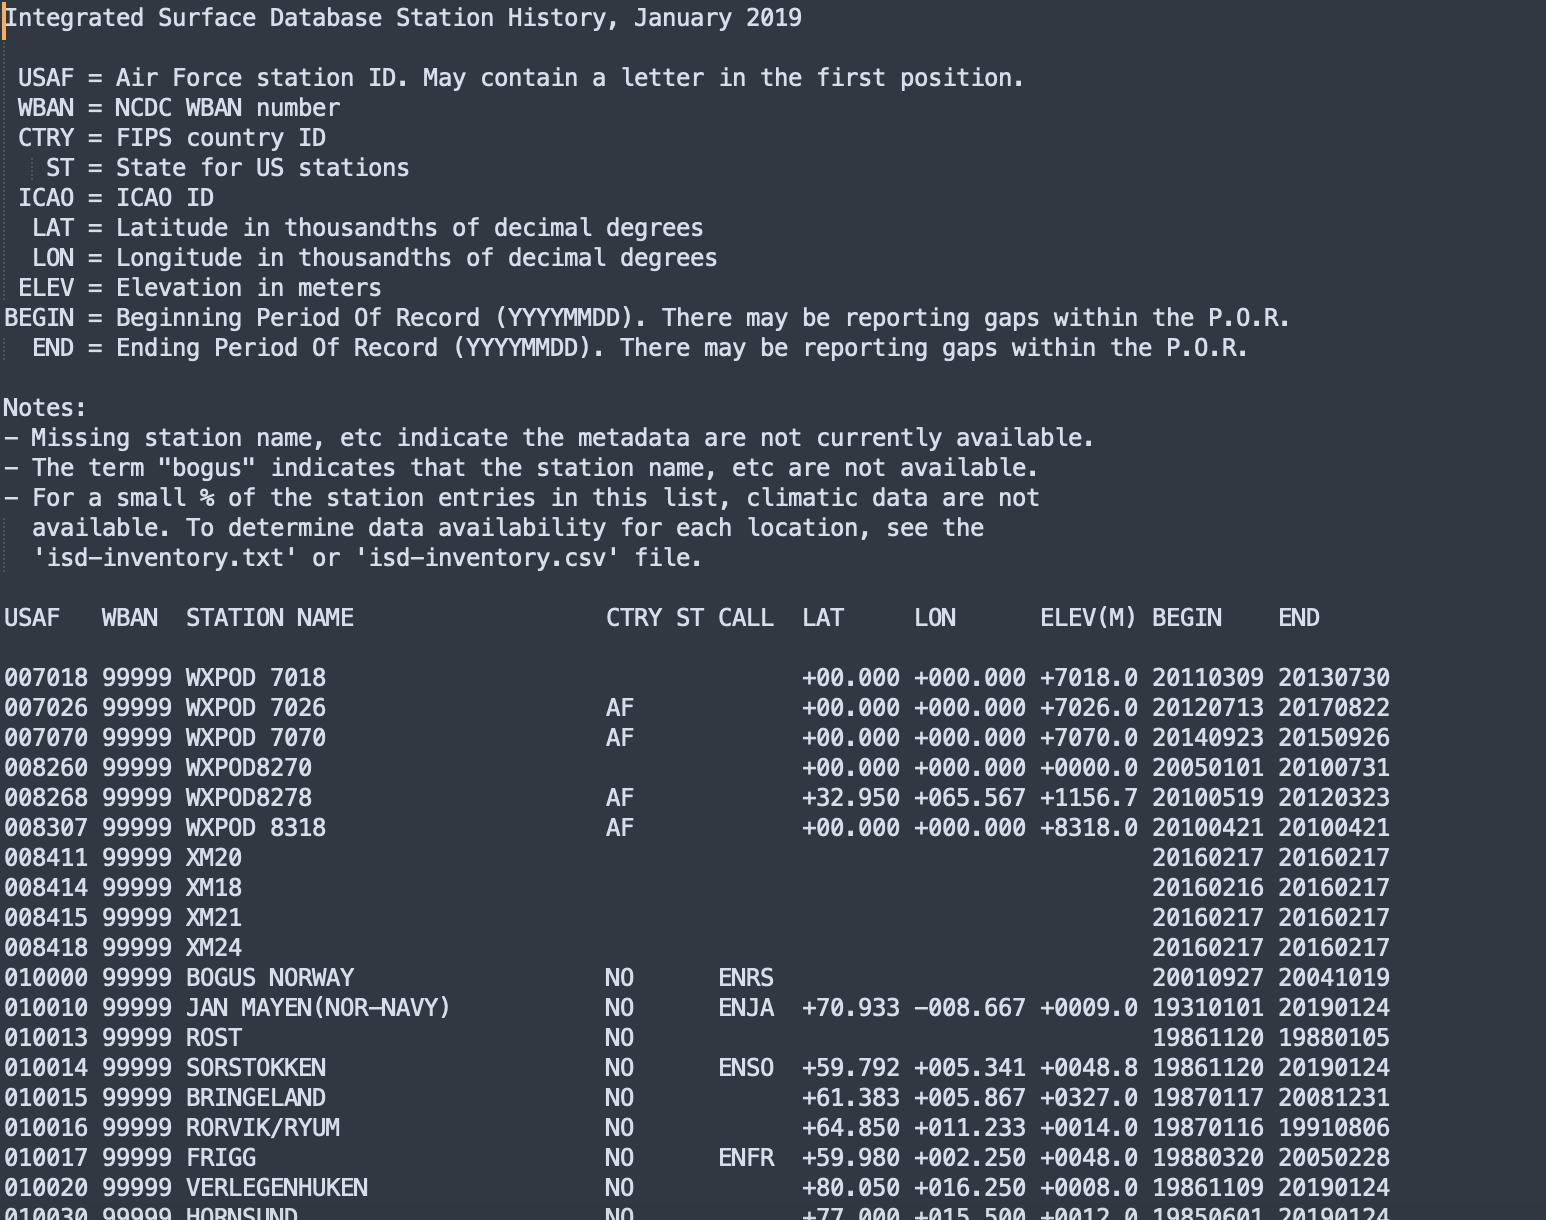
数据源为 NCDC(美国国家气候数据中心,National Climatic Data Center),隶属于NOAA(美国国家海洋及大气管理局,National Oceanic and Atmospheric Administration)。
数据来自NCDC的公开FTP服务器中的 ftp://ftp.ncdc.noaa.gov/pub/data/noaa/isd-lite/。
为了方便查看,文章中提到的所有数据源文件都可以在我的百度网盘分享链接里找到。
链接: https://pan.baidu.com/s/1GraMF6SgSg3DBIPxVNlgQQ 密码: l8j9
分析样本为 2000-2020 年间中国的地面气象数据 (每三小时记录一次)。
原始数据结构
以2020年为例,文件命名方式为 气象站id - 99999 (NCDC WBAN Number) - 年份。
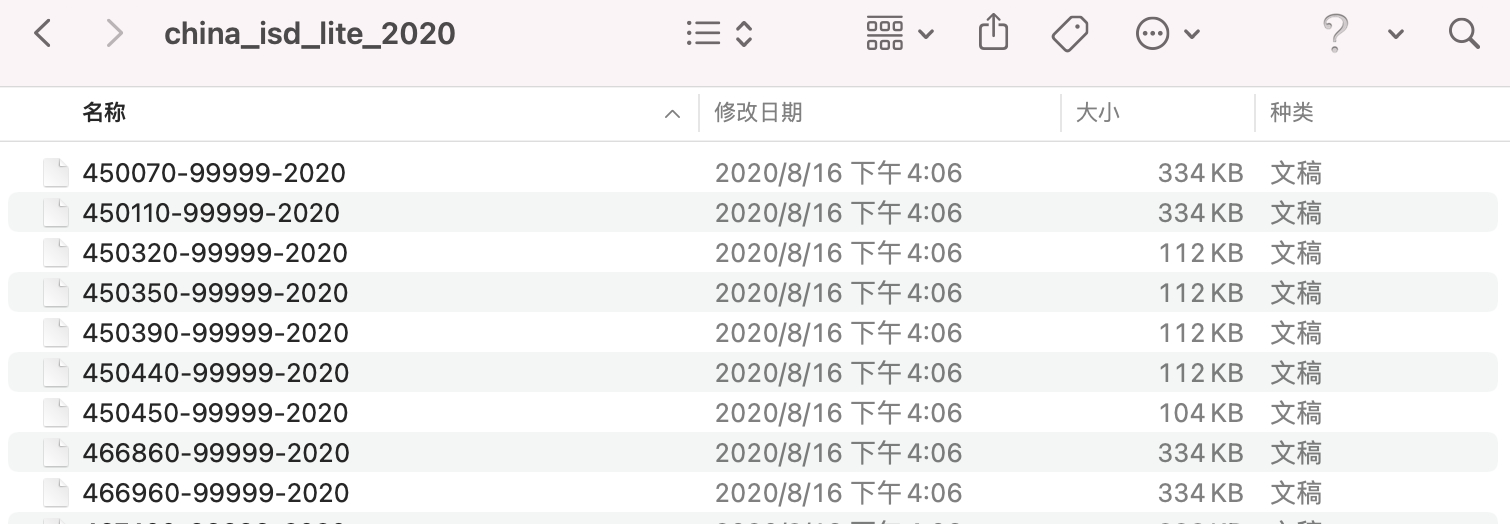
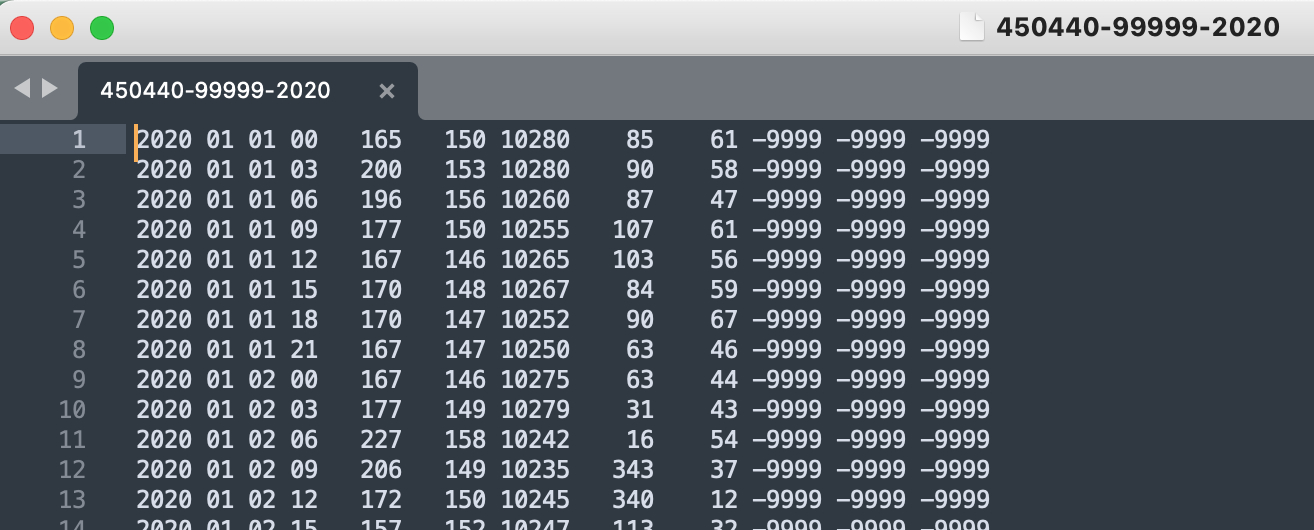
先看一个样例文件,该文件有 9 列,其变量按顺序分别为 观测年份,观测月份,观测日期,观测小时,空气温度,露点温度,海平面气压,风向,风速,云层厚度,液体渗透深度(1小时),液体渗透深度(6小时)。
详细变量说明如下:
Introduction
The ISD-Lite data contain a fixed-width formatted subset of the complete Integrated Surface Data (ISD) for a select number of observational elements. The data are typically stored in a single file corresponding to the ISD data, i.e. one file per station per year. For more information on the ISD-Lite format, consult the ISD-Lite technical document.
Data Format
Field 1: Pos 1-4, Length 4: Observation Year
Year of observation, rounded to nearest whole hour
Field 2: Pos 6-7, Length 2: Observation Month
Month of observation, rounded to nearest whole hour
Field 3: Pos 9-11, Length 2: Observation Day
Day of observation, rounded to nearest whole hour
Field 4: Pos 12-13, Length 2: Observation Hour
Hour of observation, rounded to nearest whole hour
Field 5: Pos 14-19, Length 6: Air Temperature
The temperature of the air
UNITS: Degrees Celsius
SCALING FACTOR: 10
MISSING VALUE: -9999
Field 6: Pos 20-24, Length 6: Dew Point Temperature
The temperature to which a given parcel of air must be cooled at constant pressure and water vapor content in order for saturation to occur.
UNITS: Degrees Celsius
SCALING FACTOR: 10
MISSING VALUE: -9999
Field 7: Pos 26-31, Length 6: Sea Level Pressure
The air pressure relative to Mean Sea Level (MSL).
UNITS: Hectopascals
SCALING FACTOR: 10
MISSING VALUE: -9999
Field 8: Pos 32-37, Length 6: Wind Direction
The angle, measured in a clockwise direction, between true north and the direction from which the wind is blowing.
UNITS: Angular Degrees
SCALING FACTOR: 1
MISSING VALUE: -9999
*NOTE: Wind direction for calm winds is coded as 0.
Field 9: Pos 38-43, Length 6: Wind Speed Rate
The rate of horizontal travel of air past a fixed point.
UNITS: meters per second
SCALING FACTOR: 10
MISSING VALUE: -9999
Field 10: Pos 44-49, Length 6: Sky Condition Total Coverage Code
The code that denotes the fraction of the total celestial dome covered by clouds or other obscuring phenomena.
MISSING VALUE: -9999
DOMAIN:
0: None, SKC or CLR
1: One okta - 1/10 or less but not zero
2: Two oktas - 2/10 - 3/10, or FEW
3: Three oktas - 4/10
4: Four oktas - 5/10, or SCT
5: Five oktas - 6/10
6: Six oktas - 7/10 - 8/10
7: Seven oktas - 9/10 or more but not 10/10, or BKN
8: Eight oktas - 10/10, or OVC
9: Sky obscured, or cloud amount cannot be estimated
10: Partial obscuration
11: Thin scattered
12: Scattered
13: Dark scattered
14: Thin broken
15: Broken
16: Dark broken
17: Thin overcast
18: Overcast
19: Dark overcast
Field 11: Pos 50-55, Length 6: Liquid Precipitation Depth Dimension - One Hour Duration
The depth of liquid precipitation that is measured over a one hour accumulation period.
UNITS: millimeters
SCALING FACTOR: 10
MISSING VALUE: -9999
*NOTE: Trace precipitation is coded as -1
Field 12: Pos 56-61, Length 6: Liquid Precipitation Depth Dimension - Six Hour Duration
The depth of liquid precipitation that is measured over a six hour accumulation period.
UNITS: millimeters
SCALING FACTOR: 10
MISSING VALUE: -9999
*NOTE: Trace precipitation is coded as -1
数据预处理
Step 1: 将气象站前两位和年份相同的所有原始 isd 数据写入一个 csv 文件中
由于 isd 文件的数目太大,一一转换成 dta 文件再合并会产生大量的 dta 文件冗余,所以最好在转换成 dta 文件前先用 python 精简下文件数量。
import os
import csv
dir = "/.../Data/"
# isd 文件存储路径
headline = ['year','mon','day','hour','air_temperature','dew_point_temperature',
'sea_level_pressure','wind_direction','wind_speed','cloud_cover',
'precipitation_depth_one_hour','precipitation_depth_six_hour','station']
# 标题行
def transisd2csv(year):
g = os.walk(dir + "china_isd_lite_%s"%year)
# 遍历指定年份isd文件夹内所有文件
isExists = os.path.exists(dir + "Aggregate%s/" % year)
if not isExists:
os.makedirs(dir + "Aggregate%s/" % year)
# 如果没有指定年份 Aggregate 文件夹,则创建一个
for path, dir_list, file_list in g:
for file_name in file_list:
if file_name!=".DS_Store":
station = file_name.split("-")[0]
# 从每个 isd 文件名中提取气象站 id
csvFile = open(dir + "Aggregate%s/r%s.csv" % (year, station[:2]), "a", newline='', encoding='utf-8')
# 命名一个以气象站id前两位命名的csv文件,如果没有则创建一个,存储到前面创建的 Aggregate 文件夹中
writer = csv.writer(csvFile)
writer.writerow(headline)
# 写入标题行
f = open(dir + "china_isd_lite_%s/" % year + file_name, "r")
# 逐个打开指定年份isd文件夹中的每个文件
for line in f:
# 对于每个打开的 isd 文件,逐行读取数据
csvRow = line.split()
# 对于每一行,以空格分割,得到该行数据的 list 形式
csvRow.append(station)
# 每列末尾加上气象站 id
writer.writerow(csvRow)
# 向之前创建的 csv 文件里写入每行数据
for year in range(2000,2021):
transisd2csv(year)
print("Year %s completed"%year)
Step 2: 遍历 Aggregate 文件夹中的所有文件,将 csv 文件转换成年度的汇总数据
将精简过数量的 isd 文件转换成 dta 文件,并以年为单位进行合并。
forvalues i = 2000/2020{
* 遍历年份
local add= "/.../Data/Aggregate"+"`i'/"
cd "`add'"
* 切换到指定年份的 Aggregate 文件夹
* 将之前预处理过的 csv 文件转换成相同命名的 dta 文件
local ff : dir . files "*.csv"
foreach f of local ff {
clear
dis "`f'"
local filename = substr("`f'",1,ustrrpos("`f'",".")-1)
if "`filename'"!=""{
dis "`filename'"
import delimited "`f'", delimiter(comma) varnames(1)
save "`filename'", replace emptyok
}
}
* 合并指定年份所有的 stata 文件
use r45,replace
local ff : dir . files "*.dta"
foreach f of local ff {
append using `f'
}
local saveadd="/.../Data/Aggregate2000-2020/chinaclimate"+"`i'"
dis "`saveadd'"
* 将指定年份所有的 isd 数据存储到一个 dta 文件里
save "`saveadd'", replace emptyok
}
经过这一步,得到以年为单位存储的 dta 格式的所有 isd 数据
Step 3: 导入 linktable, 便于将气象站 id 映射到省份
linktable 的数据样例如下
Step 4: 处理以年为单位存储的 dta 格式的所有 isd 数据,得到每个变量年平均数据
forvalues i = 2000/2020{
* 遍历每个年份的 isd 数据
use chinaclimate`i'
drop if year=="year"
* 删除多余的标题行
replace station=substr(station, 1, 5)
* 保留 stationid 的前五位,便于与 linktable 配对
sort station
merge station using linktable
keep if _merge==3
drop _merge
* 与 linktable 配对,得到每个气象站对应的省份
rename precipitation_depth_one_hour precipitation_one_hour
rename precipitation_depth_six_hour precipitation_six_hour
sort year mon day station hour
local vars air_temperature-precipitation_six_hour
destring `vars',replace
* 转换为数值型变量
global vars air_temperature dew_point_temperature sea_level_pressure wind_direction wind_speed cloud_cover precipitation_one_hour precipitation_six_hour
foreach v of global vars{
replace `v'=. if `v'==-9999
* 对于每个变量,将值为 -9999 的观测替换为缺失值
by year mon day station: egen dayave_`v'=mean(`v')
* 对于每个观测站每个日期,求每个变量的日平均
drop `v'
* 只保留求日平均之后的变量
}
drop hour
duplicates drop year mon day station,force
* 对于每个观测站的每个日期,保留唯一观测
foreach v of global vars{
replace dayave_`v'=. if dayave_`v'==-9999
* 对于每个日平均变量,将值为 -9999 的观测替换为缺失值
bys year province: egen yearave_`v'=mean(dayave_`v')
* 对于每个省份每个年份,求每个变量的年平均
drop dayave_`v'
* 只保留年平均变量
}
keep year province clouday yearave*
duplicates drop year province,force
* 对于每个观测站每个年份,保留唯一观测
save yearclimate`i'
* 将省份-年平均 isd 数据存储到相应年份命名的 dta 文件中
}
Step 5: 将2000-2020年所有省份-年平均 isd 数据写入一个 dta 文件中
clear
set obs 0
save yearclimate2000-2020, emptyok
local ff : dir . files "*.dta"
foreach f of local ff {
local tag = (substr("`f'",1,11)=="yearclimate")
* 识别出文件夹内所有以 yearclimate 开头的 dta 文件并将其合并到一个 dta 文件里
dis `tag'
if `tag'==1{
append using `f'
}
}
save yearclimate2000-2020, replace
最终得到每个省份每年的平均气象数据文件
参考文献
Mukherjee, Abhiroop, George Panayotov, and Janghoon Shon. 2021. “Eye in the Sky: Private Satellites and Government Macro Data.” Journal of Financial Economics, March. https://doi.org/10.1016/j.jfineco.2021.03.002.