


Title
题目
Multimodal deep learning for Alzheimer’s disease dementia assessment
多模态深度学习用于阿尔茨海默病痴呆评估
01
文献速递介绍
全球每年新发痴呆症病例近1000万例,其中阿尔茨海默病(AD)最为常见。需要新的措施来改善因各种病因引起的认知功能障碍患者的诊断。在这里,我们报告了一个深度学习框架,按照连续的方式完成多个诊断步骤,以识别具有正常认知(NC)、轻度认知障碍(MCI)、AD和非AD痴呆症(nADD)的人群。我们展示了一系列能够接受灵活组合的常规收集的临床信息的模型,包括人口统计学数据、病史、神经心理测试、神经影像学和功能评估。然后,我们展示了这些框架与从业神经学家和神经放射科医师的诊断准确性相比具有有利的优势。最后,我们应用计算机视觉中的可解释性方法,展示了我们的模型检测到的疾病特异性模式如何跟踪整个大脑中的不同退行性变化模式,并与尸检时神经病理学损害的存在密切对应。我们的工作展示了通过已建立的医学诊断标准验证计算预测的方法论。
Method
方法
Study population. This study was exempted from local institutional review boardapproval, as all neuroimaging and clinical data were obtained in deidentified format upon request from external study centers, who ensured compliance withethical guidelines and informed consent for all participants. No compensation wasprovided to participants.We collected demographics, medical history, neuropsychological tests, andfunctional assessments as well as magnetic resonance imaging (MRI) scans from 8cohorts (Table 1), totaling 8916 participants after assessing for inclusion criteria.There were 4550 participants with normal cognition (NC), 2412 participants withmild cognitive impairment (MCI), 1606 participants with Alzheimer’s diseasedementia (AD) and 348 participants with dementia due to other causes. The eightcohorts include the Alzheimer’s Disease Neuroimaging Initiative (ADNI) dataset(n = 1821)34–36, the National Alzheimer’s Coordinating Center (NACC) dataset(n = 4822)21,22, the frontotemporal lobar degeneration neuroimaging initiative(NIFD) dataset (n = 253)37, the Parkinson’s Progression Marker Initiative (PPMI)dataset (n = 198)38, the Australian Imaging, Biomarker and Lifestyle FlagshipStudy of Ageing (AIBL) dataset (n = 661)39–41, the Open Access Series of ImagingStudies-3 (OASIS) dataset (n = 666)42, the Framingham Heart Study (FHS) dataset(n = 313)43,44, and in-house data maintained by the Lewy Body Dementia Centerfor Excellence at Stanford University (LBDSU) (n = 182)45.We labeled the participants according to the clinical diagnosis(See Supplementary Information: Data to clinicians and diagnostic criterion).Subjects were labeled according to the clinical diagnoses provided by each studycohort. We kept MCI diagnoses without further consideration of underlyingetiology to simulate a realistic spectrum of MCI presentations. For any subjectswith documented dementia and primary diagnosis of Alzheimer’s diseasedementia, an AD label was assigned regardless of the presence of additionaldementing comorbidities. Subjects with dementia but without confirmed ADdiagnosis were labeled as nADD. Notably, we elected to conglomerate all nADDsubtypes into a singular label given that subdividing model training across anarbitrary number of prediction tasks ran the risk of diluting overall diagnosticaccuracy. The ensemble of these 8 cohorts provided us a considerable number ofparticipants with various forms of dementias as their primary diagnosis, includingAlzheimer’s disease dementia (AD, n = 1606), Lewy body dementia (LBD, n = 63),frontotemporal dementia (FTD, n = 193), vascular dementia (VD, n = 21), andother causes of dementia (n = 237). We provided a full survey of nADD dementiasby cohort in the Supplementary Information (Table S9).
研究人群。本研究被豁免于当地机构审查委员会的批准,因为所有神经影像和临床数据均以去识别化格式在外部研究中心的请求下获得,这些中心确保符合伦理准则并为所有参与者提供知情同意。未向参与者提供任何补偿。我们从8个队列(表1)收集了人口统计学数据、病史、神经心理测试和功能评估以及磁共振成像(MRI)扫描,经过入选标准评估后,共有8916名参与者。其中,4550名参与者具有正常认知(NC),2412名参与者具有轻度认知障碍(MCI),1606名参与者患有阿尔茨海默病痴呆(AD),348名参与者患有其他原因导致的痴呆症。八个队列包括阿尔茨海默病神经影像研究倡议(ADNI)数据集(n = 1821),国家阿尔茨海默病协调中心(NACC)数据集(n = 4822),额颞叶变性神经影像研究倡议(NIFD)数据集(n = 253),帕金森进展标志物倡议(PPMI)数据集(n = 198),澳大利亚成像、生物标志物和生活方式重点研究(AIBL)数据集(n = 661),开放获取成像研究系列-3(OASIS)数据集(n = 666),弗雷明汉心脏研究(FHS)数据集(n = 313),以及斯坦福大学李威体痴呆中心维护的内部数据(LBDSU)(n = 182)。我们根据临床诊断对参与者进行了标记(见补充信息:数据给临床医生和诊断标准)。根据每个研究队列提供的临床诊断标签主体。我们保留了MCI诊断,不再考虑潜在的病因,以模拟MCI表现的真实谱系。对于任何已确诊患有痴呆症且首要诊断为阿尔茨海默病痴呆的主体,都会分配AD标签,无论是否存在其他痴呆症共病。患有痴呆症但未经确认AD诊断的对象被标记为nADD。值得注意的是,我们选择将所有nADD亚型合并为一个标签,因为将模型训练细分到任意数量的预测任务中可能会降低总体诊断准确性。这8个队列的整体提供了大量患有各种形式的痴呆症的参与者,其中包括阿尔茨海默病痴呆(AD,n = 1606),李威体痴呆(LBD,n = 63),额颞叶痴呆(FTD,n = 193),血管性痴呆(VD,n = 21)和其他原因导致的痴呆症(n = 237)。我们在补充信息中提供了每个队列的nADD痴呆症的全面调查表(表S9)。
Results
结果
We divided the process of differential diagnosis into staged tasks.The first, which we refer to as the COG task, labeling persons ashaving either NC, MCI, or dementia (DE) due to any cause. Ofnote, the COG task may be seen as comprising three separatebinary classification subtasks: (i) COGNC task: Separation of NCand MCI/DE cases (ii) COGMCI task: Separation of MCI fromNC/DE cases, and (iii) COGDE task: Separation of DE from NC/MCI cases. After completion of the overall COG task, we nextformulated the ADD task, in which we assigned all personslabeled as DE to a diagnosis of either AD or nADD. Successivecompletion of the COG and the ADD tasks allowed execution ofan overarching 4-way classification that fully delineated NC, MCI,AD, and nADD cases (See Supplementary Information: Glossaryof Tasks, Models, and Metrics).We also created three separate models: (i) MRI-only model: Aconvolutional neural network (CNN) that internally computed acontinuous DEmentia MOdel (DEMO) score to complete theCOG task, as well as an ALZheimer’s (ALZ) score to complete theADD task. (ii) Non-imaging model: A traditional machinelearning classifier that took as input only scalar-valued clinicalvariables from demographics, past medical history, neuropsychological testing, and functional assessments. As in theMRI-only model, the non-imaging model also computed theDEMO and the ALZ scores from which the COG and the ADDtasks could be completed. We tested multiple machine learningarchitectures for these purposes and ultimately selected a CatBoostmodel as our final non-imaging model architecture. (iii) Fusionmodel: This framework linked a CNN to a CatBoost model. Withthis approach, the DEMO and the ALZ scores computed by theCNN were recycled and used alongside available clinical variables.The CatBoost model then recalculated these scores in the contextof the additional non-imaging information. We provide definitions of our various prediction tasks, cognitive metrics, and modeltypes within the Supplementary Information. Further details ofmodel design may be found within the Methods.
我们将差异诊断过程划分为分阶段的任务。
首先,我们称之为COG任务,将个体标记为具有正常认知(NC)、轻度认知障碍(MCI)或任何原因导致的痴呆(DE)。值得注意的是,COG任务可以看作由三个独立的二分类子任务组成:(i) COGNC任务:将NC和MCI/DE病例分开,(ii) COGMCI任务:将MCI与NC/DE病例分开,以及(iii) COGDE任务:将DE与NC/MCI病例分开。完成整体COG任务后,我们接下来制定了ADD任务,其中将所有标记为DE的个体诊断为AD或nADD。依次完成COG和ADD任务,允许执行一个全面划分NC、MCI、AD和nADD病例的4分类任务(见补充信息:任务、模型和指标术语表)。
我们还创建了三个独立的模型:(i) 仅MRI模型:一个卷积神经网络(CNN),内部计算连续的痴呆模型(DEMO)分数以完成COG任务,以及一个阿尔茨海默病(ALZ)分数以完成ADD任务。(ii) 非成像模型:一个传统的机器学习分类器,仅接受来自人口统计学、过去病史、神经心理测试和功能评估的标量值临床变量作为输入。与MRI-only模型一样,非成像模型还从这些分数中计算DEMO和ALZ分数,从而完成COG和ADD任务。我们为这些目的测试了多个机器学习架构,最终选择了CatBoost模型作为我们的最终非成像模型架构。(iii) 融合模型:该框架将CNN与CatBoost模型连接起来。通过这种方法,CNN计算的DEMO和ALZ分数被重新利用,并与可用的临床变量一起使用。然后,CatBoost模型在额外的非成像信息的背景下重新计算这些分数。我们在补充信息中提供了各种预测任务、认知指标和模型类型的定义。有关模型设计的更多详细信息可在方法部分找到。
Figure
图
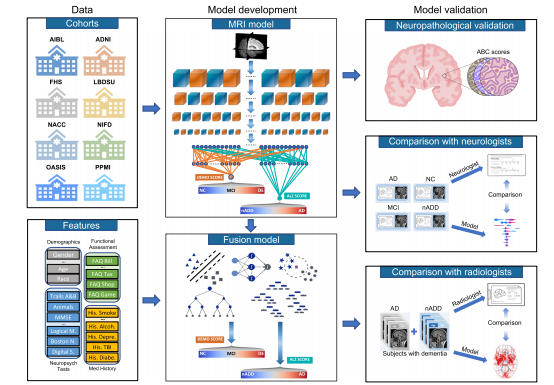
Fig. 1 Modeling framework and overall strategy. Multimodal data including MRI scans, demographics, medical history, functional assessments, andneuropsychological test results were used to develop deep learning models on various classification tasks. Eight independent datasets were used for thisstudy, including NACC, ADNI, AIBL, FHS, LBDSU, NIFD, OASIS, and PPMI. We selected the NACC dataset to develop three separate models: (i) an MRIonly CNN model (ii) non-imaging models in the form of traditional machine learning classifiers, which did not use any MRI data (iii) a fusion modelcombining imaging and non-imaging data within a hybrid architecture joining a CNN to a CatBoost model. The MRI-only model was validated across alleight cohorts, whereas external validation of non-imaging and fusion models was performed only on OASIS. First, T1-weighted MRI scans were input to aCNN to calculate a continuous DEmentia MOdel (DEMO) score to assess cognitive status on a 0 to 2 scale, where “0” indicated NC “1” indicated MCI and“2” indicated DE. DEMO scores were converted to class labels using an optimal thresholding algorithm, with these assignments constituting the COG task.For individuals with DE diagnosis, the multi-task CNN model simultaneously discriminated their risk of having AD versus nADD, a classification that werefer to as the ADD task. We denoted the probability of AD diagnosis as the ALZheimer (ALZ) score. Both MRI-derived DEMO scores and ALZ scoreswere then input alongside non-imaging variables to various machine learning classifiers to form fusion models, which then predicted outcomes on the COGand ADD tasks, respectively. A portion of cases with confirmed dementia (n = 50) from the NACC testing cohort was randomly selected for directcomparison of the fusion model with an international team of practicing neuroradiologists. Both the model and neuroradiologists completed the ADD taskusing available MRI scans, age, and gender. Additionally, a portion of NACC cases (n = 100) was randomly selected to compare the fusion modelperformance to practicing neurologists, with both the model and clinicians having access to a common set of multimodal data. Lastly, model predictionswere compared with neuropathology grades from NACC, ADNI and FHS cohorts (n = 110).
图1 建模框架和整体策略。利用多模态数据,包括MRI扫描、人口统计学数据、病史、功能评估和神经心理测试结果,开发了用于各种分类任务的深度学习模型。本研究使用了包括NACC、ADNI、AIBL、FHS、LBDSU、NIFD、OASIS和PPMI在内的八个独立数据集。我们选择了NACC数据集开发三个单独的模型:(i)仅MRI的CNN模型,(ii)以传统机器学习分类器形式的非成像模型,不使用任何MRI数据,(iii)将成像和非成像数据结合在混合架构中,将CNN与CatBoost模型连接的融合模型。MRI-only模型在所有八个队列中进行了验证,而非成像和融合模型的外部验证仅在OASIS上进行。首先,T1加权MRI扫描输入到CNN中,计算连续的痴呆模型(DEMO)分数,以在0到2的范围内评估认知状态,其中“0”表示NC,“1”表示MCI,而“2”表示DE。使用最佳阈值算法将DEMO分数转换为类标签,这些分配构成了COG任务。对于被诊断为DE的个体,多任务CNN模型同时区分其患有AD还是nADD的风险,我们将此分类称为ADD任务。我们将AD诊断的概率表示为阿尔茨海默(ALZ)分数。然后,将MRI衍生的DEMO分数和ALZ分数与非成像变量一起输入到各种机器学习分类器中,形成融合模型,然后预测COG和ADD任务的结果。从NACC测试队列中随机选择了一部分已确认患有痴呆的个案(n = 50),与国际一组实践神经放射科医师直接比较了融合模型。模型和神经放射科医师均使用可用的MRI扫描、年龄和性别完成了ADD任务。此外,从NACC个案中随机选择了一部分(n = 100),将融合模型的性能与实践神经学家进行比较,模型和临床医生都可以访问一组共同的多模态数据。最后,将模型预测与NACC、ADNI和FHS队列的神经病理学等级(n = 110)进行了比较。
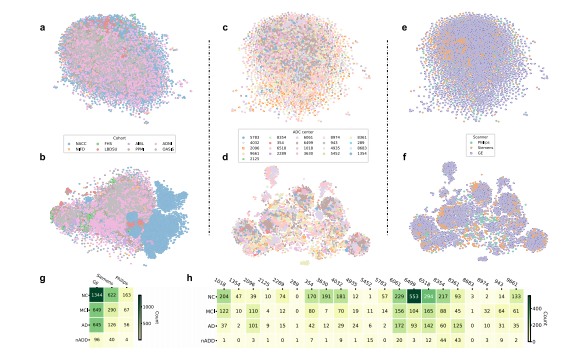
Fig. 2 Site- and scanner-specific observations. Unsupervised clustering of post-processed MRIs and hidden layer activations assessed for systematicbiases in input data and model predictions, respectively. a Two-dimensional (2D) t-distributed stochastic neighbor embedding (tSNE) embeddings ofdownsampled MRI scans are shown. The downsampling was performed on the post-processed MRI scans using spline interpolation with a downsamplingfactor of 8 on each axis. Individual points represent MRIs from a single subject and are colored according to their original cohort (either NACC, ADNI, AIBL,FHS, LBDSU, NIFD, OASIS, or PPMI). b We demonstrate 2D tSNEs of hidden-layer activations from the penultimate CNN hidden layer. Individual pointscorrespond to internal representations of MRI scans during testing and are colored by cohort label. c Plot of 2D tSNE embeddings of downsampled MRIscans from the NACC dataset is shown. Individual points representing MRI scans are colored by the unique identifier of one of twenty-one AlzheimerDisease Research Centers (ADRCs) that participate in the NACC collaboration. d tSNE embeddings for penultimate layer activations colored by ADRC IDare shown. e Plot of 2D tSNE embeddings of downsampled MRI scans from the NACC dataset is shown. Embeddings in this plot are the same as those inc but colored according to the manufacturer of the scanner used to acquire each MRI, either General Electric (GE), Siemens, or Philips. f Plot of 2D tSNE ofpenultimate layer activations is shown for cases in the NACC dataset. Embeddings are equivalent to those visualized in d but are now colored by themanufacturer of the scanner used for image acquisition. g A tabular representation of disease category counts by manufacturer is presented. Only casesfrom the NACC dataset are included. We provide the Mutual Information Score (MIS) to quantify the correlation between disease type and scannermanufacturer. h We also provided a tabular representation of disease category counts stratified by ADRC ID in the NACC dataset. MIS is once again shownto quantify the degree of correlation between diagnostic labels and individual centers participating in the NACC study. Source data are provided as aSource Data file.
图2 站点和扫描仪特异性观察。对经过处理的MRI和隐藏层激活进行了无监督聚类,以评估输入数据和模型预测之间的系统偏差。a 显示了降采样后的MRI扫描的二维t分布随机近邻嵌入(tSNE)。通过样条插值对经过处理的MRI扫描进行了降采样,每个轴的降采样因子为8。单个点代表来自单个受试者的MRI,并根据其原始队列(NACC、ADNI、AIBL、FHS、LBDSU、NIFD、OASIS或PPMI)着色。b 我们展示了来自倒数第二个CNN隐藏层的隐藏层激活的2D tSNE。个体点对应于测试期间MRI扫描的内部表示,并按队列标签着色。c 显示了来自NACC数据集的二维tSNE嵌入的绘图。代表MRI扫描的个体点按参与NACC合作的21个阿尔茨海默病研究中心(ADRCs)的唯一标识符进行着色。d 按ADRC ID着色的倒数第二层激活的tSNE嵌入显示。e 显示了来自NACC数据集的降采样MRI扫描的二维tSNE嵌入。此图中的嵌入与c中可视化的嵌入相同,但按照用于获取每个MRI的扫描仪的制造商(通用电气、西门子或飞利浦)进行着色。f 显示了NACC数据集中病例的倒数第二层激活的2D tSNE。嵌入与d中可视化的嵌入等效,但现在根据用于图像采集的扫描仪制造商进行着色。g 提供了按制造商划分的疾病类别计数的表格表示。仅包括NACC数据集中的案例。我们提供了互信息分数(MIS)来量化疾病类型与扫描仪制造商之间的相关性。h 我们还提供了根据NACC数据集中的ADRC ID分层的疾病类别计数的表格表示。再次显示MIS来量化诊断标签与参与NACC研究的个体中心之间的相关程度。源数据作为源数据文件提供。
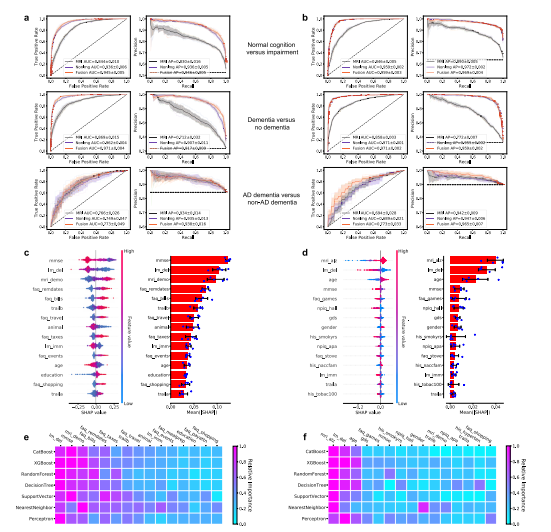
Fig. 3 Performance of the deep learning models. a, b ROC curves showing true positive rate versus false positive rate and PR curves showing the positivepredictive value versus sensitivity on the a NACC test set and b OASIS dataset. The first row in a and b denotes the performance of the MRI-only model,the non-imaging model, and the fusion model (CNN + CatBoost) trained to classify cases with NC from those without NC (COGNC task). The second rowshows ROC and PR curves of the MRI-only model, the non-imaging model, and the fusion model for the COGDE task aimed at distinguishing cases with DEfrom those who do not have DE. The third row illustrates performance of the MRI-only model, the non-imaging model, and the fusion model focused ondiscriminating AD from nADD. For each curve, mean AUC was computed. In each plot, the mean ROC/PR curve and standard deviation are shown asbolded lines and shaded regions, respectively. The dotted lines in each plot indicate the classifier with the random performance level. c, d Fifteen featureswith highest mean absolute SHAP values from the fusion model are shown for the COG and ADD tasks, respectively across cross-validation rounds(n = 5). Error bars overlaid on bar plots are centered at the mean of the data and extend /− one standard deviation. For each task, the MRI scans,demographic information, medical history, functional assessments, and neuropsychological test results were used as inputs to the deep learning model.The left plots in c and d illustrate the distribution of SHAP values and the right plots show the mean absolute SHAP values. All the plots in c and d areorganized in decreasing order of mean absolute SHAP values. e, f For comparison, we also constructed traditional machine learning models to predictcognitive status and AD status using the same set of features used for the deep learning model, and the results are presented in e and f, respectively. Theheat maps show fifteen features with the highest mean absolute SHAP values obtained for each model. Source data are provided as a Source Data file.
图3 深度学习模型的性能。a、b ROC曲线显示真正率与假正率之间的关系,PR曲线显示阳性预测值与灵敏度之间的关系,其中a为NACC测试集,b为OASIS数据集。a和b中的第一行表示MRI-only模型、非成像模型和融合模型(CNN + CatBoost)对具有NC与不具有NC的个案进行分类(COGNC任务)的性能。第二行显示了MRI-only模型、非成像模型和融合模型在COGDE任务中的ROC和PR曲线,该任务旨在区分具有DE与不具有DE的个案。第三行展示了MRI-only模型、非成像模型和融合模型在区分AD与nADD方面的性能。对于每条曲线,计算了平均AUC。在每个图中,均值ROC/PR曲线和标准差分别显示为粗体线和阴影区域。每个图中的虚线表示具有随机性能水平的分类器。c、d 展示了融合模型在COG和ADD任务中跨交叉验证轮次(n = 5)的平均绝对SHAP值最高的十五个特征。在柱状图上叠加的误差条位于数据均值并延伸/减去一个标准偏差。对于每个任务,MRI扫描、人口统计学信息、病史、功能评估和神经心理测试结果被用作深度学习模型的输入。c和d中的左图展示了SHAP值的分布,右图显示了平均绝对SHAP值。c和d中的所有图均按平均绝对SHAP值递减顺序组织。e、f 为了比较,我们还构建了传统的机器学习模型,使用与深度学习模型相同的特征集来预测认知状态和AD状态,结果分别显示在e和f中。热力图显示了每个模型中获得的具有最高平均绝对SHAP值的十五个特征。源数据作为源数据文件提供。
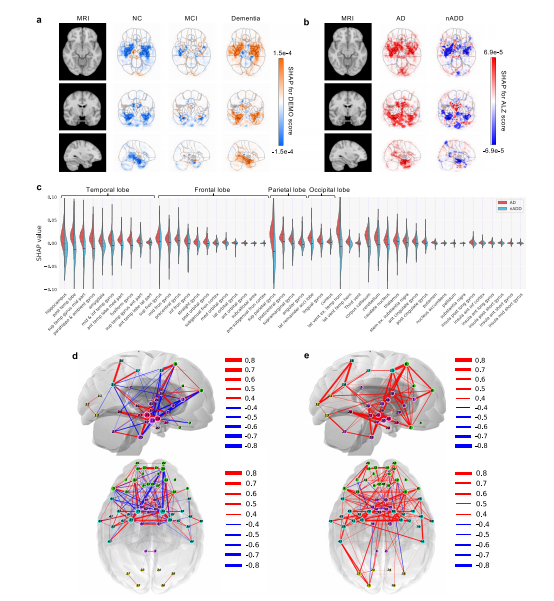
Fig. 4 Neuroimaging signatures of dementia. a, b SHAP value-based illustration of brain regions that are most associated with the outcomes. The firstcolumns in both a and b show a template MRI oriented in axial, coronal, and sagittal planes. In a, the second, third and fourth columns show SHAP valuesfrom the input features of the second convolutional block of the CNN averaged across all NACC test subjects with NC, MCI, and dementia, respectively. Inb, the second and third columns show SHAP values averaged across all NACC test subjects with AD and nADD, respectively. c Brain region-specific SHAPvalues for both AD and nADD cases obtained from the NACC testing data are shown. The violin plots are organized per lobe and in decreasing order ofmean absolute SHAP values. d, e Network of brain regions implicated in the classification of AD and nADD, respectively. We selected 33 representativebrain regions for graph analysis and visualization of sagittal regions, as well as 57 regions for axial analyses. Nodes representing brain regions are overlaidon a two-dimensional brain template and sized according to weighted degree. The color of the segments connecting different nodes indicates the sign ofcorrelation and the thickness of the segments indicates the magnitude of the correlation. It must be noted that not all nodes can be seen either from thesagittal or the axial planes. Source data are provided as a Source Data file.
图4 痴呆的神经影像标志。a、b 基于SHAP值的示意图,显示与结果最相关的脑区。a和b中的第一列显示定向于轴向、冠状和矢状平面的模板MRI。在a中,第二、第三和第四列显示了CNN第二个卷积块的输入特征的SHAP值,分别对所有具有NC、MCI和痴呆的NACC测试对象进行了平均。在b中,第二和第三列分别显示了在所有具有AD和nADD的NACC测试对象中平均的SHAP值。c 显示了来自NACC测试数据的AD和nADD病例的特定于脑区的SHAP值。小提琴图按叶叶组织,并按平均绝对SHAP值递减顺序组织。d、e 分别显示了与AD和nADD分类相关的脑区网络。我们选择了33个代表性脑区进行图分析,并可视化矢状脑区,以及57个区域进行轴向分析。代表脑区的节点叠加在二维脑模板上,并根据加权度进行大小调整。连接不同节点的线段的颜色表示相关性的符号,线段的粗细表示相关性的大小。需要注意的是,并非所有节点都可以从矢状平面或轴向平面看到。源数据作为源数据文件提供。
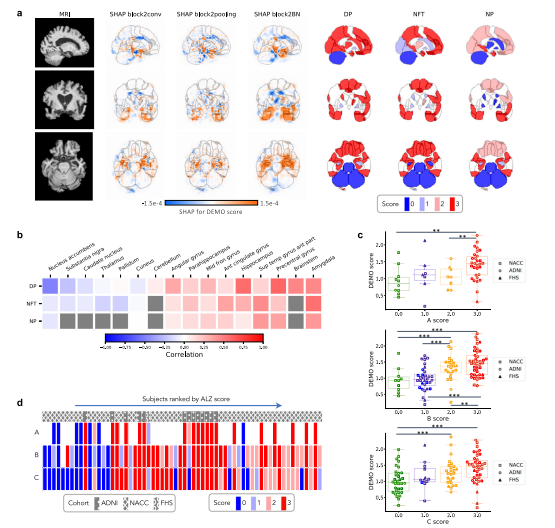
Fig. 5 Neuropathological validation. We correlated model findings with regional ABC scores of neuropathologic severity obtained autopsied participants inNACC, ADNI, and FHS cohorts (n = 110). a An example case from the Alzheimer’s Disease Neuroimaging Initiative (ADNI) dataset is displayed in sagittal,axial, and coronal views. The SHAP values derived from the second convolutional block and neuropathologic ABC scores are mapped to brain regionswhere they were measured at the time of autopsy. Visually, high concordance is observed between anatomically mapped SHAP values regardless of thehidden layer from which they are derived. Concordance is observed between the SHAP values and neurofibrillary tangles (NFT) scores within the temporallobe. b A heatmap is shown demonstrating Spearman correlations between population-averaged SHAP values from the input features of the secondconvolutional layer and stain-specific ABC scores at various regions of the brain. A strong positive correlation is observed between the SHAP values andneuropathologic changes within several areas well-known to be affected in AD such as the hippocampus/parahippocampus, amygdala and temporal gyrus.c Beeswarm plots with overlying box-and-whisker diagrams are shown to denote the distribution of ABC system sub-scores (horizontal axis) versus modelpredicted cognitive scores (vertical axis). The displayed data points represent a pooled set of participants from ADNI, NACC, and FHS for whomneuropathology reports were available from autopsy. Each symbol represents a study participant, boxes are centered at the median and extend over theinterquartile range (IQR), while bottom and top whiskers represent 1st and 3rd quartiles −/+ 1.5 x IQR, respectively. We denote p < 0.05 as *; p < 0.001 as, and p < 0.0001 as *** based on post-hoc Tukey testing. d A heatmap demonstrating the distribution of neuropathology scores versus model predictedAD probabilities. Herein, each column within the map represents a unique individual whose position along the horizontal axis is a descending function ofAD risk according to the deep learning model. The overlying hatching pattern represents the dataset (ADNI, NACC, and FHS), from which everyone isdrawn. Source data are provided as a Source Data file.
图5 神经病理验证。我们将模型结果与在NACC、ADNI和FHS队列中进行尸检的参与者的神经病理严重程度的区域ABC评分进行了相关分析(n = 110)。a 显示了来自阿尔茨海默病神经影像研究倡议(ADNI)数据集的一个案例,显示了矢状、轴向和冠状视图。来自第二个卷积块的SHAP值和神经病理ABC分数被映射到大脑区域,这些分数是在尸检时测量的。在视觉上,不管它们来自哪个隐藏层,解剖映射的SHAP值之间存在高度一致性。SHAP值与颞叶内神经原纤维缠结(NFT)得分之间存在一致性。b 展示了一个热图,显示了来自第二个卷积层的输入特征的人口平均SHAP值与大脑各个区域的染色特异性ABC分数之间的Spearman相关性。在一些众所周知受AD影响的区域,如海马/旁海马区、杏仁核和颞回,SHAP值与神经病理变化之间存在强烈的正相关性。c 展示了蜜蜂图和覆盖在上方的箱形图,用以表示ABC系统子分数(水平轴)与模型预测的认知分数(垂直轴)的分布。显示的数据点代表了从尸检获得神经病理报告的ADNI、NACC和FHS的参与者的混合集。每个符号代表一个研究参与者,箱形图以中位数为中心,并延伸至四分位距(IQR),底部和顶部的whiskers代表1st和3rd quartiles −/+ 1.5 x IQR,分别。我们根据事后Tukey检验将p < 0.05表示为;p < 0.001表示为;p < 0.0001表示为。d 展示了神经病理分数与模型预测的AD概率的分布热图。在此,地图中的每一列代表一个独特的个体,其沿水平轴的位置是根据深度学习模型的AD风险的降序函数确定的。覆盖在上方的填充图案表示数据集(ADNI、NACC和FHS),其中每个个体来自不同的数据集。源数据作为源数据文件提供。
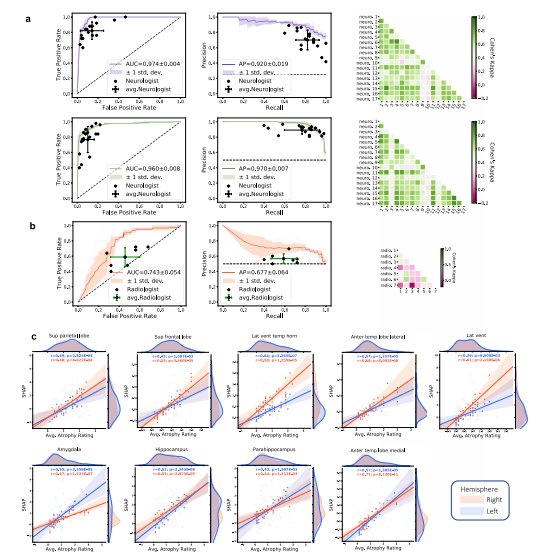
Fig. 6 Expert-level validation. a For the COGNC task (Row 1), the diagnostic accuracy of board-certified neurologists (n = 17) is compared to theperformance of our deep learning model using a random subset of cases from the NACC dataset (n = 100). Metrics from individual clinicians are plotted inrelation to the ROC and PR curves from the trained model. Individual clinician performance is indicated by the blue plus symbol and averaged clinicianperformance along with error bars is indicated by the green plus symbol on both the ROC and PR curves. The mean ROC/PR curve and the standarddeviation are shown as the bold line and shaded region, respectively. A heatmap of pairwise Cohen’s kappa statistic is also displayed to demonstrate interrater agreement across the clinician cohort. For the COGDE task (Row 2), ROC, PR, and interrater agreement graphics are illustrated with comparison toboard-certified neurologists in identical fashion. For these tasks, all neurologists were granted access to multimodal patient data, including MRIs,demographics, medical history, functional assessments, and neuropsychological testing. The same data was used as input to train the deep learning model.b For validation of our ADD task, a random subset (n = 50) of cases with dementia from the NACC cohort was provided to the team of neuroradiologists(n = 7), who classified AD versus those with dementia due to other etiologies (nADD). As above, the diagnostic accuracy of the physician cohort iscompared to model performance using ROC and PR curves. Graphical conventions for visualizing model and clinician performance are as described abovein a and, once more, pairwise Cohen’s kappa values are shown to demonstrate inter-rater agreement. c SHAP values from the second convolutional layeraveraged from selected brain regions are shown plotted against atrophy scores assigned by neuroradiologists. Orange and blue points (and along withregression lines and 95% confidence intervals) represent left and right hemispheres, respectively. Spearman correlation coefficients and correspondingtwo-tailed p values are also shown and demonstrate a statistically significant proportionality between SHAP scores, and the severity of regional atrophyassigned by clinicians. Source data are provided as a Source Data file.
图6 专家级验证。a 对于COGNC任务(第一行),将17名获得认证的神经学家的诊断准确性与我们的深度学习模型的性能进行比较,使用NACC数据集的随机子集(n = 100)。将每个临床医生的指标绘制在已训练模型的ROC和PR曲线上。蓝色加号符号表示单个临床医生的表现,绿色加号符号表示平均临床医生的表现,误差条形图也显示在ROC和PR曲线上。粗体线和阴影区域分别表示平均ROC/PR曲线和标准差。还显示了成对的Cohen's kappa统计量的热图,以显示临床医生队列之间的一致性。对于COGDE任务(第二行),ROC、PR和评估员间协议图形与获得认证的神经学家进行比较,方式相同。对于这些任务,所有神经学家都被授予访问多模态患者数据的权限,包括MRI、人口统计学数据、病史、功能评估和神经心理测试。相同的数据用作训练深度学习模型的输入。b 为了验证我们的ADD任务,从NACC队列中随机选择了一个痴呆症例的子集(n = 50),提供给了7名神经放射科医师团队,他们对AD与其他病因导致的痴呆症(nADD)进行分类。与a中一样,将医生队列的诊断准确性与模型性能进行比较,使用ROC和PR曲线。用于可视化模型和临床医生表现的图形约定如上所述,在一次显示成对的Cohen's kappa值以显示评估员间的一致性。c 显示了从第二个卷积层选择的脑区平均的SHAP值与神经放射科医师分配的萎缩分数的散点图。橙色和蓝色点(以及回归线和95%置信区间)分别代表左侧和右侧半球。还显示了Spearman相关系数和相应的双尾p值,表明SHAP分数与临床医生分配的区域萎缩的严重程度之间存在显著的正比关系。源数据作为源数据文件提供。
Table
表
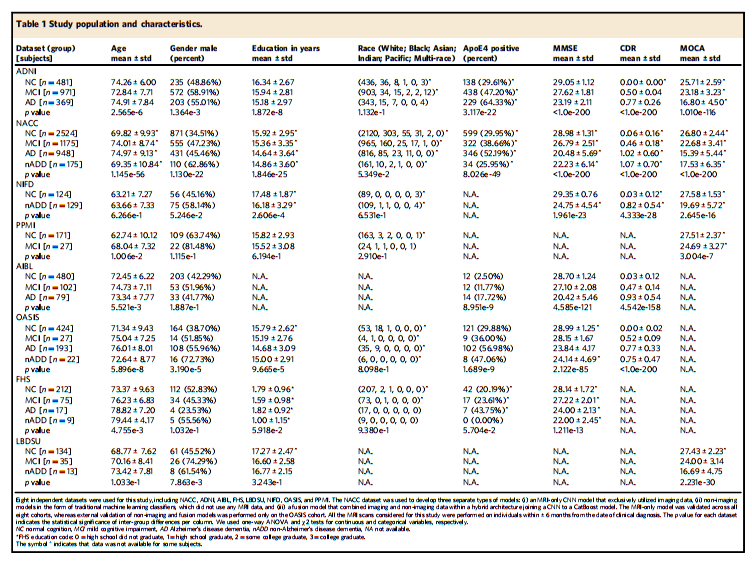
Table 1 Study population and characteristics.
表1 研究人群及特征。
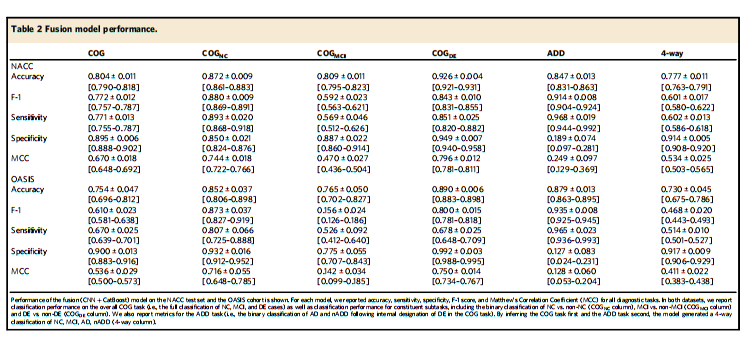
Table 2 Fusion model performance.
表2 融合模型性能。


 674
674


 被折叠的 条评论
为什么被折叠?
被折叠的 条评论
为什么被折叠?
 到【灌水乐园】发言


