


Title
题目
Unified Multi-Modal Image Synthesis for Missing Modality Imputation
《统一多模态图像合成用于缺失模态插补》
01
文献速递介绍
多模态医学图像因其能够提供互补的软组织特征和诊断信息,被广泛应用于疾病筛查和诊断。例如,常见的磁共振(MR)序列包括T1加权、T2加权、后对比T1加权(T1Gd)和液体衰减反转恢复(FLAIR)图像,每种都被视为突显特定解剖和病理的独特模态。在临床上,经常使用多种模态的组合来展示病理变化,并协助临床医生做出准确的诊断。然而,由于限制的扫描时间、运动或伪影引起的图像损坏以及使用不同的成像协议等因素,为每位患者获取完整的多模态图像可能具有挑战性 。处理不完整数据时,简单丢弃是不可取的,因为它通常包含有价值的信息,而重新扫描缺失的序列以完成数据则因数据采集成本高昂而不可行。
因此,多模态图像合成(也称为数据插补)已经被探索,用于从有限的可用数据中生成缺失的模态,这具有潜力在下游数据分析(例如分割、配准)中受益,提高疾病的诊断准确性(例如阿尔茨海默病),并协助手术规划 。
Abstract
摘要
多模态医学图像提供了互补的软组织特征,有助于疾病的筛查和诊断。然而,受限的扫描时间、图像损坏和各种成像协议常常导致多模态图像的不完整,从而限制了多模态数据在临床中的使用。为了解决这个问题,本文提出了一种新颖的统一多模态图像合成方法,用于缺失模态的插补。我们的方法总体采用生成对抗网络架构,旨在从任何可用模态组合中通过单一模型合成缺失的模态。为此,我们特别设计了一个共性和差异敏感的编码器,用于生成器,以利用输入模态中包含的模态不变和特定信息。两种类型信息的结合有助于生成具有一致解剖结构和真实细节的图像。此外,我们提出了一个动态特征统一模块,用于整合来自不同数量的可用模态的信息,使网络对随机缺失模态具有鲁棒性。该模块执行硬整合和软整合,确保特征组合的有效性,同时避免信息丢失。在两个公开的多模态磁共振数据集上验证,所提出的方法在处理各种合成任务方面表现出色,并且相较于之前的方法表现优越。
Method
方法
A. Unified Multi-Modal Synthesis FrameworkIn
this paper, we propose a novel unified synthesis framework for missing modality imputation from arbitrary combinations of available modalities. We mainly consider the unifiedsynthesis task on four-modality MR sequences. However, itshould be noted that our framework can be applied to multimodal data with any number of modalities.
A. 统一多模态合成框架
本文提出了一种新颖的统一合成框架,用于从可用模态的任意组合中进行缺失模态的插补。我们主要考虑四模态MR序列上的统一合成任务。然而,需要注意的是,我们的框架可以应用于具有任意数量模态的多模态数据。
Conclusion
结论
In this paper, we present a novel approach for unified multimodal image synthesis using a generative adversarial network.To fully exploit the commonality and discrepancy informationof available modalities, we introduce a Commonality- andDiscrepancy-Sensitive Encoder for the generator that analysesboth modality-invariant and modality-specific information, respectively. Besides, we devise a Dynamic Feature UnificationModule that can effectively derive the unified features froma varying number of available modalities. Comprehensiveexperiments on the BraTS dataset and IXI dataset demonstratethe superiority of our method over state-of-the-art synthesismethods.
本文提出了一种新颖的统一多模态图像合成方法,利用生成对抗网络。为了充分利用可用模态的共性和差异信息,我们引入了一种对共性和差异敏感的编码器,用于生成器分析模态不变和模态特定信息。此外,我们设计了一个动态特征统一模块,能够有效地从不同数量的可用模态中提取统一特征。在BraTS数据集和IXI数据集上进行的全面实验表明,我们的方法在合成任务上优于现有的最新方法。
Figure
图
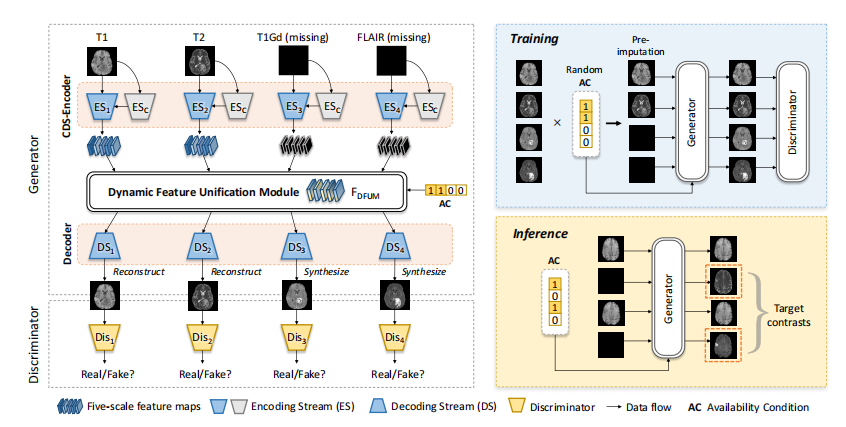
Fig. 1. A schematic view of the proposed unified multi-modal image synthesis method.
图. 1. 所提出的统一多模态图像合成方法的示意图。
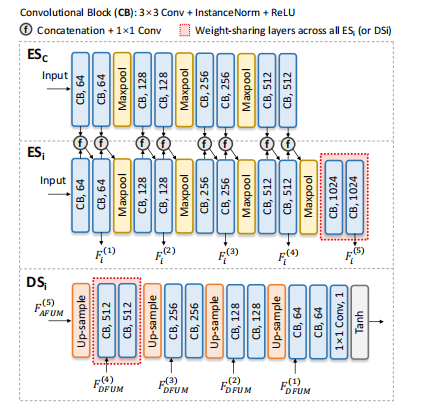
Fig. 2. Illustration of the detailed structures of the common encodingstream (ESC), modality-specific encoding stream (ESi), and modalityspecific decoding streams (DSi).
图. 2. 显示了通用编码流(ESC)、特定模态编码流(ESi)和特定模态解码流(DSi)的详细结构。
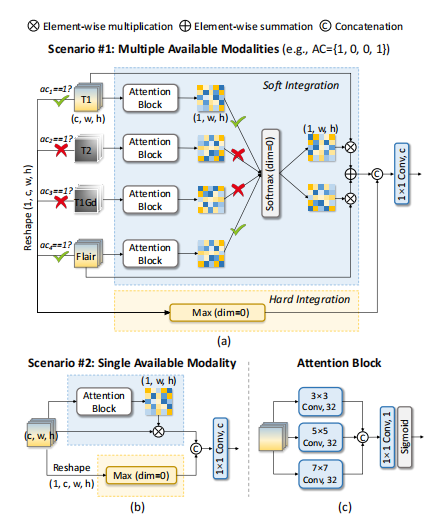
Fig. 3. Illustration of the Dynamic Feature Unification Module (DFUM).(a) The scenario in which multiple modalities are available. (b) Thescenario in which only a single modality is available. (c) The detailedstructure of the attention block.
图. 3. 动态特征统一模块(DFUM)的示意图。(a) 多个模态可用的情况。(b) 只有单个模态可用的情况。(c) 注意力块的详细结构。
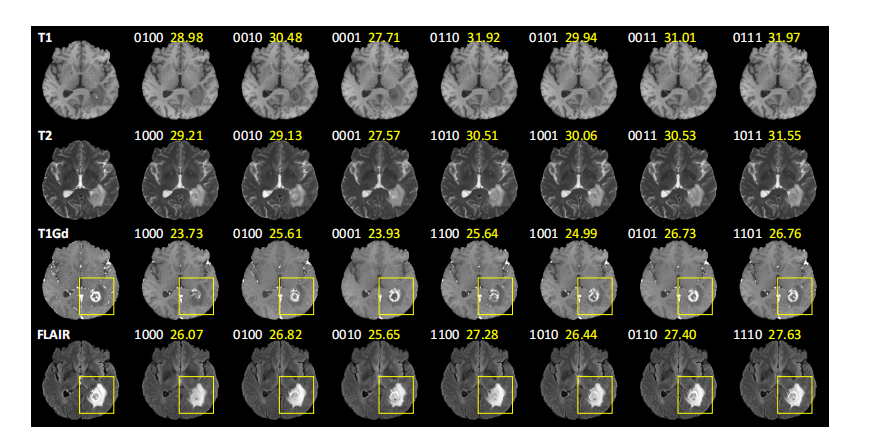
Fig. 4. Visual examples of synthetic images produced by our method on the BraTS dataset. The four-bit digits represent the Availability Conditionsof T1, T2, T1Gd, and FLAIR modalities, in which “0” represents the “missing” modality and “1” represents the “available” modality. Yellow boxesemphasize the obvious difference between images. The yellow decimals represent PSNR values.
图. 4. 我们方法在BraTS数据集上生成的合成图像的视觉示例。四位数字表示T1、T2、T1Gd和FLAIR模态的可用情况,“0”表示“缺失”模态,“1”表示“可用”模态。黄色框强调图像之间的显著差异。黄色小数点表示PSNR值。
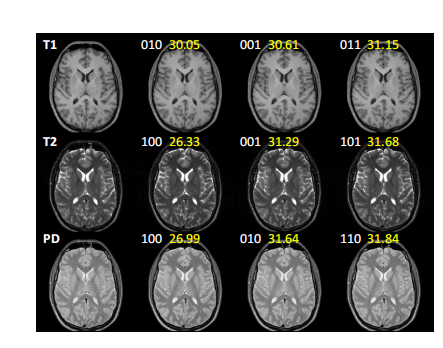
Fig. 5. Visual examples of synthetic images produced by our method onthe IXI dataset. The three-bit digits represent the Availability Conditionsof T1, T2, and PD modalities, in which “0” represents “missing” modalityand “1” represents “available” modality. The yellow decimals representPSNR values.
图. 5. 我们方法在IXI数据集上生成的合成图像的视觉示例。三位数字表示T1、T2和PD模态的可用情况,“0”表示“缺失”模态,“1”表示“可用”模态。黄色小数点表示PSNR值。
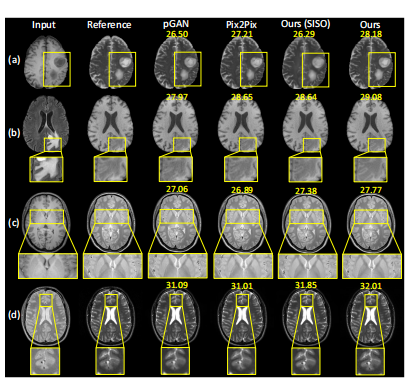
Fig. 6. Visual examples of comparison results in one-to-one synthesistasks on two datasets: (a) T1→T2 and (b) FLAIR→T1 in the BraTSdataset; (c) T1→PD and (d) PD→T2 in the IXI dataset. Yellow boxesemphasize distinctions between images, in which regions with subtledifferences are enlarged for a better view. The yellow decimals representPSNR values.
图. 6. 在两个数据集上进行一对一合成任务的视觉比较结果示例:(a) 在BraTS数据集上的T1→T2任务;(b) 在BraTS数据集上的FLAIR→T1任务;(c) 在IXI数据集上的T1→PD任务;(d) 在IXI数据集上的PD→T2任务。黄色框强调图像之间的差异,在细微差异的区域进行了放大以便更好地观察。黄色小数点表示PSNR值。
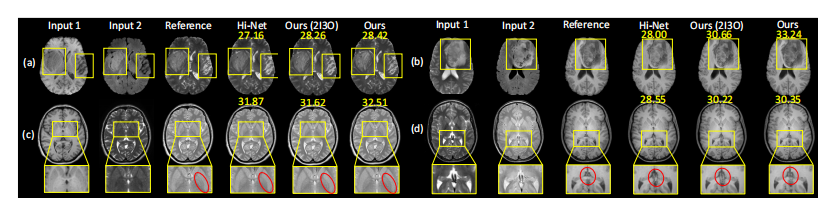
Fig. 7. Visual examples of comparison results in many-to-one synthesis tasks on two datasets: (a) T1+FLAIR→T2 and (b) T2+FLAIR→T1 in theBraTS dataset; (c) T1+T2→PD and (d) T2+PD→T1 in the IXI dataset. Yellow boxes emphasize distinctions between images, in which regions withsubtle differences are enlarged for a better view, the red ellipse emphasizes the streaking noises, and the yellow decimals represent PSNR values.
图.7. 在两个数据集上进行多对一合成任务的视觉比较结果示例:(a) 在BraTS数据集上的T1+FLAIR→T2任务;(b) 在BraTS数据集上的T2+FLAIR→T1任务;(c) 在IXI数据集上的T1+T2→PD任务;(d) 在IXI数据集上的T2+PD→T1任务。黄色框强调图像之间的差异,在细微差异的区域进行了放大以便更好地观察,红色椭圆强调条纹噪声,黄色小数点表示PSNR值。
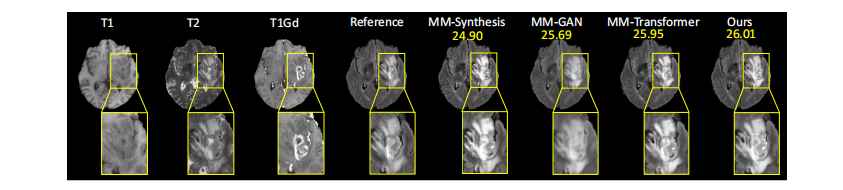
Fig.8.Representativeexamples(T1+T2+T1Gd→FLAIR) of unified synthesis on the BraTS dataset. Yellow boxes emphasize distinctions betweenimages, which are enlarged for a better view, and the yellow decimals represent PSNR values.
图. 8. 在BraTS数据集上进行统一合成(T1+T2+T1Gd→FLAIR)的代表性示例。黄色框强调图像之间的差异,在细微差异的区域进行了放大以便更好地观察,黄色小数点表示PSNR值。
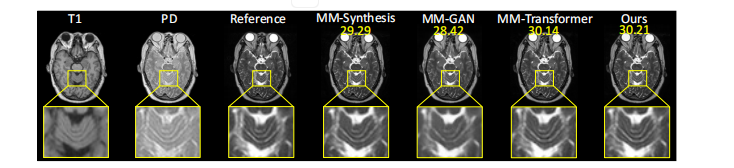
Fig. 9. Representative examples (T1+PD→T2) of unified synthesis on the IXI dataset. Yellow boxes emphasize distinctions between images,which are enlarged for a better view, and the yellow decimals represent PSNR values.
图. 9. 在IXI数据集上进行统一合成(T1+PD→T2)的代表性示例。黄色框强调图像之间的差异,在细微差异的区域进行了放大以便更好地观察,黄色小数点表示PSNR值
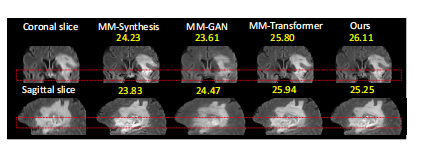
Fig. 10. Synthetic FLAIR images (T1+T2+T1Gd→FLAIR) in coronaland sagittal views. Red dotted boxes emphasize discontinuity in images.The yellow decimals represent PSNR values.
图. 10. 合成的FLAIR图像(T1+T2+T1Gd→FLAIR)在冠状面和矢状面的视图中。红色虚线框强调图像中的不连续性。黄色小数点表示PSNR值。
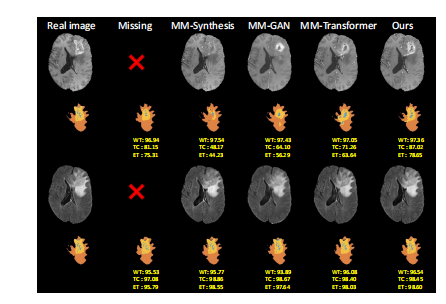
Fig. 11. Tumor segmentation with real and imputed T1Gd/FLAIR images. The necrotic and non-enhancing tumor core (NCR/NET) regionsare filled in blue, enhancing tumor (ET) regions are filled in yellow,and peritumoral edema (ED) regions are filled in orange. Note thatthe tumor core (TC) consists of NCR/NET and ET; the whole tumor(WT) consists of TC and ED. The yellow decimals represent the DiceCoefficient scores.
图. 11. 使用真实和插补的T1Gd/FLAIR图像进行肿瘤分割。坏死性和非增强性肿瘤核心(NCR/NET)区域填充为蓝色,增强性肿瘤(ET)区域填充为黄色,肿瘤周围水肿(ED)区域填充为橙色。注意肿瘤核心(TC)由NCR/NET和ET组成;整个肿瘤(WT)由TC和ED组成。黄色小数点表示Dice系数分数。
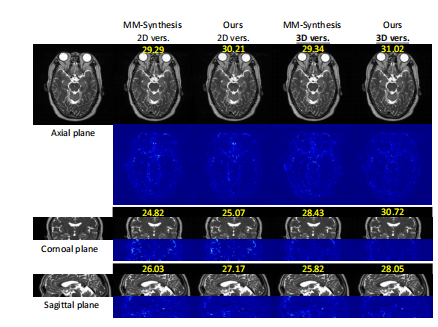
Fig. 12. Synthetic T2 images (T1+PD→T2) in axial, coronal andsagittal views. The second, fourth, and sixth rows present differencemaps between synthetic images and real images, which help recognizesubtle differences. The yellow decimals represent PSNR values.
图12合成的T2图像(T1+PD→T2)在轴位、冠状位和矢状位的视图中。第二、第四和第六行展示了合成图像与真实图像之间的差异图,有助于识别细微差异。黄色小数点表示PSNR值。
Table
表
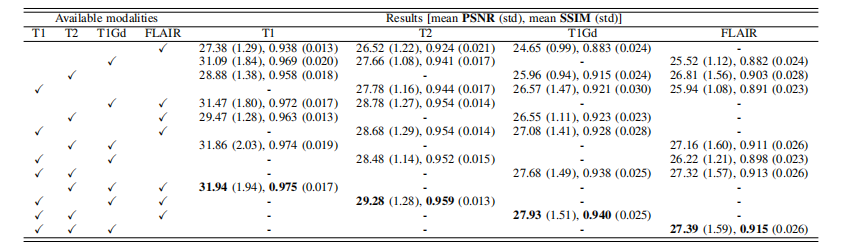
TABLE I quantitative results of our method on the brats dataset.
表格 I:我们方法在BraTS数据集上的定量结果。
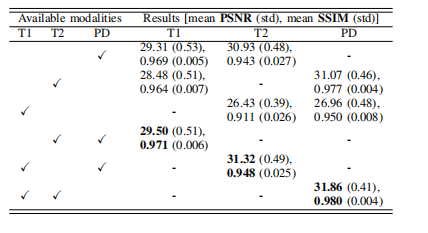
TABLE II quantitative results on the brats testing set. hd95 is represented as hd95(nan ratio). i, ii, and iii represent discriminative, generative diffusion, and integrated methods, respectively.
表 II BraTS 测试集上的定量结果。HD95 以 HD95(NAN 比率) 表示。I、II 和 III 分别代表判别方法、生成扩散方法和集成方法。
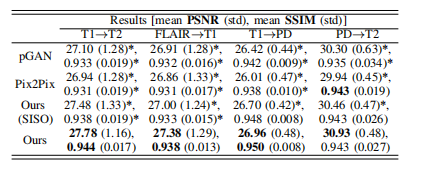
TABLE III Quantitative comparison with one-to-one synthesis methods in various tasks on the brats dataset (t1→t2 and flair→t1) and ixi dataset (t1→pd and pd→t2). The results with * indicate p<0.05 compared with our method based on Wilcoxon signed-rank test.
表格 III 在BraTS数据集(T1→T2和FLAIR→T1任务)和IXI数据集(T1→PD和PD→T2任务)上,与一对一合成方法的定量比较。带有的结果表示与我们方法相比,基于Wilcoxon符号秩检验p<0.05。
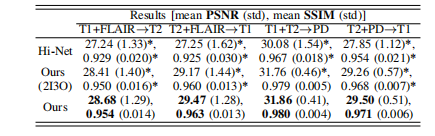
TABLE IV quantitative comparison with many-to-one synthesis methods in various tasks on the brats dataset (t1+flair→t2 and t2+flair→t1) and ixi dataset (t1+t2→pd and t2+pd→t1). the results with * indicate p<0.05 compared with our method based on wilcoxon signed-rank test.
表格 IV 在BraTS数据集(T1+FLAIR→T2和T2+FLAIR→T1任务)以及IXI数据集(T1+T2→PD和T2+PD→T1任务)上,与多对一合成方法的定量比较。带有的结果表示与我们方法相比,基于Wilcoxon符号秩检验p<0.05。
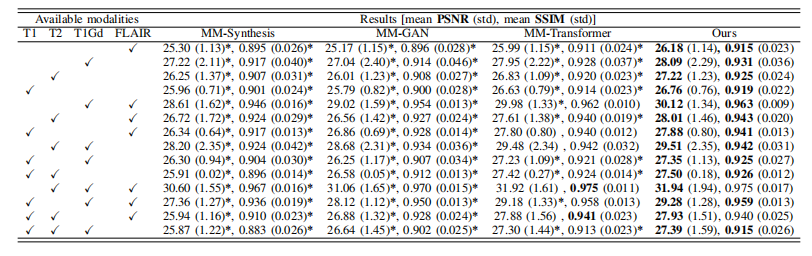
TABLE V quantitative comparison results of our method and other unified synthesis methods on the brats dataset. the results with * indicate p<0.05 compared with our method based on wilcoxon signed-rank test.
表格V我们方法与其他统一合成方法在BraTS数据集上的定量比较结果。带有的结果表示与我们方法相比,基于Wilcoxon符号秩检验p<0.05。

TABLE VIquantitative comparison results of our method and other unified synthesis methods on the ixi dataset. the results with indicate p<0.05 compared with our method based on wilcoxon signed-rank test.
表格VI我们方法与其他统一合成方法在IXI数据集上的定量比较结果。带有的结果表示与我们方法相比,基于Wilcoxon符号秩检验p<0.05。
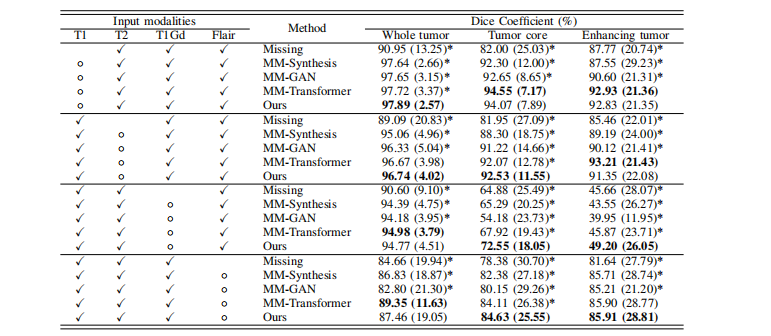
TABLE VII tumor segmentation evaluation on the brats dataset. the dice coefficient scores (%) are computed between masks generated by real four-modal sequences and imputed sequences. “✓" means available real images, and “◦" means imputed images produced by networks. the results with indicate p<0.05 compared with our method based on wilcoxon signed-rank test.
表格VII在BraTS数据集上的肿瘤分割评估。Dice系数得分(%)是真实四模态序列生成的掩膜与插补序列生成的掩膜之间计算得到的。"✓" 表示可用的真实图像,"◦" 表示网络生成的插补图像。带有的结果表示与我们方法相比,基于Wilcoxon符号秩检验p<0.05。
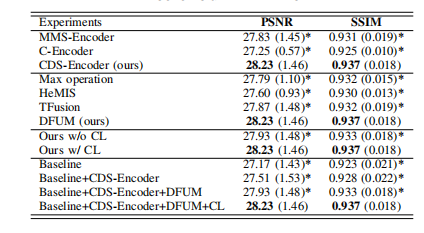
TABLE VIII ablation study on the brats dataset. all results are averaged across 14 input scenarios. the results with * indicate p<0.05 compared with our method based on wilcoxon signed-rank test.
表格 VIII在BraTS数据集上的剔除研究。所有结果均在14个输入场景中进行了平均。带有的结果表示与我们方法相比,基于Wilcoxon符号秩检验p<0.05。
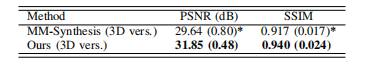
TABLE IXquantitative comparison results of our method (3d vers.) and mm-synthesis (3d vers.) on the ixi dataset regarding task t1+pd→t2. the results with indicate p<0.05 compared with our method based on wilcoxon signed-rank test.
表格IX我们方法(3D版本)与MM-Synthesis(3D版本)在IXI数据集上进行T1+PD→T2任务的定量比较结果。带有的结果表示与我们方法相比,基于Wilcoxon符号秩检验p<0.05。


 839
839


 被折叠的 条评论
为什么被折叠?
被折叠的 条评论
为什么被折叠?
 到【灌水乐园】发言


