


Title
题目
CT Chest Imaging Using Normalized Join-Count: Predicting Emphysema Progression in the CanCOLD Study
使用归一化连接计数的胸部CT成像:预测CanCOLD研究中的肺气肿进展
Background
背景
Pre-existing emphysema is recognized as an indicator of future worsening in patients with chronic obstructive pulmonary disease (COPD) when observed through CT imaging. However, it remains uncertain whether additional factors, such as the spatial compactness of CT emphysema, might also serve as predictors of disease progression.
通过CT成像观察到的既存肺气肿被认为是慢性阻塞性肺病(COPD)患者未来病情恶化的指标。然而,尚不确定是否还有其他因素,如CT肺气肿的空间紧凑性,也可能作为疾病进展的预测指标。
Method
方法
This secondary analysis uses data from the prospective Canadian Cohort Obstructive Lung Disease (CanCOLD) study, examining CT images obtained in participants with and without COPD at baseline and a 3-year follow-up time point (November 2009 to November 2018). Measurements of forced expiratory volume in first second of expiration (FEV1 ) and diffusing capacity of lung for carbon monoxide (DLco) were collected. The normalized join-count (NJC) measurement from baseline CT images and lung density (LD) changes were analyzed. Emphysema progression was defined as an annualized LD change of less than half an SD below the mean of the participants without COPD with no smoking history. Multivariable linear and logistic regression models were used to assess the association between baseline CT NJC measurements and the annualized change in LD, FEV1 , DLco, and emphysema progression versus nonprogression.
这项次级分析使用了前瞻性加拿大阻塞性肺病队列研究(CanCOLD)的数据,检查了基线和3年随访时点(2009年11月至2018年11月)在有COPD和无COPD参与者中获得的CT图像。收集了第一秒呼气量(FEV1)和一氧化碳弥散能力(DLco)的测量值。分析了基线CT图像的归一化连接计数(NJC)测量值和肺密度(LD)变化。肺气肿进展被定义为年均LD变化低于无COPD且无吸烟史参与者平均值半个标准差。使用多变量线性和逻辑回归模型评估基线CT NJC测量值与年均LD变化、FEV1、DLco以及肺气肿进展与非进展之间的关联。
Conclusion
结论
The spatial distribution, or “compactness,” of CT emphysema voxels predicted emphysema progression in individuals with and without COPD.
CT肺气肿体素的空间分布或“紧凑性”预测了有COPD和无COPD个体的肺气肿进展。
Results
结果
A total of 524 participants (mean age, 66 years ± 10 [SD]; 293 male) (FEV1 percent predicted, 88% ± 19; FEV1 /FVC, 67% ± 9; DLco percent predicted, 105% ± 25) were analyzed, 187 (36%) of whom had COPD. CT NJC was associated with the annualized change in LD (P < .001), FEV1 (P = .02), and DLco (P = .01). Additionally, CT NJC predicted emphysema progression versus nonprogression (odds ratio, 2.24; 95% CI: 1.37, 3.50; P < .001).
共分析了524名参与者(平均年龄66岁±10 [SD];293名男性)(预测的FEV1百分比,88% ± 19;FEV1/FVC,67% ± 9;预测的DLco百分比,105% ± 25),其中187名(36%)患有COPD。CT NJC与年均LD变化(P < .001)、FEV1(P = .02)和DLco(P = .01)相关。此外,CT NJC预测了肺气肿进展与非进展(比值比,2.24;95% CI:1.37, 3.50;P < .001)。
Figure
图
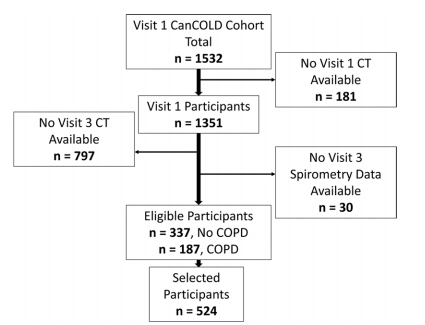
Figure 1: Flowchart shows study inclusion and exclusion. CanCOLD = Canadian Cohort Obstructive Lung Disease, COPD = chronic obstructive pulmonary disease.
图1:流程图显示了研究的纳入和排除标准。CanCOLD = 加拿大阻塞性肺病队列研究,COPD = 慢性阻塞性肺病。
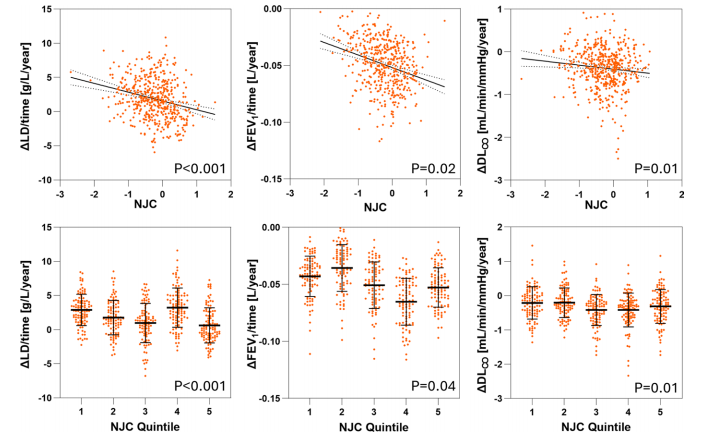
Figure 2: Partial regression plots show annualized change (Δ) in lung density (LD), forced expiratory volume in first second of expiration (FEV1 ), and diffusing capacity of lung for carbon monoxide (DLco) with respect to continuous normalized join-count (NJC) (top) and quintiles of NJC (bottom). Dotted lines represent 95% CIs of the regression line (top). Bars represent means and error bars represent SDs of a given measurement (bottom).
图2:部分回归图显示了肺密度(LD)、第一秒呼气量(FEV1)和一氧化碳弥散能力(DLco)的年均变化(Δ)相对于连续归一化连接计数(NJC)(顶部)和NJC的五分位数(底部)。虚线表示回归线的95%置信区间(顶部)。柱状图表示给定测量值的平均值,误差线表示标准差(底部)。
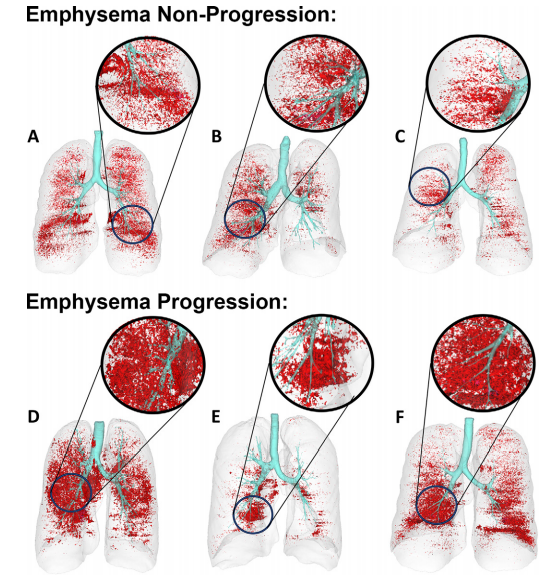
Figure 3: Three-dimensional reconstructions of CT lung volume in participants with (A–C) emphysema nonprogression and (D–F) emphysema progression. Those with progression of emphysema show increased “compactness” of CT emphysema voxels (red) compared with those without progression. Normalized join-count (NJC) and lung density (LD) values for each reconstruction are as follows: (A) NJC = 0.14%, LD = 49 g/L; (B) NJC = 0.15%, LD = 53 g/L; (C) NJC = 0.18%, LD = 59 g/L; (D) NJC = 1.28%, LD = 36 g/L; (E) NJC = 1.73%, LD = 34 g/L; (F) NJC = 2.19%, LD= 38 g/L.
图3:在参与者中的CT肺体积的三维重建图显示了(A–C)肺气肿无进展和(D–F)肺气肿进展。与无进展者相比,肺气肿进展者显示出CT肺气肿体素(红色)的“紧凑性”增加。每个重建图的归一化连接计数(NJC)和肺密度(LD)值如下:(A)NJC = 0.14%,LD = 49 g/L;(B)NJC = 0.15%,LD = 53 g/L;(C)NJC = 0.18%,LD = 59 g/L;(D)NJC = 1.28%,LD = 36 g/L;(E)NJC = 1.73%,LD = 34 g/L;(F)NJC = 2.19%,LD = 38 g/L。
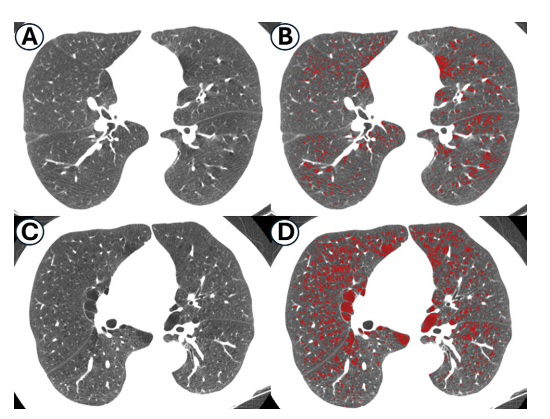
Figure 4: Axial CT images in participants with (A, B) nonprogression and (C, D) progression of emphysema. Those with progression of emphysema show increased “compactness” of CT emphysema voxels (red) compared with those without progression of emphysema. Normalized join-count (NJC) and lung density (LD) values are as follows: (A, B) NJC = 0.18, LD = 47 g/L; (B, C) NJC = 0.57, LD = 38 g/L. Images are shown at a window level of −800 HU and window width of 800 HU.
图4:参与者的轴向CT图像中显示(A,B)肺气肿无进展和(C,D)肺气肿进展。与无进展者相比,肺气肿进展者显示出CT肺气肿体素(红色)的“紧凑性”增加。归一化连接计数(NJC)和肺密度(LD)值如下:(A,B)NJC = 0.18,LD = 47 g/L;(B,C)NJC = 0.57,LD = 38 g/L。图像显示在-800 HU的窗位和800 HU的窗宽下。
Table
表
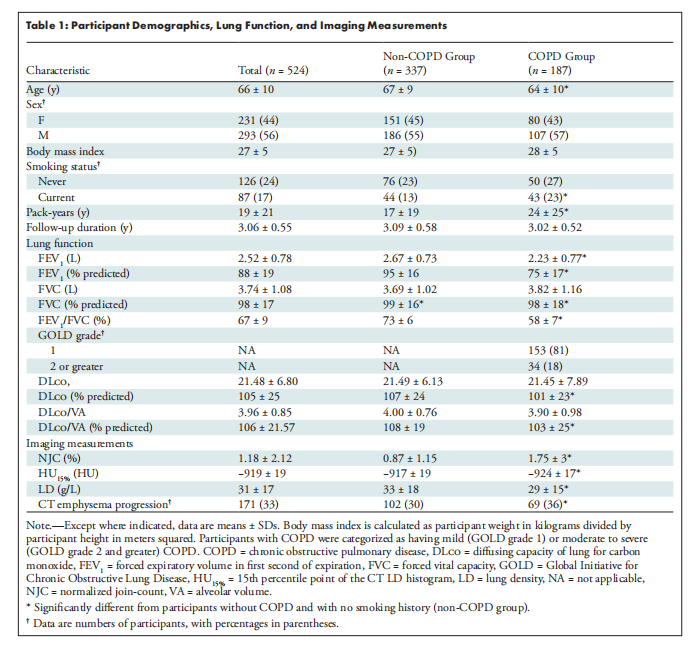
Table 1: Participant Demographics, Lung Function, and Imaging Measurements
表1:参与者的人口统计、肺功能和影像测量
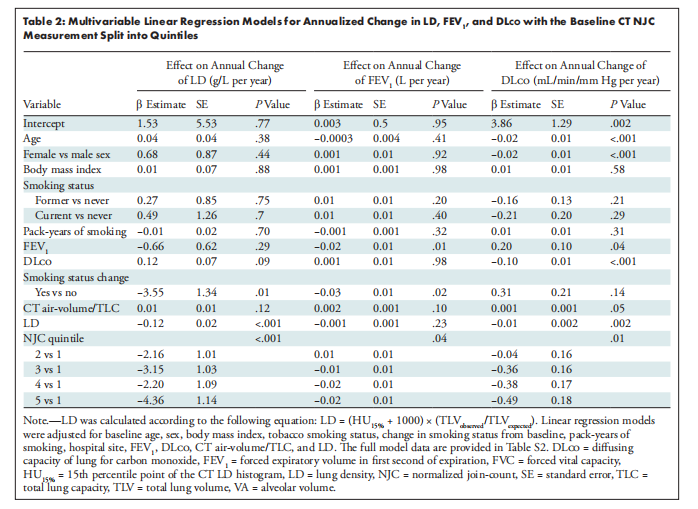
Table 2: Multivariable Linear Regression Models for Annualized Change in LD, FEV1 , and DLco with the Baseline CT NJC Measurement Split into Quintiles
表2:基线CT NJC测量值分为五分位数的年均LD、FEV1和DLco变化的多变量线性回归模型
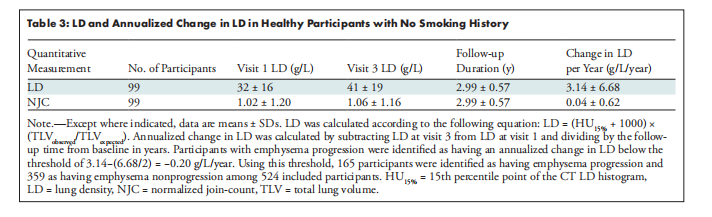
Table 3: LD and Annualized Change in LD in Healthy Participants with No Smoking History
表3:无吸烟史健康参与者的LD及LD年均变化
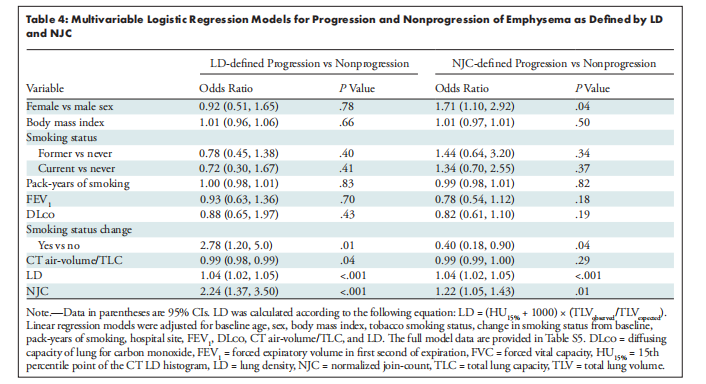
Table 4: Multivariable Logistic Regression Models for Progression and Nonprogression of Emphysema as Defined by LD and NJC
表4:由LD和NJC定义的肺气肿进展和非进展的多变量逻辑回归模型


 5019
5019

 被折叠的 条评论
为什么被折叠?
被折叠的 条评论
为什么被折叠?
 到【灌水乐园】发言


