


点击下方卡片,关注“小白玩转Python”公众号
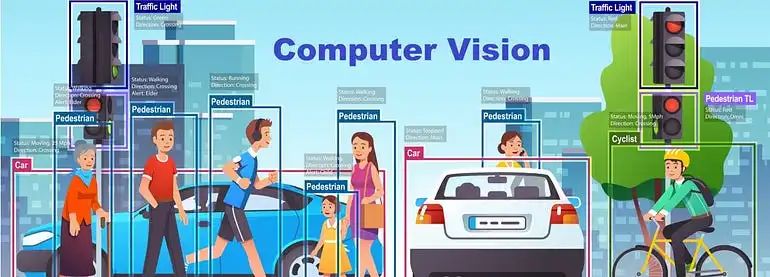
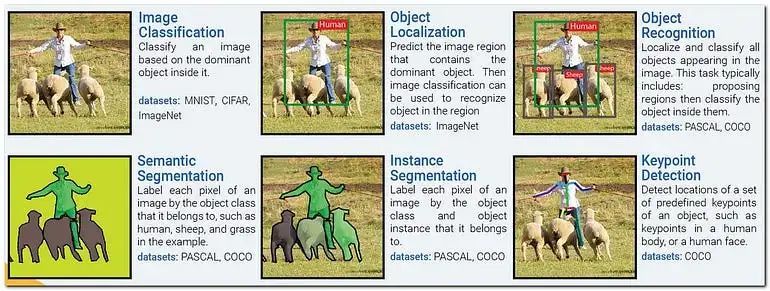
计算机视觉是一个跨学科的科学领域,涉及如何让计算机从数字图像或视频中获得高级理解。从工程的角度来看,它旨在理解和自动化人类视觉系统能够完成的任务。现在,任务分类、物体检测、分割和关键点检测是主要的实时计算机视觉应用。那么,大家认为它是如何发展的呢?首先,我们简要讨论一下计算机视觉的主要问题。
看看上面的图片后,您对与计算机视觉挑战相关的所有关键术语有了清晰的理解。这是一个严重的问题,尽管它取决于问题的陈述。然而,这种困难通常是每个2D计算机视觉工程师都会遇到的。
六年前,我开始了我的图像处理职业生涯,进而学习了计算机视觉,掌握了许多基础知识,然后根据挑战需求转向基于深度学习的模型。例如,我会详细探讨和研究许多数学概念,如resnet和vgg19、unet、efficientnet等。然而,当我与许多学生谈论早期的计算机视觉时,他们都只提到“YOLO”。此外,大多数人不了解YOLO的后端操作。由于YOLO的广泛流行以及与其他模型相比的极高准确性,这才是真正重要的。

每个人都希望有现成的解决方案——只需安装软件包并让过程发生——而不必了解后端操作。解决方案就是YOLO(Ultralytics)。我将讨论YoloV10以及我的视频分析演示项目,该项目通过图表可视化估算物体计数、速度和距离,以商业角度出发。
什么是YOLO?
基于CNN的物体检测器主要用于推荐系统。YOLO(You Only Look Once)模型用于高性能的物体检测。YOLO将图像划分为网格系统,每个网格在其中检测物体。它们可以用于基于数据流的实时物体检测,并且需要很少的计算资源。
目前YoloV10已经发布!YoloV10的主要特点是什么?
实时物体检测旨在以最小的延迟准确预测图像中的物体类别和位置。YOLO系列在性能和效率之间取得了平衡,但仍存在依赖NMS和架构效率低下的问题。YoloV10通过引入无NMS训练和专注于效率和准确性的模型设计策略解决了这些问题。
架构
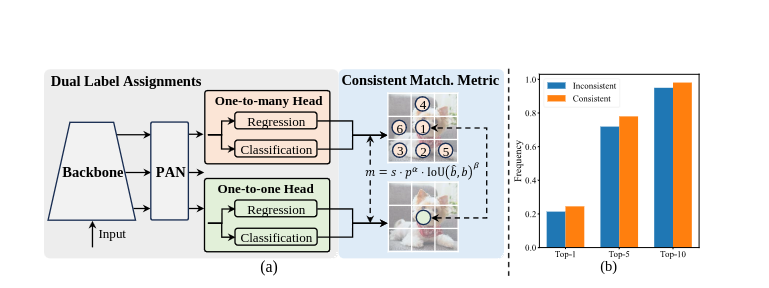
YOLOv10通过几个创新改进了之前的YOLO模型:
Backbone:使用改进的CSPNet以更好的梯度流和减少计算冗余。
Neck:结合PAN层进行有效的多尺度特征融合,聚合不同尺度的特征。
One-to-Many Head:在训练期间为每个物体生成多个预测,丰富了监督信号并提高学习准确性。
One-to-one Head:在推理期间为每个物体输出单一最佳预测,消除了对NMS的需求并减少了延迟。
主要特点
无NMS训练:利用一致的双重分配消除NMS需求,减少推理延迟。
整体模型设计:优化组件以兼顾效率和准确性,具有轻量级分类头、空间通道解耦下采样和排名引导块设计。
增强的模型能力:采用大核卷积和部分自注意模块,在不显著增加计算成本的情况下提高性能。
YOLOV10的特别之处
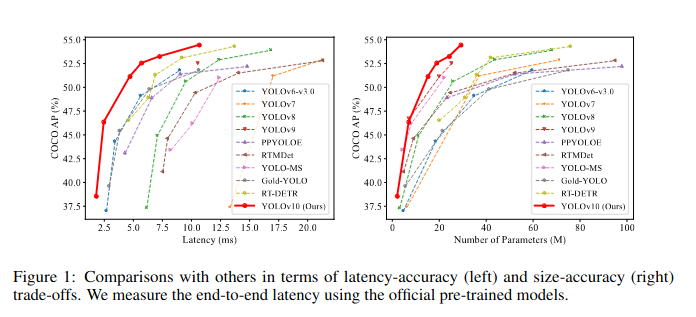
YOLOv10引入了一种突破性的方法进行实时物体检测,消除了非最大抑制(NMS)的需求,并优化了模型组件以获得卓越的性能。通过利用一致的双重分配和整体的效率-准确性驱动的模型设计,YOLOv10实现了最先进的准确性,并减少了计算开销。其架构包括增强的主干和颈部组件,以及创新的一对多和一对一头。凭借针对不同应用需求的模型变体,YOLOv10在准确性和效率方面设定了新标准,超越了之前的YOLO版本和其他当代检测器。例如,YOLOv10-S在COCO数据集上比RT-DETR-R18快1.8倍,具有相似的AP,而YOLOv10-B的延迟减少了46%,参数减少了25%,与YOLOv9-C性能相同。
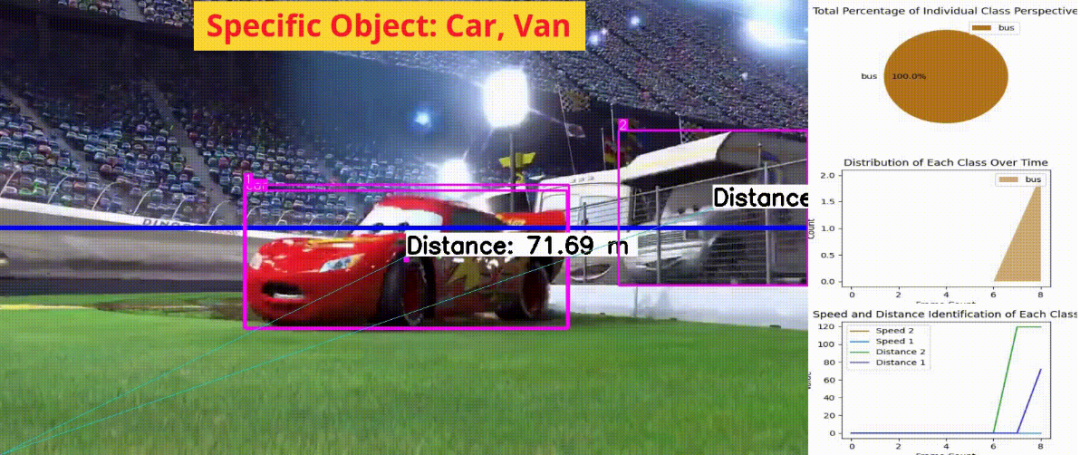
视频分析:图表可视化中的计数、速度、距离估算
在这个项目中,我开发了一个系统,用户可以即时获得特定物体的计数、速度和距离估算,并通过图形进行可视化。这种能力为企业提供了即时且可操作的洞察,带来了巨大的好处。
我使用了Ultralytics的模型,特别是YOLOv8s和YOLOv8n,以其高准确性、效率和低延迟的物体检测而著称。这些模型对于简化终端分析非常重要,使整个过程更加顺畅和有效。
开发体验非常愉快,并展示了通过先进技术解决商业挑战的巨大潜力。虽然YoloV8和YoloV10模型也能产生良好的结果,但YoloV10在准确性和延迟方面表现更好。
'''
Final code: Video Analytics Specific Object


Guidance


1. User Input: Specific object
2. Specific Object detection, Speed and distance estimation
3. Graph Analytics: Pie, Area, Multi-Class line


!pip install ultralytics


'''


#Helper function
def create_pie_chart(data):
    fig, ax = plt.subplots(figsize=(4, 3))  # Aspect ratio of 4:3
    ax.pie(data.values(), labels=data.keys(), autopct='%1.1f%%')
    ax.legend()
    ax.set_title("Total Percentage of Individual Class Perspective")
    plt.close(fig)
    return fig


def create_area_plot(class_counts_over_time):
    fig, ax = plt.subplots(figsize=(4, 3))  # Aspect ratio of 4:3
    sorted_keys = sorted(class_counts_over_time.keys())
    for cls in sorted_keys:
        ax.fill_between(range(len(class_counts_over_time[cls])), class_counts_over_time[cls], label=cls, alpha=0.6)
    ax.legend()
    ax.set_title("Distribution of Each Class Over Time")
    ax.set_xlabel("Frame Count")
    ax.set_ylabel("Count")
    plt.close(fig)
    return fig


def create_multiple_line_plot(speed_data, distance_data, frame_count):
    fig, ax = plt.subplots(figsize=(4, 3))  # Aspect ratio of 4:3
    for track_id in speed_data.keys():
        ax.plot(range(frame_count), speed_data[track_id], label=f"Speed {track_id}")
    for track_id in distance_data.keys():
        ax.plot(range(frame_count), distance_data[track_id], label=f"Distance {track_id}")
    ax.legend()
    ax.set_title("Speed and Distance Identification of Each Class")
    ax.set_xlabel("Frame Count")
    ax.set_ylabel("Value")
    plt.close(fig)
    return fig


def create_scatter_plot(data):
    fig, ax = plt.subplots(figsize=(4, 3))  # Aspect ratio of 4:3
    x = list(data.keys())
    y = list(data.values())
    ax.scatter(x, y)
    ax.set_title("Class Distribution Scatter Plot")
    ax.set_xlabel("Class")
    ax.set_ylabel("Count")
    plt.close(fig)
    return fig


def fig_to_img(fig):
    fig.canvas.draw()
    img = np.frombuffer(fig.canvas.tostring_rgb(), dtype=np.uint8)
    img = img.reshape(fig.canvas.get_width_height()[::-1] + (3,))
    return img


def resize_and_place_image(base_image, overlay_image, position):
    overlay_image_resized = cv2.resize(overlay_image, (w // 3, h // 3))
    x, y = position
    base_image[y:y + overlay_image_resized.shape[0], x:x + overlay_image_resized.shape[1]] = overlay_image_resized
    return base_image


def draw_visualizations(frame, data, labels, speed_data, distance_data, class_counts_over_time, frame_count):
    vis_frame = np.zeros((h, w // 3, 3), dtype=np.uint8)


    # Create Pie Chart
    if data:
        pie_chart = create_pie_chart(data)
        pie_chart_img = fig_to_img(pie_chart)
        vis_frame = resize_and_place_image(vis_frame, pie_chart_img, (0, 0))


    # Create Area Plot
    if class_counts_over_time:
        area_plot = create_area_plot(class_counts_over_time)
        area_plot_img = fig_to_img(area_plot)
        vis_frame = resize_and_place_image(vis_frame, area_plot_img, (0, h // 3))


    # Create Multiple Line Plot
    if speed_data or distance_data:
        line_plot = create_multiple_line_plot(speed_data, distance_data, frame_count)
        line_plot_img = fig_to_img(line_plot)
        vis_frame = resize_and_place_image(vis_frame, line_plot_img, (0, 2 * (h // 3)))


    combined_frame = np.hstack((frame, vis_frame))
    return combined_frame


def pad_lists_to_length(data_dict, length, default_value=0):
    for key in data_dict.keys():
        if len(data_dict[key]) < length:
            data_dict[key] += [default_value] * (length - len(data_dict[key]))


'''
Main function:


Specific input based video analytics
(object count, speed, distance estimation..)


'''


import cv2
import math
import numpy as np
import matplotlib.pyplot as plt
from ultralytics import YOLO
from ultralytics.utils.plotting import Annotator
from ultralytics.solutions import speed_estimation


# Initialize YOLO models
object_detection_model = YOLO("yolov8s.pt")
speed_estimation_model = YOLO("yolov8n.pt")
names = speed_estimation_model.model.names


# Open video file
cap = cv2.VideoCapture("/content/drive/MyDrive/yolo/race.mp4")
assert cap.isOpened(), "Error reading video file"


# Get video properties
w, h, fps = (int(cap.get(x)) for x in (cv2.CAP_PROP_FRAME_WIDTH, cv2.CAP_PROP_FRAME_HEIGHT, cv2.CAP_PROP_FPS))


# Initialize video writer
out = cv2.VideoWriter("Distribution_speed_distance_visual_scatter_unique1hor_car_overall.avi", cv2.VideoWriter_fourcc(*"MJPG"),15, (w + w // 3, h))


frame_count = 0
data = {}
labels = []
class_counts_over_time = {}
speed_over_time = {}
distance_over_time = {}


# Center point and pixel per meter for distance calculation
center_point = (0, h)
pixel_per_meter = 10


# Line points for speed estimation
line_pts = [(0, 360), (1280, 360)]


# Initialize speed-estimation object
speed_obj = speed_estimation.SpeedEstimator(names=names, reg_pts=line_pts, view_img=False)


# Colors for text and bounding box
txt_color, txt_background, bbox_clr = ((0, 0, 0), (255, 255, 255), (255, 0, 255))


print('Example input: horse:17, person: 0,car: 2, van: 8,bus: 5,tree: 62')
# Allow user to input desired classes
user_input = input("Enter desired classes with their IDs (format: 'class1:id1,class2:id2,...'): ")
# Example input: "person:0,car:2,horse:17"
desired_classes = {}
for item in user_input.split(','):
    cls, cls_id = item.split(':')
    desired_classes[cls.strip()] = int(cls_id.strip())


print("Desired classes:", desired_classes)


while cap.isOpened():
    success, frame = cap.read()
    if not success:
        break


    frame_count += 1


    # Object detection for speed estimation
    speed_tracks = speed_estimation_model.track(frame, persist=True, show=False)
    frame = speed_obj.estimate_speed(frame, speed_tracks)


    # Object detection for distance estimation
    annotator = Annotator(frame, line_width=2)
    results = object_detection_model.track(frame, persist=True)


    if results[0].boxes.id is not None:
        boxes = results[0].boxes.xyxy.cpu()
        track_ids = results[0].boxes.id.int().cpu().tolist()
        clss = results[0].boxes.cls.cpu().tolist()


        for box, track_id, cls in zip(boxes, track_ids, clss):
            cls_name = object_detection_model.names[int(cls)]
            if cls_name in desired_classes and desired_classes[cls_name] == cls:  # Filter desired classes and IDs
                if cls_name not in labels:
                    labels.append(cls_name)


                if cls_name in data:
                    data[cls_name] += 1
                else:
                    data[cls_name] = 1


                annotator.box_label(box, label=str(track_id), color=bbox_clr)
                annotator.visioneye(box, center_point)


                x1, y1 = int((box[0] + box[2]) // 2), int((box[1] + box[3]) // 2)  # Bounding box centroid


                distance = (math.sqrt((x1 - center_point[0]) ** 2 + (y1 - center_point[1]) ** 2)) / pixel_per_meter


                text_size, _ = cv2.getTextSize(f"Distance: {distance:.2f} m", cv2.FONT_HERSHEY_SIMPLEX, 1.2, 3)
                cv2.rectangle(frame, (x1, y1 - text_size[1] - 10), (x1 + text_size[0] + 10, y1), txt_background, -1)
                cv2.putText(frame, f"Distance: {distance:.2f} m", (x1, y1 - 5), cv2.FONT_HERSHEY_SIMPLEX, 1.2, txt_color, 3)


                if track_id not in distance_over_time:
                    distance_over_time[track_id] = [0] * (frame_count - 1)
                distance_over_time[track_id].append(distance)


                speed = speed_obj.speeds.get(track_id, 0) if hasattr(speed_obj, 'speeds') else 0
                if track_id not in speed_over_time:
                    speed_over_time[track_id] = [0] * (frame_count - 1)
                speed_over_time[track_id].append(speed)


                if cls_name not in class_counts_over_time:
                    class_counts_over_time[cls_name] = [0] * frame_count
                if len(class_counts_over_time[cls_name]) < frame_count:
                    class_counts_over_time[cls_name].extend([0] * (frame_count - len(class_counts_over_time[cls_name])))
                class_counts_over_time[cls_name][-1] += 1


    # Pad lists to current frame count to ensure equal lengths
    pad_lists_to_length(distance_over_time, frame_count)
    pad_lists_to_length(speed_over_time, frame_count)


    # Draw combined visualizations on the frame
    combined_frame = draw_visualizations(frame, data, labels, speed_over_time, distance_over_time, class_counts_over_time, frame_count)


    # Write the frame with visualizations
    out.write(combined_frame)


    # Clear counts for next frame
    data = {}


    if cv2.waitKey(1) & 0xFF == ord("q"):
        break


# Generate and overlay scatter plot on the final frame
final_frame = np.zeros((h, w, 3), dtype=np.uint8)
scatter_plot = create_scatter_plot(class_counts_over_time)
scatter_plot_img = fig_to_img(scatter_plot)
final_frame = resize_and_place_image(final_frame, scatter_plot_img, (0, 0))


# Save the final frame with the scatter plot
cv2.imwrite("final_frame_with_scatter_plot.png", final_frame)


cap.release()
out.release()
cv2.destroyAllWindows()


# Print overall analytics
total_counts = sum(sum(counts) for counts in class_counts_over_time.values())
print(f"Overall total count: {total_counts}")
for cls, counts in class_counts_over_time.items():
    print(f"Total count for {cls}: {sum(counts)}")


best_speed = max((max(speeds) for speeds in speed_over_time.values()), default=0)
print(f"Overall best speed: {best_speed} m/s")
best_distance = max((max(distances) for distances in distance_over_time.values()), default=0)
print(f"Overall best distance: {best_distance} meters")
输出:
在我看来,这个模型对于识别物体非常出色,并且可以轻松地针对特定物体进行微调。即使对于那些不熟悉AI或深度学习的人来说,这个程序也非常容易使用且广泛应用。一个经常出现的重要问题是,为什么AI、深度学习和计算机视觉工程师热衷于开发这样的项目。原因是多方面的。这些项目为推动该领域的发展和解决现实问题提供了宝贵的机会。我已经建议每个人尽快完成这项任务。该领域的增长路径对于所有人都是相同的,但在物体识别和分割项目中仍需解决许多挑战。
这些挑战包括:
光线:光线条件的变化会显著影响物体检测的准确性。
环境:不同的背景和设置会使识别过程复杂化。
问题定义:识别和解决正确的问题对于这些项目的成功至关重要。
实地工作:在实际条件下的实施和测试是必不可少的,但管理起来可能很困难。

参考资料:
https://github.com/VK-Ant/Computervision_Exploration
https://docs.ultralytics.com/guides/analytics/
https://docs.ultralytics.com/models/yolov10/#holistic-efficiency-accuracy-driven-model-design
· END ·
🌟 想要变身计算机视觉小能手?快来「小白玩转Python」公众号!
回复“Python视觉实战项目”,解锁31个超有趣的视觉项目大礼包!🎁

本文仅供学习交流使用,如有侵权请联系作者删除


 1369
1369

 被折叠的 条评论
为什么被折叠?
被折叠的 条评论
为什么被折叠?
 到【灌水乐园】发言


