


legend 除了常用的文字参数外,还可以加 'location' 的参数,可以调整图例说明的位置~
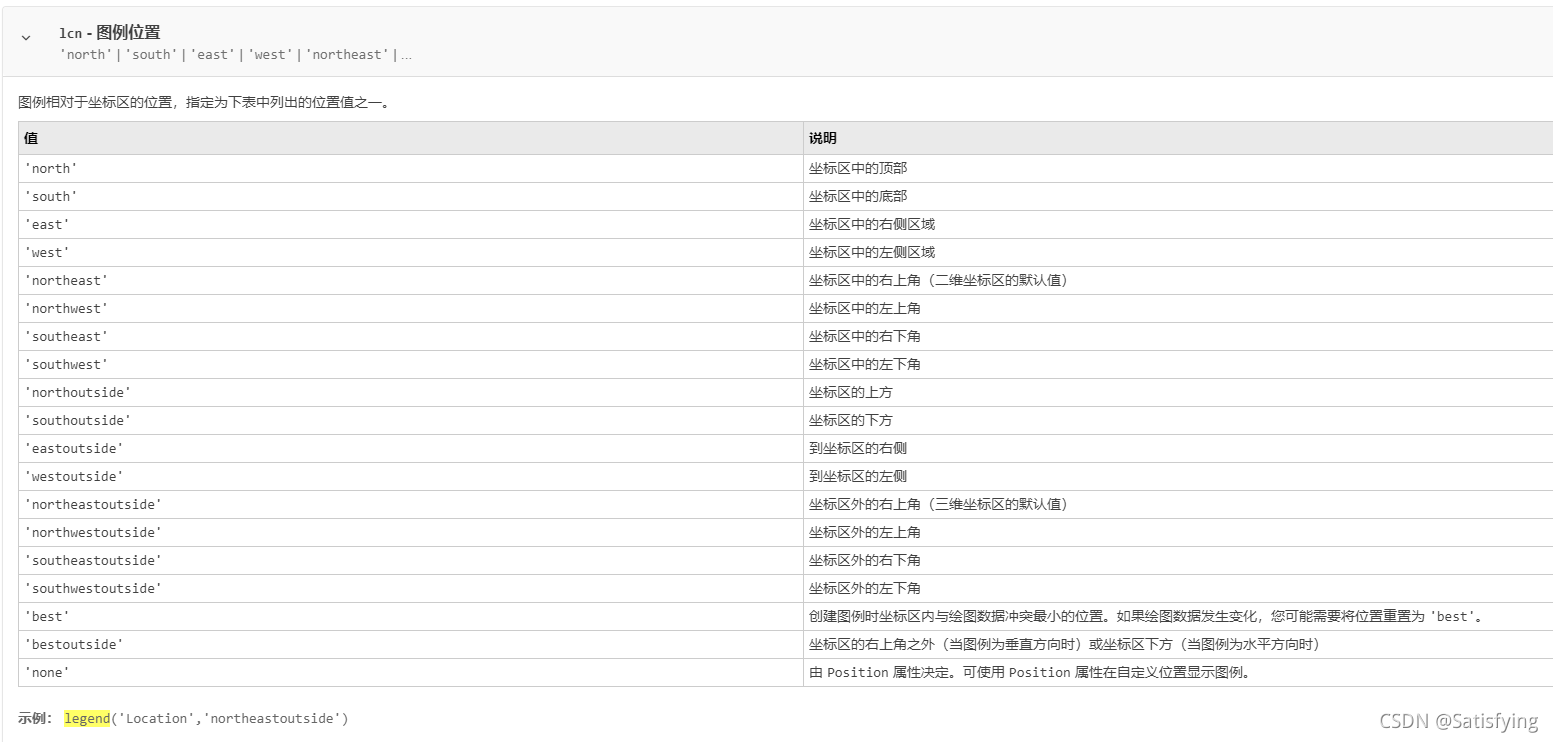
(图片来源:legend)
示例
fs = 1000;  % 采样频率
t = 0 : 1/fs : 1;  % 信号时间轴
f1 = 10;  % 信号频率
s = 10 * sin(2*pi*f1*t);  % 信号s

figure(1);
subplot(2, 2, 1);
plot(s, 'linewidth', 1.2); legend('s的曲线', 'location', 'north');
subplot(2, 2, 2);
plot(s, 'linewidth', 1.2); legend('s的曲线', 'location', 'west');
subplot(2, 2, 3);
plot(s, 'linewidth', 1.2); legend('s的曲线', 'location', 'east');
subplot(2, 2, 4);
plot(s, 'linewidth', 1.2); legend('s的曲线', 'location', 'south');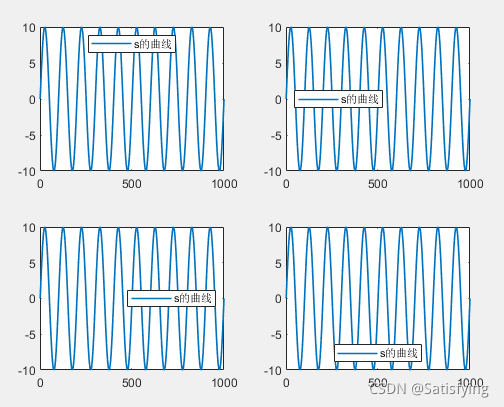
(参考: matlab 设置legend(比较全面))


 5297
5297

 被折叠的 条评论
为什么被折叠?
被折叠的 条评论
为什么被折叠?
 到【灌水乐园】发言


