


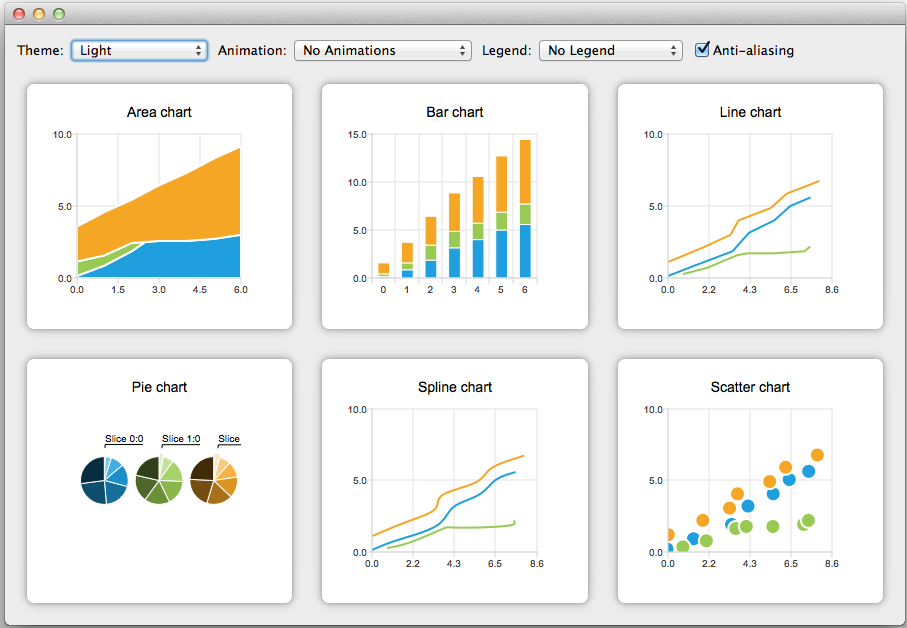
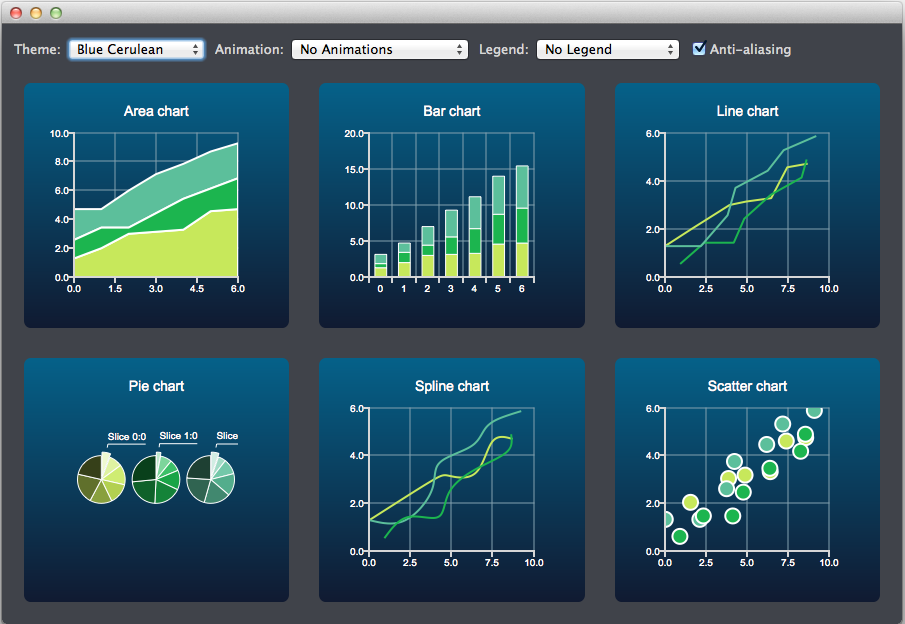
Chart themes 是 Qt Creator 中图表的主题,它可以用于改变图表的外观和风格,使其更符合你的需求和设计。此示例显示了所有支持的图表类型的不同内置主题的外观。为了给结果一个更和谐的外观,应用程序的背景调色板是根据所选主题定制的。

chartthemes/chartthemes.pro
QT += charts

HEADERS += \
    themewidget.h

SOURCES += \
    main.cpp \
    themewidget.cpp

target.path = $$[QT_INSTALL_EXAMPLES]/charts/chartthemes
INSTALLS += target
chartthemes/chartthemes.h
#ifndef THEMEWIDGET_H
#define THEMEWIDGET_H

#include <QtWidgets/QWidget>
#include <QtCharts/QChartGlobal>

QT_BEGIN_NAMESPACE
class QComboBox;
class QCheckBox;
QT_END_NAMESPACE

QT_CHARTS_BEGIN_NAMESPACE
class QChartView;
class QChart;
QT_CHARTS_END_NAMESPACE

typedef QPair<QPointF, QString> Data;
typedef QList<Data> DataList;
typedef QList<DataList> DataTable;

QT_CHARTS_USE_NAMESPACE

class ThemeWidget: public QWidget
{
    Q_OBJECT
public:
    explicit ThemeWidget(QWidget *parent = 0);
    ~ThemeWidget();

private Q_SLOTS:
    void updateUI();

private:
    DataTable generateRandomData(int listCount, int valueMax, int valueCount) const;
    QComboBox *createThemeBox() const;
    QComboBox *createAnimationBox() const;
    QComboBox *createLegendBox() const;
    void connectSignals();
    QChart *createAreaChart() const;
    QChart *createBarChart(int valueCount) const;
    QChart *createPieChart() const;
    QChart *createLineChart() const;
    QChart *createSplineChart() const;
    QChart *createScatterChart() const;

private:
    int m_listCount;
    int m_valueMax;
    int m_valueCount;
    QList<QChartView *> m_charts;
    DataTable m_dataTable;

    QComboBox *m_themeComboBox;
    QCheckBox *m_antialiasCheckBox;
    QComboBox *m_animatedComboBox;
    QComboBox *m_legendComboBox;
};

#endif /* THEMEWIDGET_H */
chartthemes/main.cpp
#include "themewidget.h"
#include <QtWidgets/QApplication>
#include <QtWidgets/QMainWindow>

int main(int argc, char *argv[])
{
    QApplication a(argc, argv);
    QMainWindow window;
    ThemeWidget *widget = new ThemeWidget();
    window.setCentralWidget(widget);
    window.resize(900, 600);
    window.show();
    return a.exec();
}
chartthemes/chartthemes.cpp
/****************************************************************************
**
** Copyright (C) 2016 The Qt Company Ltd.
** Contact: https://www.qt.io/licensing/
**
** This file is part of the Qt Charts module of the Qt Toolkit.
**
** $QT_BEGIN_LICENSE:GPL$
** Commercial License Usage
** Licensees holding valid commercial Qt licenses may use this file in
** accordance with the commercial license agreement provided with the
** Software or, alternatively, in accordance with the terms contained in
** a written agreement between you and The Qt Company. For licensing terms
** and conditions see https://www.qt.io/terms-conditions. For further
** information use the contact form at https://www.qt.io/contact-us.
**
** GNU General Public License Usage
** Alternatively, this file may be used under the terms of the GNU
** General Public License version 3 or (at your option) any later version
** approved by the KDE Free Qt Foundation. The licenses are as published by
** the Free Software Foundation and appearing in the file LICENSE.GPL3
** included in the packaging of this file. Please review the following
** information to ensure the GNU General Public License requirements will
** be met: https://www.gnu.org/licenses/gpl-3.0.html.
**
** $QT_END_LICENSE$
**
****************************************************************************/

#include "themewidget.h"

#include <QtCharts/QChartView>
#include <QtCharts/QPieSeries>
#include <QtCharts/QPieSlice>
#include <QtCharts/QAbstractBarSeries>
#include <QtCharts/QPercentBarSeries>
#include <QtCharts/QStackedBarSeries>
#include <QtCharts/QBarSeries>
#include <QtCharts/QBarSet>
#include <QtCharts/QLineSeries>
#include <QtCharts/QSplineSeries>
#include <QtCharts/QScatterSeries>
#include <QtCharts/QAreaSeries>
#include <QtCharts/QLegend>
#include <QtWidgets/QGridLayout>
#include <QtWidgets/QFormLayout>
#include <QtWidgets/QComboBox>
#include <QtWidgets/QSpinBox>
#include <QtWidgets/QCheckBox>
#include <QtWidgets/QGroupBox>
#include <QtWidgets/QLabel>
#include <QtCore/QTime>
#include <QtCharts/QBarCategoryAxis>

ThemeWidget::ThemeWidget(QWidget *parent) :
    QWidget(parent),
    m_listCount(3),
    m_valueMax(10),
    m_valueCount(7),
    m_dataTable(generateRandomData(m_listCount, m_valueMax, m_valueCount)),
    m_themeComboBox(createThemeBox()),
    m_antialiasCheckBox(new QCheckBox("Anti-aliasing")),
    m_animatedComboBox(createAnimationBox()),
    m_legendComboBox(createLegendBox())
{
    connectSignals();
    // create layout
    QGridLayout *baseLayout = new QGridLayout();
    QHBoxLayout *settingsLayout = new QHBoxLayout();
    settingsLayout->addWidget(new QLabel("Theme:"));
    settingsLayout->addWidget(m_themeComboBox);
    settingsLayout->addWidget(new QLabel("Animation:"));
    settingsLayout->addWidget(m_animatedComboBox);
    settingsLayout->addWidget(new QLabel("Legend:"));
    settingsLayout->addWidget(m_legendComboBox);
    settingsLayout->addWidget(m_antialiasCheckBox);
    settingsLayout->addStretch();
    baseLayout->addLayout(settingsLayout, 0, 0, 1, 3);

    //create charts

    QChartView *chartView;

    chartView = new QChartView(createAreaChart());
    baseLayout->addWidget(chartView, 1, 0);
    m_charts << chartView;

    chartView = new QChartView(createBarChart(m_valueCount));
    baseLayout->addWidget(chartView, 1, 1);
    m_charts << chartView;

    chartView = new QChartView(createLineChart());
    baseLayout->addWidget(chartView, 1, 2);
    m_charts << chartView;

    chartView = new QChartView(createPieChart());
    // Funny things happen if the pie slice labels do not fit the screen, so we ignore size policy
    chartView->setSizePolicy(QSizePolicy::Ignored, QSizePolicy::Ignored);
    baseLayout->addWidget(chartView, 2, 0);
    m_charts << chartView;

    chartView = new QChartView(createSplineChart());
    baseLayout->addWidget(chartView, 2, 1);
    m_charts << chartView;

    chartView =

            new QChartView(createScatterChart());
    baseLayout->addWidget(chartView, 2, 2);
    m_charts << chartView;

    setLayout(baseLayout);

    // Set defaults
    m_antialiasCheckBox->setChecked(true);
    updateUI();
}

ThemeWidget::~ThemeWidget()
{
}

void ThemeWidget::connectSignals()
{
    connect(m_themeComboBox,
            static_cast<void (QComboBox::*)(int)>(&QComboBox::currentIndexChanged),
            this, &ThemeWidget::updateUI);
    connect(m_antialiasCheckBox, &QCheckBox::toggled, this, &ThemeWidget::updateUI);
    connect(m_animatedComboBox,
            static_cast<void (QComboBox::*)(int)>(&QComboBox::currentIndexChanged),
            this, &ThemeWidget::updateUI);
    connect(m_legendComboBox,
            static_cast<void (QComboBox::*)(int)>(&QComboBox::currentIndexChanged),
            this, &ThemeWidget::updateUI);
}

DataTable ThemeWidget::generateRandomData(int listCount, int valueMax, int valueCount) const
{
    DataTable dataTable;

    // set seed for random stuff
    qsrand(QTime(0, 0, 0).secsTo(QTime::currentTime()));

    // generate random data
    for (int i(0); i < listCount; i++) {
        DataList dataList;
        qreal yValue(0);
        for (int j(0); j < valueCount; j++) {
            yValue = yValue + (qreal)(qrand() % valueMax) / (qreal) valueCount;
            QPointF value((j + (qreal) rand() / (qreal) RAND_MAX) * ((qreal) m_valueMax / (qreal) valueCount),
                          yValue);
            QString label = "Slice " + QString::number(i) + ":" + QString::number(j);
            dataList << Data(value, label);
        }
        dataTable << dataList;
    }

    return dataTable;
}

QComboBox *ThemeWidget::createThemeBox() const
{
    // settings layout
    QComboBox *themeComboBox = new QComboBox();
    themeComboBox->addItem("Light", QChart::ChartThemeLight);
    themeComboBox->addItem("Blue Cerulean", QChart::ChartThemeBlueCerulean);
    themeComboBox->addItem("Dark", QChart::ChartThemeDark);
    themeComboBox->addItem("Brown Sand", QChart::ChartThemeBrownSand);
    themeComboBox->addItem("Blue NCS", QChart::ChartThemeBlueNcs);
    themeComboBox->addItem("High Contrast", QChart::ChartThemeHighContrast);
    themeComboBox->addItem("Blue Icy", QChart::ChartThemeBlueIcy);
    themeComboBox->addItem("Qt", QChart::ChartThemeQt);
    return themeComboBox;
}

QComboBox *ThemeWidget::createAnimationBox() const
{
    // settings layout
    QComboBox *animationComboBox = new QComboBox();
    animationComboBox->addItem("No Animations", QChart::NoAnimation);
    animationComboBox->addItem("GridAxis Animations", QChart::GridAxisAnimations);
    animationComboBox->addItem("Series Animations", QChart::SeriesAnimations);
    animationComboBox->addItem("All Animations", QChart::AllAnimations);
    return animationComboBox;
}

QComboBox *ThemeWidget::createLegendBox() const
{
    QComboBox *legendComboBox = new QComboBox();
    legendComboBox->addItem("No Legend ", 0);
    legendComboBox->addItem("Legend Top", Qt::AlignTop);
    legendComboBox->addItem("Legend Bottom", Qt::AlignBottom);
    legendComboBox->addItem("Legend Left", Qt::AlignLeft);
    legendComboBox->addItem("Legend Right", Qt::AlignRight);
    return legendComboBox;
}

QChart *ThemeWidget::createAreaChart() const
{
    QChart *chart = new QChart();
    chart->setTitle("Area chart");

    // The lower series initialized to zero values
    QLineSeries *lowerSeries = 0;
    QString name("Series ");
    int nameIndex = 0;
    for (int i(0); i < m_dataTable.count(); i++) {
        QLineSeries *upperSeries = new QLineSeries(chart);
        for (int j(0); j < m_dataTable[i].count(); j++) {
            Data data = m_dataTable[i].at(j);
            if (lowerSeries) {
                const QVector<QPointF>& points = lowerSeries->pointsVector();
                upperSeries->append(QPointF(j, points[i].y() + data.first.y()));
            } else {
                upperSeries->append(QPointF(j, data.first.y()));
            }
        }
        QAreaSeries *area = new QAreaSeries(upperSeries, lowerSeries);
        area->setName(name + QString::number(nameIndex));
        nameIndex++;
        chart->addSeries(area);
        chart->createDefaultAxes();
        lowerSeries = upperSeries;
    }

    return chart;
}

QChart *ThemeWidget::createBarChart(int valueCount) const
{
    Q_UNUSED(valueCount);
    QChart *chart = new QChart();
    chart->setTitle("Bar chart");

    QStackedBarSeries *series = new QStackedBarSeries(chart);
    for (int i(0); i < m_dataTable.count(); i++) {
        QBarSet *set = new QBarSet("Bar set " + QString::number(i));
        for (const Data &data : m_dataTable[i])
            *set << data.first.y();
        series->append(set);
    }
    chart->addSeries(series);
    chart->createDefaultAxes();

    return chart;
}

QChart *ThemeWidget::createLineChart() const
{
    QChart *chart = new QChart();
    chart->setTitle("Line chart");

    QString name("Series ");
    int nameIndex = 0;
    for (const DataList &list : m_dataTable) {
        QLineSeries *series = new QLineSeries(chart);
        for (const Data &data : list)
            series->append(data.first);
        series->setName(name + QString::number(nameIndex));
        nameIndex++;
        chart->addSeries(series);
    }
    chart->createDefaultAxes();

    return chart;
}

QChart *ThemeWidget::createPieChart() const
{
    QChart *chart = new QChart();
    chart->setTitle("Pie chart");

    qreal pieSize = 1.0 / m_dataTable.count();
    for (int i = 0; i < m_dataTable.count(); i++) {
        QPieSeries *series = new QPieSeries(chart);
        for (const Data &data : m_dataTable[i]) {
            QPieSlice *slice = series->append(data.second, data.first.y());
            if (data == m_dataTable[i].first()) {
                slice->setLabelVisible();
                slice->setExploded();
            }
        }
        qreal hPos = (pieSize / 2) + (i / (qreal) m_dataTable.count());
        series->setPieSize(pieSize);
        series->setHorizontalPosition(hPos);
        series->setVerticalPosition(0.5);
        chart->addSeries(series);
    }

    return chart;
}

QChart *ThemeWidget::createSplineChart() const
{
    // spine chart
    QChart *chart = new QChart();
    chart->setTitle("Spline chart");
    QString name("Series ");
    int nameIndex = 0;
    for (const DataList &list : m_dataTable) {
        QSplineSeries *series = new QSplineSeries(chart);
        for (const Data &data : list)
            series->append(data.first);
        series->setName(name + QString::number(nameIndex));
        nameIndex++;
        chart->addSeries(series);
    }
    chart->createDefaultAxes();
    return chart;
}

QChart *ThemeWidget::createScatterChart() const
{
    // scatter chart
    QChart *chart = new QChart();
    chart->setTitle("Scatter chart");
    QString name("Series ");
    int nameIndex = 0;
    for (const DataList &list : m_dataTable) {
        QScatterSeries *series = new QScatterSeries(chart);
        for (const Data &data : list)
            series->append(data.first);
        series->setName(name + QString::number(nameIndex));
        nameIndex++;
        chart->addSeries(series);
    }
    chart->createDefaultAxes();
    return chart;
}

void ThemeWidget::updateUI()
{
    QChart::ChartTheme theme = static_cast<QChart::ChartTheme>(
                m_themeComboBox->itemData(m_themeComboBox->currentIndex()).toInt());

    const auto charts = m_charts;
    if (m_charts.at(0)->chart()->theme() != theme) {
        for (QChartView *chartView : charts)
            chartView->chart()->setTheme(theme);

        QPalette pal = window()->palette();
        if (theme == QChart::ChartThemeLight) {
            pal.setColor(QPalette::Window, QRgb(0xf0f0f0));
            pal.setColor(QPalette::WindowText, QRgb(0x404044));
        } else if (theme == QChart::ChartThemeDark) {
            pal.setColor(QPalette::Window, QRgb(0x121218));
            pal.setColor(QPalette::WindowText, QRgb(0xd6d6d6));
        } else if (theme == QChart::ChartThemeBlueCerulean) {
            pal.setColor(QPalette::Window, QRgb(0x40434a));
            pal.setColor(QPalette::WindowText, QRgb(0xd6d6d6));
        } else if (theme == QChart::ChartThemeBrownSand) {
            pal.setColor(QPalette::Window, QRgb(0x9e8965));
            pal.setColor(QPalette::WindowText, QRgb(0x404044));
        } else if (theme == QChart::ChartThemeBlueNcs) {
            pal.setColor(QPalette::Window, QRgb(0x018bba));
            pal.setColor(QPalette::WindowText, QRgb(0x404044));
        } else if (theme == QChart::ChartThemeHighContrast) {
            pal.setColor(QPalette::Window, QRgb(0xffab03));
            pal.setColor(QPalette::WindowText, QRgb(0x181818));
        } else if (theme == QChart::ChartThemeBlueIcy) {
            pal.setColor(QPalette::Window, QRgb(0xcee7f0));
            pal.setColor(QPalette::WindowText, QRgb(0x404044));
        } else {
            pal.setColor(QPalette::Window, QRgb(0xf0f0f0));
            pal.setColor(QPalette::WindowText, QRgb(0x404044));
        }
        window()->setPalette(pal);
    }

    bool checked = m_antialiasCheckBox->isChecked();
    for (QChartView *chart : charts)
        chart->setRenderHint(QPainter::Antialiasing, checked);

    QChart::AnimationOptions options(
                m_animatedComboBox->itemData(m_animatedComboBox->currentIndex()).toInt());
    if (m_charts.at(0)->chart()->animationOptions() != options) {
        for (QChartView *chartView : charts)
            chartView->chart()->setAnimationOptions(options);
    }

    Qt::Alignment alignment(m_legendComboBox->itemData(m_legendComboBox->currentIndex()).toInt());

    if (!alignment) {
        for (QChartView *chartView : charts)
            chartView->chart()->legend()->hide();
    } else {
        for (QChartView *chartView : charts) {
            chartView->chart()->legend()->setAlignment(alignment);
            chartView->chart()->legend()->show();
        }
    }
}


 1549
1549


 被折叠的 条评论
为什么被折叠?
被折叠的 条评论
为什么被折叠?
 到【灌水乐园】发言


