import matplotlib.pyplot as plt
from matplotlib.font_manager import FontProperties
%matplotlib inline
font = FontProperties(fname='D:\msyh.ttc')
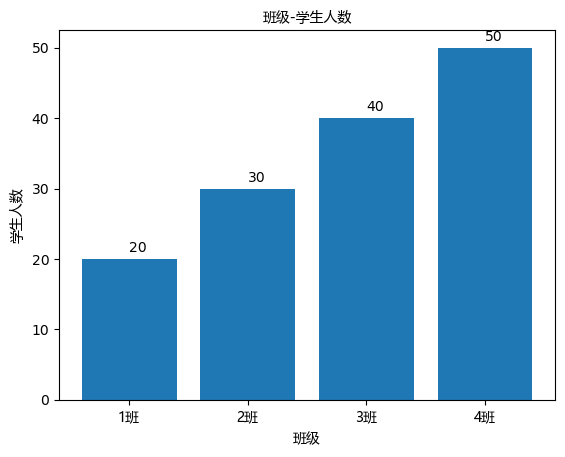
classes = ['1班','2班','3班','4班']
student_amounts = [20, 30, 40, 50]
class_index = range(len(classes))
print(class_index)
range(0, 4)
plt.bar(class_index,student_amounts)
plt.xticks(class_index,classes,fontproperties=font)
plt.xlabel('班级',fontproperties=font)
plt.title('班级-学生人数',fontproperties=font)
plt.ylabel('学生人数',fontproperties=font)
for ind,students_amount in enumerate(student_amounts):
print(ind,students_amount)
plt.text(ind,students_amount+1,students_amount)
plt.show()
0 20
1 30
2 40
3 50
import numpy as np
import matplotlib.pyplot as plt
from matplotlib.font_manager import FontProperties
%matplotlib inline
font = FontProperties(fname='D:\msyh.ttc')
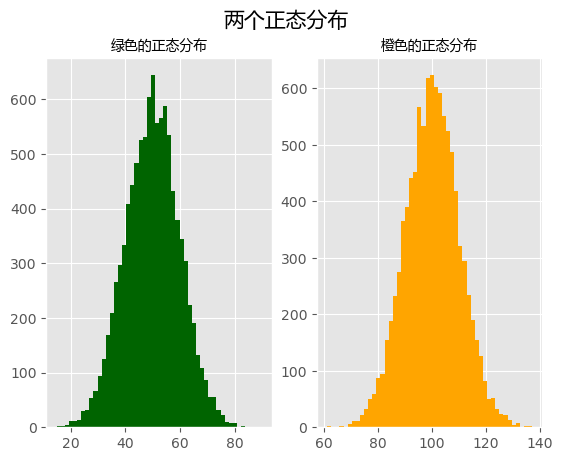
mu1, mu2, sigma = 50, 100, 10
x1 = mu1 + sigma * np.random.randn(10000)
print(x1)
x2 = mu2 + sigma * np.random.randn(10000)
print(x2)
[54.72160072 50.37226964 61.37019565 ... 35.7235959  53.01510425
 57.57637517]
[102.16850557 100.56996353  93.00436699 ... 109.18668621 105.86546668
 119.78452712]
fig = plt.figure()
plt.style.use('ggplot')
ax1 = fig.add_subplot(121)
ax1.hist(x1, bins=50, color='darkgreen')
ax2 = fig.add_subplot(122)
ax2.hist(x2, bins=50, color='orange')
fig.suptitle('两个正态分布', fontproperties=font, fontweight='bold', fontsize=15)
ax1.set_title('绿色的正态分布', fontproperties=font)
ax2.set_title('橙色的正态分布', fontproperties=font)
plt.show()
from numpy.random import randn
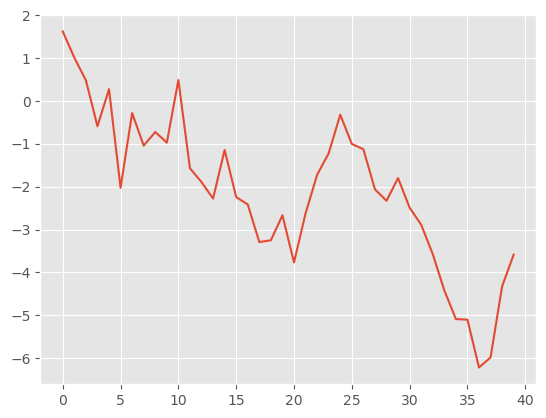
plt.style.use('ggplot')
np.random.seed(1)
plot_data1 = randn(40).cumsum()
print(plot_data1)
plt.plot(plot_data1)
plt.show()
[ 1.62434536  1.01258895  0.4844172  -0.58855142  0.2768562  -2.02468249
 -0.27987073 -1.04107763 -0.72203853 -0.97140891  0.49069903 -1.56944168
 -1.89185888 -2.27591324 -1.1421438  -2.24203506 -2.41446327 -3.29232169
 -3.25010794 -2.66729273 -3.76791191 -2.6231882  -1.72159748 -1.21910314
 -0.31824719 -1.00197505 -1.12486527 -2.06063471 -2.32852279 -1.79816732
 -2.48982807 -2.8865816  -3.5737543  -4.41895994 -5.09020607 -5.10287067
 -6.22018102 -5.98576532 -4.32596314 -3.58391898]
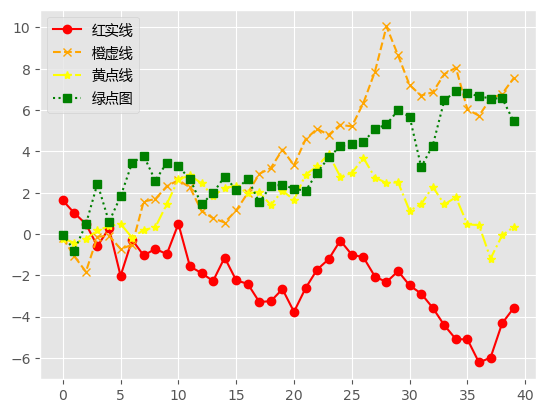
plot_data2 = randn(40).cumsum()
plot_data3 = randn(40).cumsum()
plot_data4 = randn(40).cumsum()
plt.plot(plot_data1, marker='o', color='red', linestyle='-', label='红实线')
plt.plot(plot_data2, marker='x', color='orange', linestyle='--', label='橙虚线')
plt.plot(plot_data3, marker='*', color='yellow', linestyle='-.', label='黄点线')
plt.plot(plot_data4, marker='s', color='green', linestyle=':', label='绿点图')
plt.legend(loc='best', prop=font)
plt.show()
实例
- https://www.cnblogs.com/nickchen121/p/10807571.html#%E4%BA%8C%E7%9B%B4%E6%96%B9%E5%9B%BE
import numpy as np
import pandas as pd
from numpy.random import randn
import matplotlib.pyplot as plt
from matplotlib.font_manager import FontProperties
%matplotlib inline
font = FontProperties(fname='D:\msyh.ttc')
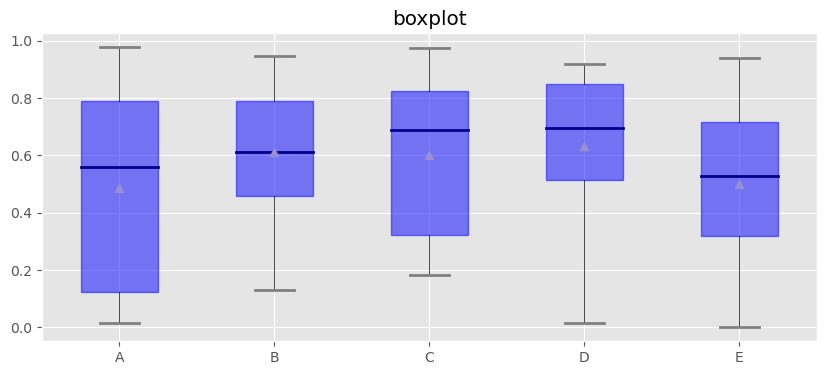
df = pd.DataFrame(np.random.rand(10, 5), columns=['A', 'B', 'C', 'D', 'E'])
plt.figure(figsize=(10, 4))
f = df.boxplot(
sym='o',
vert=True,
whis=1.5,
patch_artist=True,
meanline=False,
showmeans=True,
showbox=True,
showcaps=True,
showfliers=True,
notch=False,
return_type='dict'
)
plt.title('boxplot')
for box in f['boxes']:
box.set(color='b', linewidth=1)
box.set(facecolor='b', alpha=0.5)
for whisker in f['whiskers']:
whisker.set(color='k', linewidth=0.5, linestyle='-')
for cap in f['caps']:
cap.set(color='gray', linewidth=2)
for median in f['medians']:
median.set(color='DarkBlue', linewidth=2)
for flier in f['fliers']:
flier.set(marker='o', color='y', alpha=0.5)


 3万+
3万+

 被折叠的 条评论
为什么被折叠?
被折叠的 条评论
为什么被折叠?
 到【灌水乐园】发言


