


fs=500:15:590;
yall=[aa;dd];
bar(fs,yall);
xlabel('Fre(Hz)');
ylabel('loss(W)');
legend('FEM','Ana','Location','northwest');
saveas(gcf,'procompare.png')
aa和dd分别是两组柱状图的纵坐标数据。结果如下:

我觉得这个配色,好丑的。。。
顺道把配色改一下吧,这样来:
h1=bar(fs,u);
xlabel('Fre(Hz)')
ylabel('diff(W)')
color_matrix = [58/256,101/256,198/256
                56/256,200/256,145/256];
%color_matrix = [117/256,209/256,241/256  %颜色好看
                184/256,234/256,124/256];
set(h1(1),'facecolor',color_matrix(1,:))
set(h1(2),'facecolor',color_matrix(2,:))
legend('FEM','NEU','Location','northwest');
set(gca,'fontsize',15,'fontname','Times');  %设置坐标轴字体
saveas(gcf,'onloadcompare.png')
是不是看着顺眼多了,嘿嘿。
继续在这上面加内容吧,不得不说matlab自带的帮助文档就很nice.
画个简单的堆叠图,然后横坐标改成文字,不要数字。
X = categorical({'hairpin','round','litz'});
X = reordercats(X,{'hairpin','round','litz'});
aform=[6900 2500];
around=[2400 4800];
lize=[0 4500;];
re=[aform;around;lize];
h1=bar(X,re,'stacked');
color_matrix = [58/256,101/256,198/256
                56/256,200/256,145/256];
set(h1(1),'facecolor',color_matrix(1,:))
set(h1(2),'facecolor',color_matrix(2,:))
legend('AC loss','DC loss','Location','northeast');
saveas(gcf,'72loss.png')
顺便把双坐标的代码放在这里了
re=[14.18 28.78 32.712];
re1=re/14.18;
X = categorical({'2D','3D-0.4','3D-0.5'});
X = reordercats(X,{'2D','3D-0.4','3D-0.5'});
yyaxis left  %激活左坐标
bar(X,re,0.2);
ylabel('loss(W)');
hold on
yyaxis right  %激活右坐标
plot(re1,'*--','linewidth',2)
ylim([0,2.5]);
ylabel('normalization');
hold off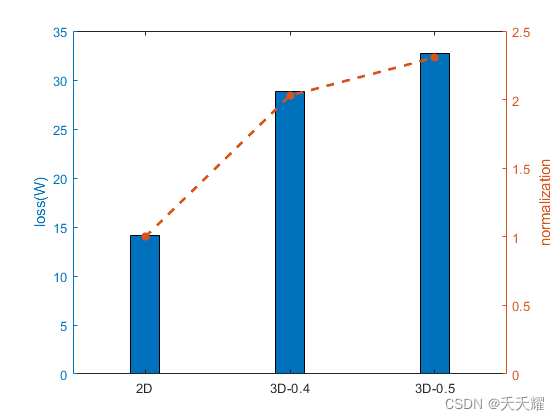
最后再把三维柱状图的代码补充一下:
zdraw=reshape(z,5,5);
zz=[1,2,3;4,5,6;7,8,9];
color_matrix = [255/255 187/255 0/255];
% h=bar3(y,z,0.5);
h=bar3(zdraw,0.3);
set(h,'facecolor',color_matrix);  %更改柱状图颜色
set(gca,'yticklabel',{'10','20','30','40','50'},'Fontname','Times New Roman','FontSize',11);
set(gca,'xticklabel',{'100','200','300','400','500'},'Fontname','Times New Roman','FontSize',11);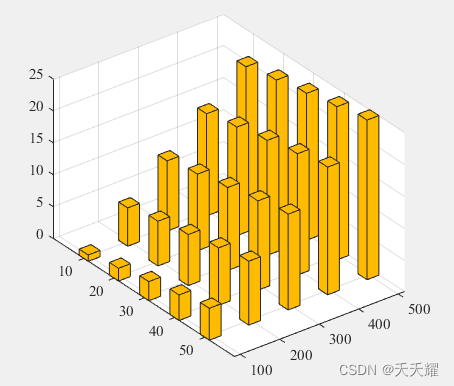


 4316
4316


 被折叠的 条评论
为什么被折叠?
被折叠的 条评论
为什么被折叠?
 到【灌水乐园】发言


