


 本文介绍了在项目中使用Echarts时遇到的五个常见问题,包括x轴数据展示调整、数据Zoom控制、视图更新、y轴刻度格式化和饼图内外显示百分比。提供了详细的解决方法和示例配置。
最近项目大量的曲线图,柱状图,饼图...总结一下使用过程中的小问题及解决方法 .
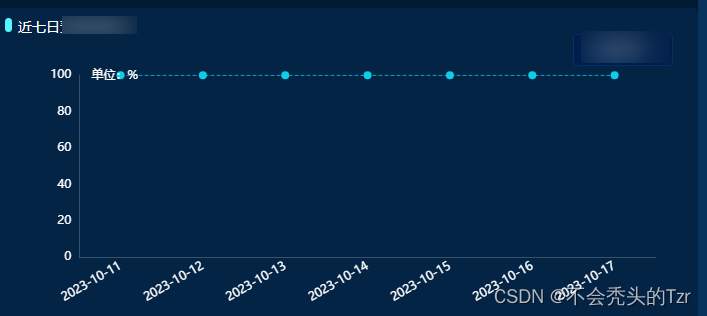
1.当x轴太拥挤,x轴数据不能全部展示怎么办?
这时候就只需要在xAxis的axisLabel对象中添加属性 interval : 0 就可以显示全部数据 , interval 属性是用来调整x轴数据的间距的 , 数值越大间距越大 .
xAxis: [
axisLabel: {
interval:0,
}
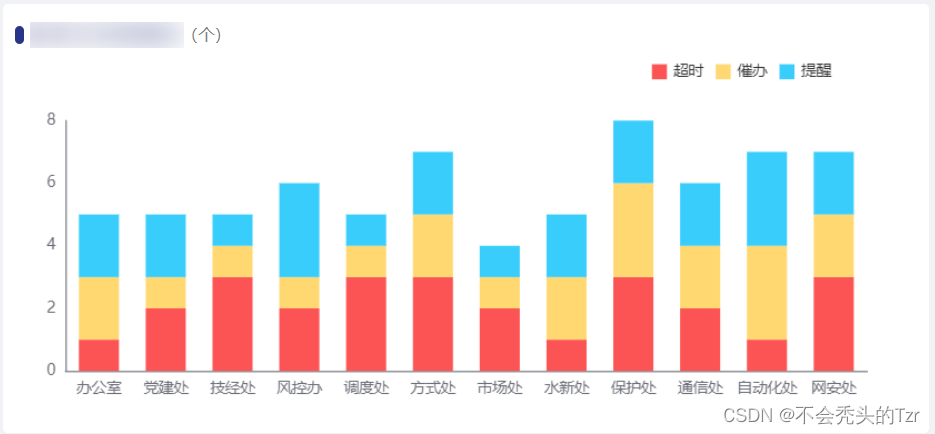
]2.当x轴数据太多,水平展示太过拥挤,可以选择垂直展示或者倾斜展示
xAxis的axisLabel对象中添加属性 rotate : 30 ,这里30是倾斜度数 , 垂直设置为90度即可
xAxis: [
          axisLabel: {
              rotate: 30,
          }
        ]
3.对echarts中的属性进行操作后,需要更新echarts图,怎么操作?
首先要确定,echarts 的 option 是否是操作后的最新数据,如果不是则需要对 option 进行检查,直到拿到最新数据再使用 this.$ref.mychart.setOption(this.option) 进行视图更新, 如果使用 this.$ref.mychart.setOption(this.option) 更新无效,则可以使用 this.$ref.mychart.setOption(this.option , true) 强制更新
 // 强制刷新页面,true
 this.$nextTick(() => {
     this.$refs.mychart.setOption(this.option, true)
  })
4.echarts缩放组件dataZoom , 当x轴数据太多数据不够展示
dataZoom: [
          {
            type: 'slider',
            show: true,
            xAxisIndex: [0],
            start: 1,
            end: 35,  //默认缩放组件宽度
            height: 15,
            bottom: 25,
            handleStyle: {
              color: '#e6e6e6'
            },
            borderColor: '#2E4258', // 组件边框的颜色
            fillerColor: '#2785D1', // 滑动的填充色
            backgroundColor: '#132E49', // 背景色
            showDataShadow: false, //屏蔽折线图,true为显示折线图
            showDetail: false, //关闭:拖拽时候显示详细数值信息
            moveHandleSize: 0 // 上方移动手柄的尺寸高度
          },
          {
            type: 'inside',
            xAxisIndex: [0],
            start: 1,
            end: 35  //默认缩放组件宽度
            // height:10,
          }
        ],
效果如下:

5.echarts数据y轴刻度默认显示千分制,如果不需要怎么办?

在 ECharts 中,要取消 Y 轴的千分位格式化,可以通过设置 axisLabel 的 formatter 属性为一个简单的字符串模板或者一个函数,该函数直接返回传入的值。
以下是一个简单的例子,展示如何取消 Y 轴的千分位格式化:
yAxis: {
        type: 'value',
        axisLabel: {
            // 使用函数作为 formatter,直接返回数值
            formatter: function(value) {
                return value;
            }
        }
    },
这样设置后,Y 轴的刻度就会以原始数值的形式显示,不再使用千分位分隔。

6.echarts饼图内部显示百分比,外部显示数据如何实现?
根据原型图 , 且既在饼图内部中 显示 百分比 , 又显示 外部指示线及数值 , 需求如图:

根据Echarts 官网文档,需要配置 series 下的 label 配置项如下:
series: [
	label: {
		normal: {
			position: 'inside' // 在内部显示,outseide 是在外部显示
			show: true,
			formatter: '{c}  // formatter 是标签内容的格式器,用于转换格式。支持 字符串和回调函数两种形式。
		}
	}

]
模板变量有 {a}、{b}、{c}、{d},分别表示系列名,数据名,数据值,百分比。{d}数据会根据value值计算百分比.
根据官网进行设置 ,代码如下:
 var xdata = [
        { value: 370, name: '设置时间不适用' },
        { value: 490, name: '内控审查不通过' },
        { value: 130, name: '修需改发布时间' },
        { value: 10, name: '内容缺失需补充' }
      ]
      this.bottomLeftOption = {
        tooltip: {
          trigger: 'item'
        },
        legend: {
          top: '30%',
          right: '8%',
          orient: 'vertical', //图例列表的布局朝向。
          itemGap: 30 //图例间距
        },
        series: [
          {
            type: 'pie',
            // 饼图颜色设置
            itemStyle: {
              normal: {
                color: function (colors) {
                  var colorList = ['#62daab', '#5b8ff9', '#efb91d', '#657798']
                  return colorList[colors.dataIndex]
                }
              }
            },
            radius: ['40%', '70%'],
            center: ['35%', '50%'], //饼图位置
            labelLine: {
              show: false
            },
            label: {
              normal: {
                show: true,
                position: 'inner', // 数值显示在内部
                formatter: '{d}%' // 百分数
              },
              textStyle: {
                align: 'center',
                fontWeight: 'bolder'
              }
            },
            data: xdata
          }
        ]
      }
这样的效果如下:

Echarts 没法直接配置成内部和外部同时展示的情况。因为在单个的 series 中(即其中的一个对象中),只能设置一个label。series 是一个数组,既然单个中只能出现一个,那么配置成 2个(多个)相同的对象,让他们重合,就会出现两个 label 标签,一个在内部展示,一个在外部展示,就可以解决这种情况。代码如下:
 var xdata = [
        { value: 370, name: '设置时间不适用' },
        { value: 490, name: '内控审查不通过' },
        { value: 130, name: '修需改发布时间' },
        { value: 10, name: '内容缺失需补充' }
      ]
      this.bottomLeftOption = {
        tooltip: {
          trigger: 'item'
        },
        legend: {
          top: '30%',
          right: '8%',
          orient: 'vertical', //图例列表的布局朝向。
          itemGap: 30 //图例间距
        },
        series: [
          {
            type: 'pie',
            // 饼图颜色设置
            itemStyle: {
              normal: {
                color: function (colors) {
                  var colorList = ['#62daab', '#5b8ff9', '#efb91d', '#657798']
                  return colorList[colors.dataIndex]
                }
              }
            },
            radius: ['40%', '70%'],
            center: ['35%', '50%'], //饼图位置
            labelLine: {
              show: false
            },
            label: {
              normal: {
                show: true,
                position: 'inner', // 数值显示在内部
                formatter: '{d}%' // 百分数
              },
              textStyle: {
                align: 'center',
                fontWeight: 'bolder'
              }
            },
            data: xdata
          },
          {
            type: 'pie',
            // 饼图颜色设置
            itemStyle: {
              normal: {
                color: function (colors) {
                  var colorList = ['#62daab', '#5b8ff9', '#efb91d', '#657798']
                  return colorList[colors.dataIndex]
                }
              }
            },
            radius: ['40%', '70%'],
            center: ['35%', '50%'], //饼图位置
            labelLine: {
              show: false
            },
            label: {
              normal: {
                show: true,
                position: 'outside',   //数值显示在饼图外部
                formatter: '{c}次'
              },
              textStyle: {
                align: 'center',
                fontWeight: 'bolder'
              }
            },
            data: xdata
          }
        ]
      }
效果如下:
 7.echarts数据y轴及x轴不显示刻度,且不显示网格线如何实现?

进行以下配置即可.
 yAxis: {
          type: 'value',
          splitLine: {
              show: false  //不显示网格线
            },
            axisLine: {
              show: true
            } //坐标轴是否显示
        },

 xAxis: {
          axisTick:{
            show:false   //不显示x轴的刻度线
          }
        }


 3198
3198


 被折叠的 条评论
为什么被折叠?
被折叠的 条评论
为什么被折叠?
 到【灌水乐园】发言


