


1.绘制脑电头皮图
在上一篇文章中导入脑电数据的基础上,我们在eeglab plot的界面选择:Edit->Channel locations选择配置通道位置文件。如果导入的数据为Neuroscan或BioSemi格式,则通道位置不需要配置,已经包含在数据集中。
调用通道编辑窗口时,如图下所示:

选择第二个模板,表示执行本地源,使用MNI坐标点击OK出现一下界面:

在这里我们导入事先准备好的通道文件,同时,点击Read locs help按钮可以查看这里支持的通道文件格式:
the file extension determines its type.

    '.loc' or '.locs' or '.eloc':
                polar coordinates. Notes: angles in degrees:
                right ear is 90; left ear -90; head disk radius is 0.5.
                Fields:   N    angle  radius    label
                Sample:   1    -18    .511       Fp1
                          2     18    .511       Fp2
                          3    -90    .256       C3
                          4     90    .256       C4
                            ...
                Note: In previous releases, channel labels had to contain exactly
                four characters (spaces replaced by '.'). This format still works,
                though dots are no longer required.
    '.sph':
                Matlab spherical coordinates. Notes: theta is the azimuthal/horizontal angle
                in deg.: 0 is toward nose, 90 rotated to left ear. Following this, performs
                the elevation (phi). Angles in degrees.
                Fields:   N    theta    phi    label
                Sample:   1      18     -2      Fp1
                          2     -18     -2      Fp2
                          3      90     44      C3
                          4     -90     44      C4
                            ...
    '.elc':
                Cartesian 3-D electrode coordinates scanned using the EETrak software.
                See readeetraklocs().
    '.elp':
                Polhemus-.'elp' Cartesian coordinates. By default, an .elp extension is read
                as PolhemusX-elp in which 'X' on the Polhemus sensor is pointed toward the
                subject. Polhemus files are not in columnar format (see readelp()).
    '.elp':
                BESA-'.elp' spherical coordinates: Need to specify 'filetype','besa'.
                The elevation angle (phi) is measured from the vertical axis. Positive
                rotation is toward right ear. Next, perform azimuthal/horizontal rotation
                (theta): 0 is toward right ear; 90 is toward nose, -90 toward occiput.
                Angles are in degrees.  If labels are absent or weights are given in
                a last column, readlocs() adjusts for this. Default labels are E1, E2, ...
                Fields:   Type  label      phi  theta
                Sample:   EEG   Fp1        -92   -72
                          EEG   Fp2         92    72
                          EEG   C3         -46    0
                          EEG   C4          46    0
                            ...
    '.xyz':
                Matlab/EEGLAB Cartesian coordinates. Here. x is towards the nose,
                y is towards the left ear, and z towards the vertex. Note that the first
                column (x) is -Y in a Matlab 3-D plot, the second column (y) is X in a
                matlab 3-D plot, and the third column (z) is Z.
                Fields:   channum   x           y         z     label
                Sample:   1       .950        .308     -.035     Fp1
                          2       .950       -.308     -.035     Fp2
                          3        0           .719      .695    C3
                          4        0          -.719      .695    C4
                            ...
    '.asc', '.dat':
                Neuroscan-.'asc' or '.dat' Cartesian polar coordinates text file.
    '.mat':
                Brainstrom channel location file.
    '.sfp':
                BESA/EGI-xyz Cartesian coordinates. Notes: For EGI, x is toward right ear,
                y is toward the nose, z is toward the vertex. EEGLAB converts EGI
                Cartesian coordinates to Matlab/EEGLAB xyz coordinates.
                Fields:   label   x           y          z
                Sample:   Fp1    -.308        .950      -.035
                          Fp2     .308        .950      -.035
                          C3     -.719        0          .695
                          C4      .719        0          .695
                            ...
    '.ced':
                ASCII file saved by pop_chanedit(). Contains multiple MATLAB/EEGLAB formats.
                Cartesian coordinates are as in the 'xyz' format (above).
                Fields:   channum  label  theta  radius   x      y      z    sph_theta   sph_phi  ...
                Sample:   1        Fp1     -18    .511   .950   .308  -.035   18         -2       ...
                          2        Fp2      18    .511   .950  -.308  -.035  -18         -2       ...
                          3        C3      -90    .256   0      .719   .695   90         44       ...
                          4        C4       90    .256   0     -.719   .695  -90         44       ...
                            ...
                The last columns of the file may contain any other defined fields (gain,
                calib, type, custom).
点击“Read locations”按钮,选择sample_data文件中“eeglab_chan32.locs”,加载通道文件。在下一个弹窗中如果不指定文件格式,将自动按文件扩展名来评估其格式:

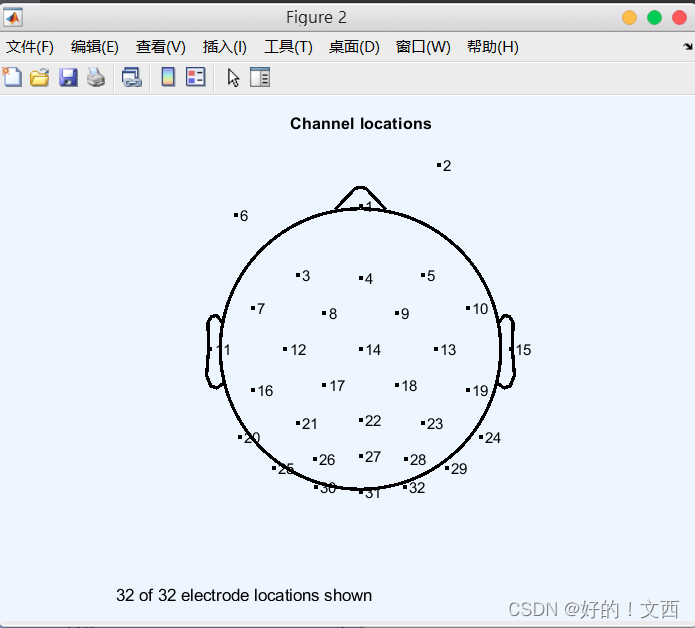
点击OK,在下面界面中通道坐标和极坐标都显示出来,其中绘制在头部外部的电极是位于头部中线以下的电极,点击OK再选择Plot->Channel location->By name将头皮电极图可视化,显示电极名称,或者选择Plot->Channel location->By number显示通道名称。

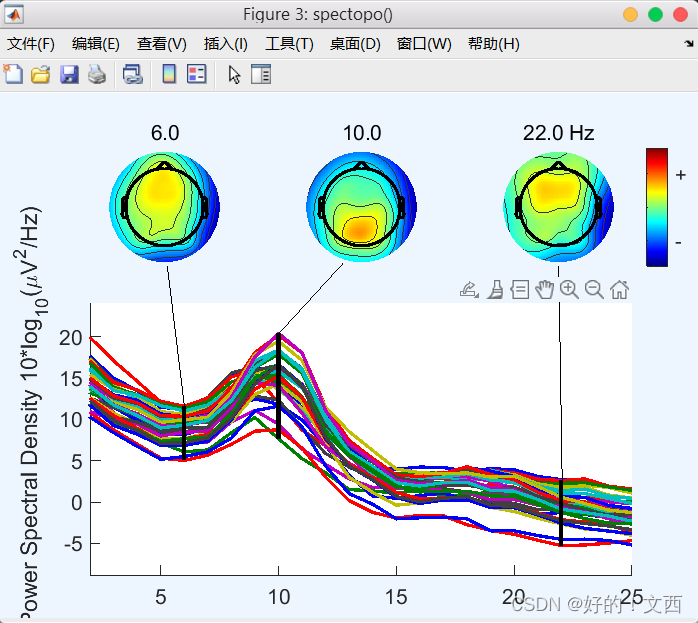
2.绘制通道对应光谱图
在eeglab界面选择Plot->Channel spectra and maps得到下面界面:

在Percent data to sample输入框内更改采样率为15,即展示当采样为15%数据时得到的结果,也可以默认设置为100,得到结果分别如下图:


这里填写通道10,点击OK出现如下界面:
其中红点为所选通道在头皮上的位置,右上角的图表示其活动范围及其活动在单个时期的ERP图像


 1万+
1万+

 被折叠的 条评论
为什么被折叠?
被折叠的 条评论
为什么被折叠?
 到【灌水乐园】发言


