


1.图像数据与颜色图的关系
在使用 image 函数显示图像时,可以控制像素范围值与颜色图范围的映射关系。例如,此处的 5×5 幻方显示为一个使用默认颜色图的图像。
A = magic(5)A =
17 24 1 8 15
23 5 7 14 16
4 6 13 20 22
10 12 19 21 3
11 18 25 2 9
im = image(A);
axis off
colorbar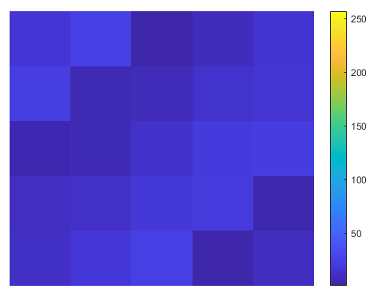
A 包含介于 1 和 25 之间的值。MATLAB® 将这些值视为指向颜色图(包含 64 个条目)的索引。因此,先前图像中的所有像素映射到该颜色图中的前 25 个条目(大致为颜色栏中的蓝色区域)。
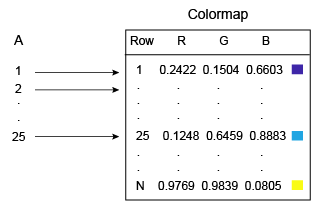
您可以通过 Image 对象的 CDataMapping 属性控制此映射。先前的图中所示的默认行为对应于此属性的 'direct' 选项。在显示包含自带颜色图的图像(例如 GIF 图像)时,直接映射很有用。但是,如果图像表示某些物理单位(例如米或度)的测量值,则可将 CDataMapping 属性设置为 'scaled'。缩放映射使用完整的颜色范围,它允许您以可视化方式显示数据中的相对差异。
im.CDataMapping = 'scaled';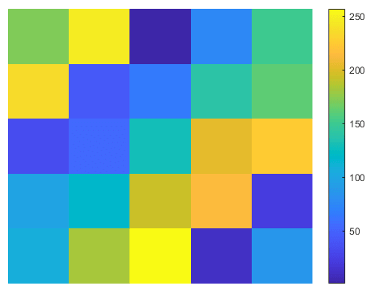
'scaled' 选项可将 A 的最小值映射到颜色图中的第一个条目,将 A 的最大值映射到颜色图中的最后一个条目。A 的所有中间值线性缩放映射至颜色图。
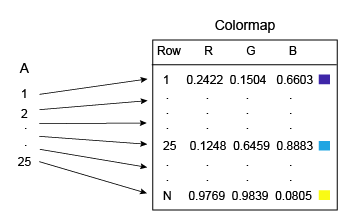
作为设置 CDataMapping 属性为 'scaled' 的一个替代方法,您还可以调用 imagesc 函数以达到相同效果。
imagesc(A)
axis off
colorbar
如果更改颜色图,A 中的值会缩放映射至新颜色图。
colormap(gray)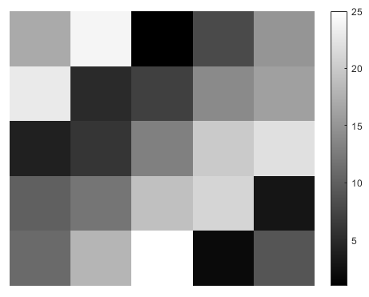
缩放映射也适用于显示不含颜色图的绘画图像,或者您想更改绘画图像的颜色图的情形。以下命令使用 gray 颜色图显示图像,此颜色图不同于此图像中存储的原始颜色图。
load clown
image(X,'CDataMapping','scaled')
colormap(gray)
axis off
colorbar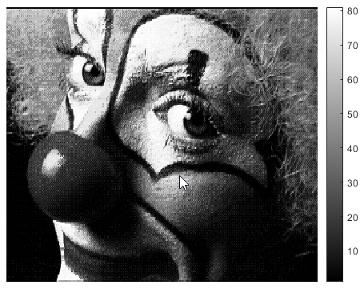
2.补片数据与颜色图的关系
在创建使用 Patch 对象的图形时,可以通过调用 colormap 函数来控制总体颜色方案。您也可以通过以下方式控制颜色图与补片之间的关系:
-
为面分配特定颜色
-
为各个面周围的顶点分配特定颜色
您控制这些关系的方式取决于您指定补片的方式:是指定为 x、y、z 坐标,还是指定为面-顶点数据。
2.1颜色图与 x、y、z 坐标数组的关系
如果您使用 x、y、z 坐标数组创建 Patch 对象,Patch 对象的 CData 属性将包含索引数组 C。此数组控制颜色图与补片之间的关系。要为面分配颜色,应将 C 指定为具有以下特征的数组:
-
C为 n×1 数组,其中 n 为面数。 -
C(i)处的值控制面i的颜色。
下面的示例演示了 C 及其与颜色图和三个面的关系。C(i) 的值控制顶点 (X(i,:), Y(i,:)) 定义的面的颜色。
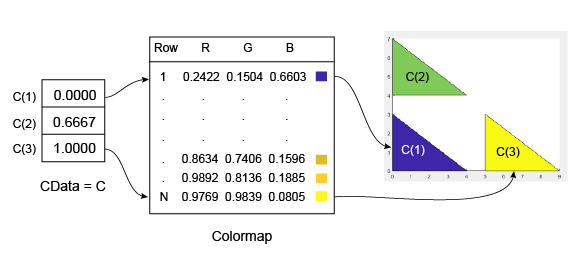
C 的最小值为 0。它映射到颜色图中的第一行。C 的最大值为 1,它映射到颜色图中的最后一行。C 的中间值线性映射到颜色图的中间行。在本例中,C(2) 映射到距离颜色图起始点约三分之二处的颜色。此代码将创建先前图示中所描述的 Patch 对象。
X = [0 0 5; 0 0 5; 4 4 9];
Y = [0 4 0; 3 7 3; 0 4 0];
C = [0; .6667; 1];
p = patch(X,Y,C);
colorbar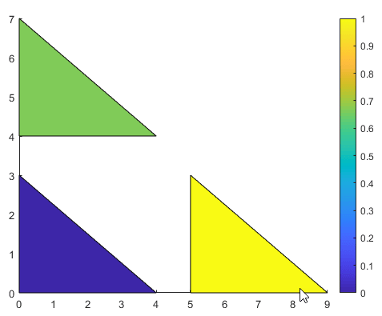
要为顶点分配颜色,应将 C 指定为具有以下特征的数组:
-
C为 m×n 数组,其中 m 为每个面的顶点数,n 为面数。 -
C(i,j)处的值控制面j的顶点i处的颜色。
下面的示例演示了 C 及其与颜色图和六个顶点之间的关系。C(i,j) 的值控制 (X(i,j), Y(i,j)) 处的顶点的颜色。
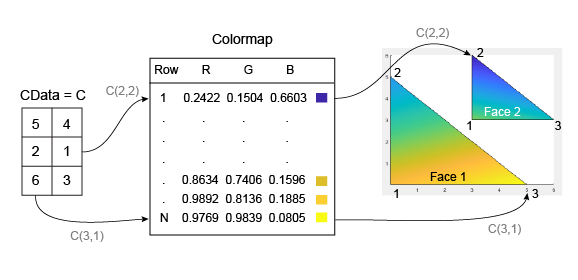
与补片面一样,MATLAB® 可将 C 中的值缩放映射到颜色图中的行数。在本例中,最小值为 C(2,2)=1,它映射到颜色图中的第一行。最大值为 C(3,1)=6,它映射到颜色图中的最后一行。
此代码将创建先前图示中所描述的 Patch 对象。FaceColor 属性设置为 'interp',以使顶点颜色在各个面之间混合。
clf
X = [0 3; 0 3; 5 6];
Y = [0 3; 5 6; 0 3];
C = [5 4; 2 0; 6 3];
p = patch(X,Y,C,'FaceColor','interp');
colorbar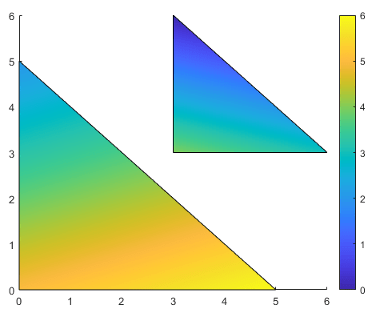
2.2颜色图与面-顶点数据的关系
如果是使用面-顶点数据创建补片,Patch 对象的 FaceVertexCData 属性将包含索引数组 C。此数组控制颜色图与补片之间的关系。
要为面分配颜色,应将 C 指定为具有以下特征的数组:
-
C为 n×1 数组,其中 n 为面数。 -
C(i)处的值控制面i的颜色。
下面的示例演示了 C 及其与颜色图和三个面的关系。
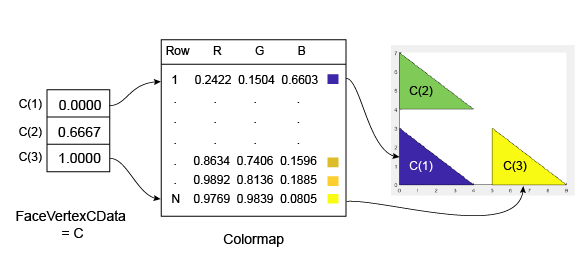
C 的最小值为 0,它映射到颜色图中的第一行。C 的最大值为 1,它映射到颜色图中的最后一个值。C 的中间值线性映射到颜色图的中间行。在本例中,C(2) 映射到距离颜色图底部约三分之二处的颜色。
此代码将创建先前图示中所描述的 Patch 对象。FaceColor 属性设置为 'flat',以显示颜色图的颜色而不显示默认颜色(黑色)。
clf
vertices = [0 0; 0 3; 4 0; 0 4; 0 7; 4 4; 5 0; 5 3; 9 0];
faces = [1 2 3; 4 5 6; 7 8 9];
C = [0; 0.6667; 1];
p = patch('Faces',faces,'Vertices',vertices,'FaceVertexCData',C);
p.FaceColor = 'flat';
colorbar
要为顶点分配颜色,应将 Patch 对象的 FaceVertexCData 属性指定为具有以下特征的数组 C:
-
C为 n×1 数组,其中 n 为顶点数。 -
C(i)处的值控制顶点i的颜色。
下面的示例演示了 C 及其与颜色图和六个顶点之间的关系。
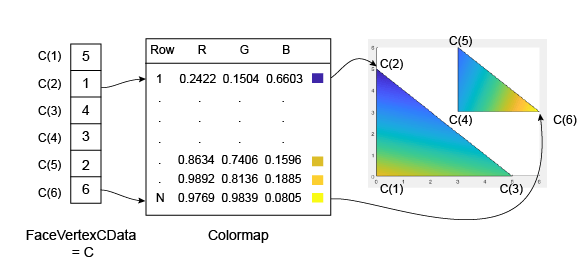
与补片面一样,MATLAB 可将 C 中的值缩放映射到颜色图中的行数。在本例中,最小值为 C(2)=1,它映射到颜色图中的第一行。最大值为 C(6)=6,它映射到颜色图中的最后一行。
此代码将创建先前图示中所描述的 Patch 对象。FaceColor 属性设置为 'interp',以使顶点颜色在各个面之间混合。
clf
vertices = [0 0; 0 5; 5 0; 3 3; 3 6; 6 3];
faces = [1 2 3; 4 5 6];
C = [5; 1; 4; 3; 2; 6];
p = patch('Faces',faces,'Vertices',vertices,'FaceVertexCData',C);
p.FaceColor = 'interp';
colorbar


 165
165

 被折叠的 条评论
为什么被折叠?
被折叠的 条评论
为什么被折叠?
 到【灌水乐园】发言


