


数据预处理
import torchvision.transforms as transforms

transform_train = transforms.Compose([
        transforms.RandomResizedCrop(size=32, scale=(0.2,1.)),
        transforms.RandomHorizontalFlip(),
        transforms.Resize(32),
        transforms.CenterCrop(32),
        transforms.ToTensor(),
        transforms.Normalize(mean=mean, std=std),
    ])
欧式距离:
def euclidean_dist(x, y):
    """
    Args:
      x: pytorch Variable, with shape [m, d]
      y: pytorch Variable, with shape [n, d]
    Returns:
      dist: pytorch Variable, with shape [m, n]
    """
    m, n = x.size(0), y.size(0)
    xx = torch.pow(x, 2).sum(1, keepdim=True).expand(m, n)
    yy = torch.pow(y, 2).sum(1, keepdim=True).expand(n, m).t()
    dist = xx + yy
    dist.addmm_(1, -2, x, y.t())
    dist = dist.clamp(min=1e-12).sqrt()  # for numerical stability
    return dist
矩阵计算
#三维tensor 矩阵相乘
#a: N*h*w;
#b: N*w*h
result = torch.bmm(a, b) # N*h*h

#二维矩阵相乘
#f: 8*512
#k: 12936*512
results = torch.matmul(f, k.transpose(0,1))#8*12936
数据转换
#list中的数据变成一个矩阵
list = []
list.append(feat)
feature = torch.stack(list)

#矩阵拼接
#按列串联
feature = torch.cat((feat1, feat1), dim=1)
python绘制动态直方图
import matplotlib.pyplot as plt
if epoch%10==0:
    fig, ax = plt.subplots()
    x = []
    y1 = []
    for i in range(num_cluster):
        #num = (np.sum(pseudo_labels == i))
        num = 2*i
        x.append(i)
        y1.append(num)
        ax.cla()
        ax.bar(x, color='b', height=y1, width=1)
        plt.xlabel('Cluster', color='b')
        plt.ylabel('Number', color='b')
        ax.legend()
        plt.pause(0.01)
Onehot:
def onehot(size, target):
    vec = torch.zeros(size, dtype=torch.float32)
    vec[target] = 1.
    return vec
绘制训练过程的Curve (University1652-Baseline-master)
x_epoch = []
fig = plt.figure()
ax0 = fig.add_subplot(121, title="loss")
ax1 = fig.add_subplot(122, title="top1err")
def draw_curve(current_epoch):
    x_epoch.append(current_epoch)
    ax0.plot(x_epoch, y_loss['train'], 'bo-', label='train')
    ax0.plot(x_epoch, y_loss['val'], 'ro-', label='val')
    ax1.plot(x_epoch, y_err['train'], 'bo-', label='train')
    ax1.plot(x_epoch, y_err['val'], 'ro-', label='val')
    if current_epoch == 0:
        ax0.legend()
        ax1.legend()
    fig.savefig( os.path.join('./model',name,'train.jpg'))
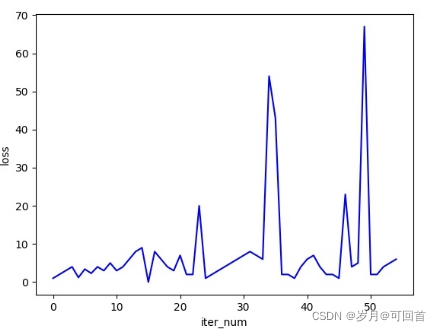
画折线图
import matplotlib.pyplot as plt
train_loss = [1,2,3,4,1.2,3.4,2.3,4,3,5,3,4,6,8,9,0,8,6,4,3,7,2,2,20,1,2,3,4,5,6,7,8,7,6,54,43,2,2,1,4,6,7,4,2,2,1,23,4,5,67,2,2,4,5,6]
plt.switch_backend('Agg')
plt.figure()
plt.plot(train_loss, 'b', label='loss')
plt.ylabel('loss')
plt.xlabel('iter_num')
plt.legend()
plt.savefig("2_train_loss_adv.jpg")
将一幅图像裁剪为小块
import cv2
img = cv2.imread('/home/stz/Downloads/0001.jpg')
m = int(img.shape[0] / 2)
n = int(img.shape[1] / 2)
for i in range(2):
    for j in range(2):
        filepath= '/home/stz/Downloads/' + str(i) + str(j) + '.jpg'
        im=img[i*m:(i+1)*m, j*n:(j+1)*n, :]
        cv2.imwrite(filepath, im)


 2万+
2万+


 被折叠的 条评论
为什么被折叠?
被折叠的 条评论
为什么被折叠?
 到【灌水乐园】发言


