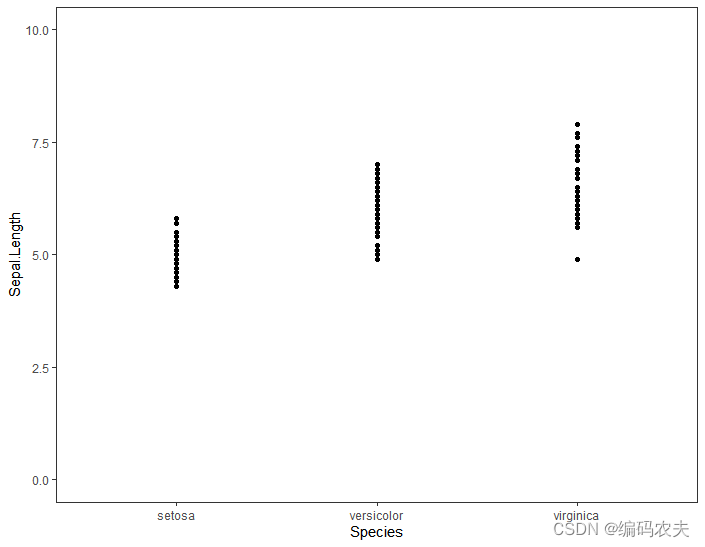
点图
library(tidyverse)

theme_set(theme_test())
iris%>%
  ggplot(aes(x=Species,y=Sepal.Length),fill = "red",color="white")+
  geom_point(color="black",fill="white")+
  ylim(0,10)+
  labs(y="Sepal.Length")
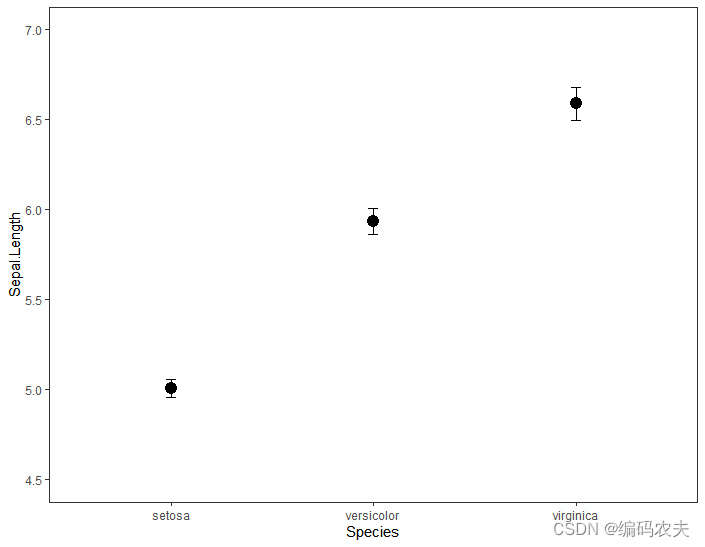
误差线点图
library(tidyverse)

theme_set(theme_test())
library(sciplot)
iris%>%group_by(Species)%>%summarise(mean=mean(Sepal.Length),se=se(Sepal.Length))%>%
  ggplot(aes(x=Species,y=mean),fill = "red",color="white")+
  geom_point(color="black",size=4)+
  geom_errorbar(aes(ymin=mean-se,ymax=mean+se),width=0.05)+
  ylim(4.5,7)+
  labs(y="Sepal.Length")


 726
726


 被折叠的 条评论
为什么被折叠?
被折叠的 条评论
为什么被折叠?
 到【灌水乐园】发言


