library(tidyverse)

theme_set(theme_test())
library(vegan)
pca.data <- iris %>% mutate(Sepal.Length = scale(Sepal.Length),
                            Sepal.Width = scale(Sepal.Width),
                            Petal.Length = scale(Petal.Length),
                            Petal.Width = scale(Petal.Width))
pca <- rda(pca.data[,1:4])
pca.summary <- summary(pca)
pca.result <- as.data.frame(pca.summary$sites) %>% select(-PC3,-PC4) %>% mutate(Species = iris$Species)
pca.arrow <- as.data.frame(pca.summary$species) %>% select(-PC3,-PC4)

library(tidyverse)
pca.result%>%ggplot()+
  geom_point(aes(x = PC1,y = PC2,fill = Species),shape = 21,size = 4)+
  stat_ellipse(aes(x = PC1,y = PC2,color = Species,fill = Species),
               geom ="polygon",level = 0.95,size = 0.5,alpha = 0.2)+
  geom_segment(data = pca.arrow,aes(x = 0,xend = PC1,y = 0,yend = PC2),
               arrow = arrow(length = unit(0.35,"cm")))
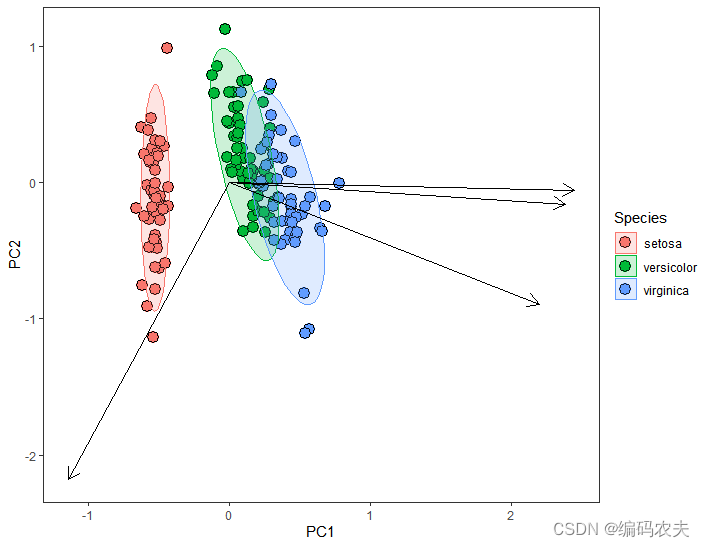


 该博客展示了如何利用R语言的tidyverse和vegan库进行主成分分析(PCA)。首先,通过scale函数标准化鸢尾花数据集的测量值,然后执行PCA并生成摘要。接着,将结果转换为数据框并绘制PCA结果,包括点的分布、椭圆(95%置信水平)和箭头表示的变量方向。此分析有助于数据的降维和可视化。


 1473
1473

 被折叠的 条评论
为什么被折叠?
被折叠的 条评论
为什么被折叠?
 到【灌水乐园】发言


