


👨🎓个人主页:研学社的博客
💥💥💞💞欢迎来到本博客❤️❤️💥💥
🏆博主优势:🌞🌞🌞博客内容尽量做到思维缜密,逻辑清晰,为了方便读者。
⛳️座右铭:行百里者,半于九十。
📋📋📋本文目录如下:🎁🎁🎁
目录

💥1 概述
计算 1D 或 3D 数据集的月均值、年中位数和其他统计数据(Matlab代码实现)
📚2 运行结果
部分代码:
%% |downsample_ts| documentation
% This function downsamples 1D or 3D data to monthly, yearly, hourly,
% minutely, or secondly data. This function was originally designed to
% create monthly mean time series from daily geospatial climate data.
%
%% Syntax
%
% Z_downsamp = downsample_ts(Z,t)
% Z_downsamp = downsample_ts(...,'DownsamplingPeriod')
% Z_downsamp = downsample_ts(...,'function')
% [Z_downsamp,t_downsamp] = downsample_ts(...)
%
%% Description
%
% |Z_downsamp = downsample_ts(Z,t)| downsamples |Z|, which must be
% provided with a corresponding time vector |t|. |Z| can be 1D if its
% length matches the length of |t|. If |Z| is three-dimensional, the
% length of its third dimension must match the length of |t|. For geospatial
% climate data arrays, dimensions of |Z| might correspond to lat x lon x time or
% lon x lat x time.
%
% |Z_downsamp = downsample_ts(...,'DownsamplingPeriod')| specifies a
% downsampling period as
%
% * |'year'|
% * |'month'| (default)
% * |'day'|
% * |'hour'|
% * |'minute'|
% * |'second'|
%
% |Z_downsamp = downsample_ts(...,'function')| specifies a function to
% perform on the data. By default, monthly averages are taken, but you may
% wish to return the monthly median or monthly standard deviation or any of
% the functions listed below.
%
% A note on functions which ignore NaNs: To get the monthly means of data
% while ignoring |NaN| values, you can use the |'nanmean'| option. The
% |nanmean| function is part of the Statistics Toolbox, but may also be
% found as part of the <http://www.mathworks.com/matlabcentral/fileexchange/6837
% NaN Suite on File Exchange>. However, the File Exchange versions mix up the order
% of dimensions and flags for |nanstd|, |nanvar|, |nanmin|, and |nanmax|, so you will
% need the Statistics Toolbox for those particular functions. In all, the
% following functions are available:
%
% * |'mean'| (default)
% * |'nanmean'| ignores |NaN| values in |Z|. Requires Statistics toolbox or NaN Suite.
% * |'median'|
% * |'nanmedian'| ignores |NaN| values in |Z|. Requires Statistics toolbox or NaN Suite.
% * |'min'|
% * |'nanmin'| ignores |NaN| values in |Z|. Requires Statistics toolbox.
% * |'max'|
% * |'nanmax'| ignores |NaN| values in |Z|. Requires Statistics toolbox.
% * |'std'| standard deviation.
% * |'nanstd'| ignores |NaN| values in |Z|. Requires Statistics toolbox.
% * |'var'| variance.
% * |'nanvar'| ignores |NaN| values in |Z|. Requires Statistics toolbox.
% * |'mode'|
% * |'sum'|
% * |'nansum'|. Requires Statistics Toolbox or NaN Suite.
%
% |[Z_downsamp,t_downsamp] = downsample_ts(...)| also returns a time array
% corresponding to |Z_downsamp|. If |Z| is 3D or, |t_downsamp| corresponds
% to the third dimension of |Z_downsamp|. Each value in |t_downsamp|
% represents the mean time of all data contributing to that slice of
% |Z_downsamp|.
%
%% Example 1: A 1D time series
% First load the sample data included in this File Exchange submission:
load downsample_ts_exampledata
whos
%%
% We see in our workspace that we've just loaded a 3D variable called |u|,
% which could represent temperature data, precipitation, wind speed, or
% what-have-you. For this example let's say |u| is a gridded wind speed data set
% whose dimensions correspond to latitude, longitude, and time,
% respectively. The |t_daily| array indicates that each slice along
% dimension 3 of |u| corresponds to a daily wind field on the grid given by
% |lat| and |lon|.
%
% For starters, let's look at a single point on the globe, at the
% intersection of the equator and the prime meridian. (We'll call it _Earth's Origin_.)
% In our data set, (0癗,0癊) corresponds to row 2, column 21.
uo = squeeze(u(2,21,:));
%%
% We can plot the daily time series of wind at Earth's Origin like this:
plot(t_daily,uo,'b-')
xlabel('time')
ylabel('wind speed or something')
box off
datetick
axis tight; hold on
legend('daily data','location','southwest')
%%
% The daily time series of wind at Earth's Origin is a bit noisy. Let's turn the daily
% time series into monthly means and plot the monthly means in red. If no
% downsampling period is specified in |downsample_ts|, |'monthly'| is assumed.
[uo_monthlymean,t_monthly] = downsample_ts(uo,t_daily);
plot(t_monthly,uo_monthlymean,'rs-','linewidth',2)
legend('daily data','monthly means','location','southwest')
%%
% To calculate the _monthly_ standard deviation, (monthly as opposed to the standard
% devition of the whole time series given by |std(uo)|)
% specify |'std'| as the function to perform on |uo|:
uo_monthly_std = downsample_ts(uo,t_daily,'std');
plot(t_monthly,uo_monthlymean + uo_monthly_std,'r')
plot(t_monthly,uo_monthlymean - uo_monthly_std,'r')
legend('daily data','monthly means',...
'monthly means +/- 1 monthly \sigma',...
'location','southwest')
%%
close all; clear uo_monthly_std uo_monthlymean t_monthly uo
%% Example 2: A big 3D data set.
% We often want to do more than look at time series at a single point on
% the Earth. If you have some data (perhaps <http://www.ecmwf.int/en/forecasts/datasets
% wind data> loaded from a NetCDF file), you might want to turn a giant 3D
% data set into a downsampled 3D data set. To get annual median values of
% the 3D |u| variable we loaded above, simply type
[u_yr_med,t_yr] = downsample_ts(u,t_daily,'year','median');
%%
% The time array |t_yr| is composed of date numbers
% corresponding to the data about which contributing data are centered.
% Let's take a look:
datestr(t_yr)
%%
% Note that the data set does not cover the entire year 2002, so data for
% that year are centered about April 17.
%
% If you'd like an array of only the years corresponding to these data, use
% the |datevec| function
[years,~,~] = datevec(t_yr)
%%
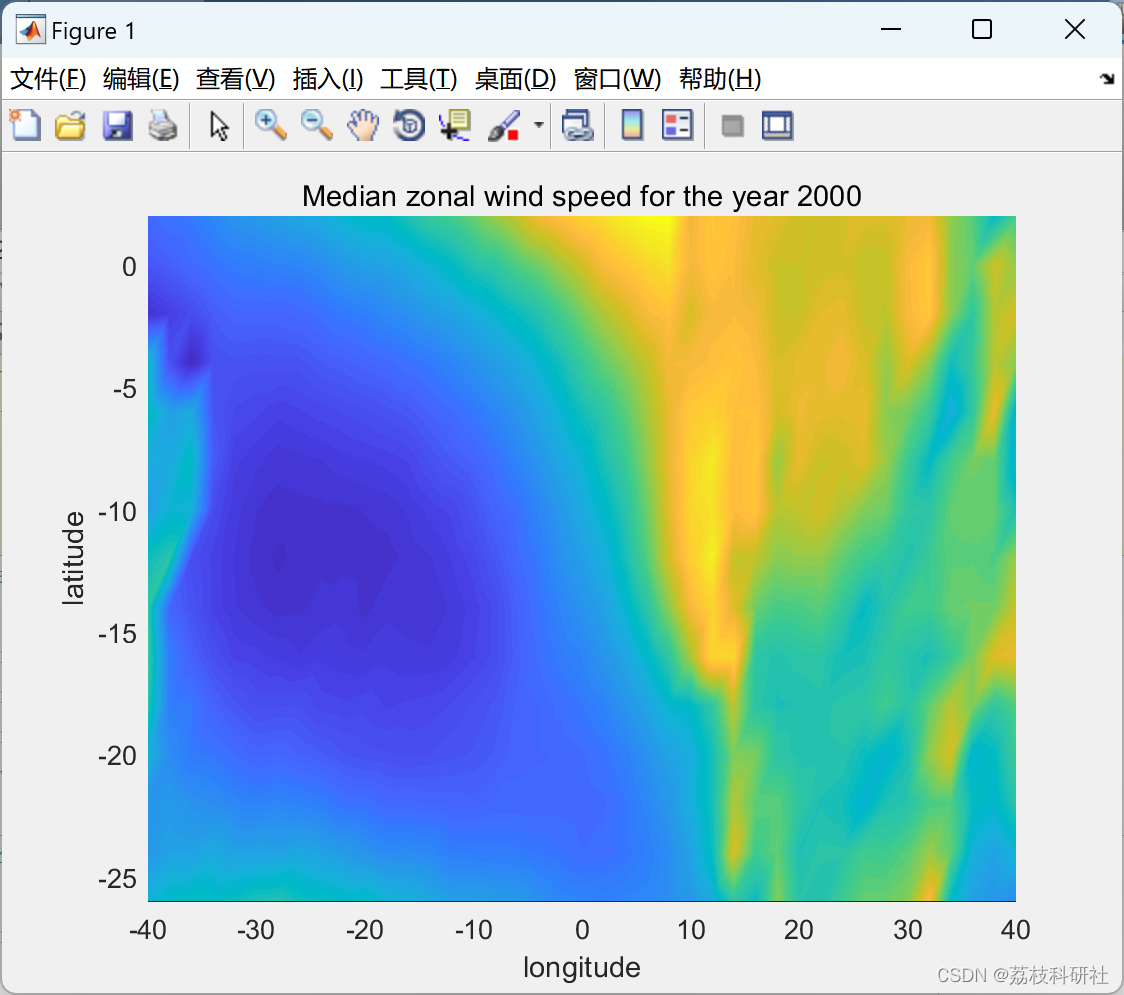
% If you'd like to animate the median fields we computed above, you can do
% so like this:
for loops = 1:5 % loop it 5 times
for k = 1:3 % because we have 3 annual median fields
h = pcolor(lon,lat,squeeze(u_yr_med(:,:,k)));
shading interp
caxis([-7 3])
xlabel('longitude')
ylabel('latitude')
title(['Median zonal wind speed for the year ',num2str(years(k))])
pause(.5)
end
end
🎉3 参考文献
部分理论来源于网络,如有侵权请联系删除。
[1]Chad Greene (2023). downsample_ts .


 6639
6639


 被折叠的 条评论
为什么被折叠?
被折叠的 条评论
为什么被折叠?
 到【灌水乐园】发言


