


👨🎓个人主页:研学社的博客
💥💥💞💞欢迎来到本博客❤️❤️💥💥
🏆博主优势:🌞🌞🌞博客内容尽量做到思维缜密,逻辑清晰,为了方便读者。
⛳️座右铭:行百里者,半于九十。
📋📋📋本文目录如下:🎁🎁🎁
目录

💥1 概述
文献来源:
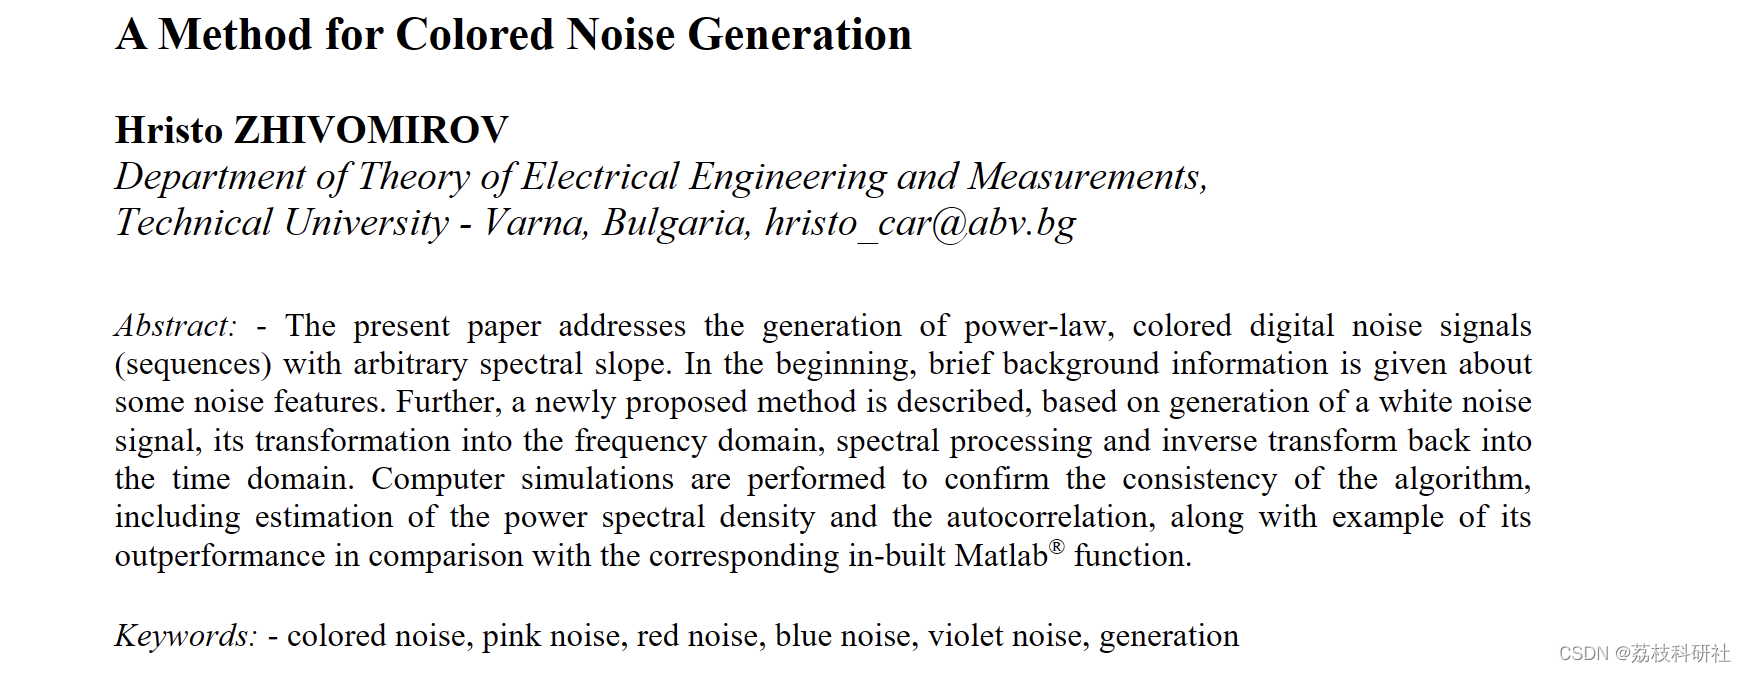
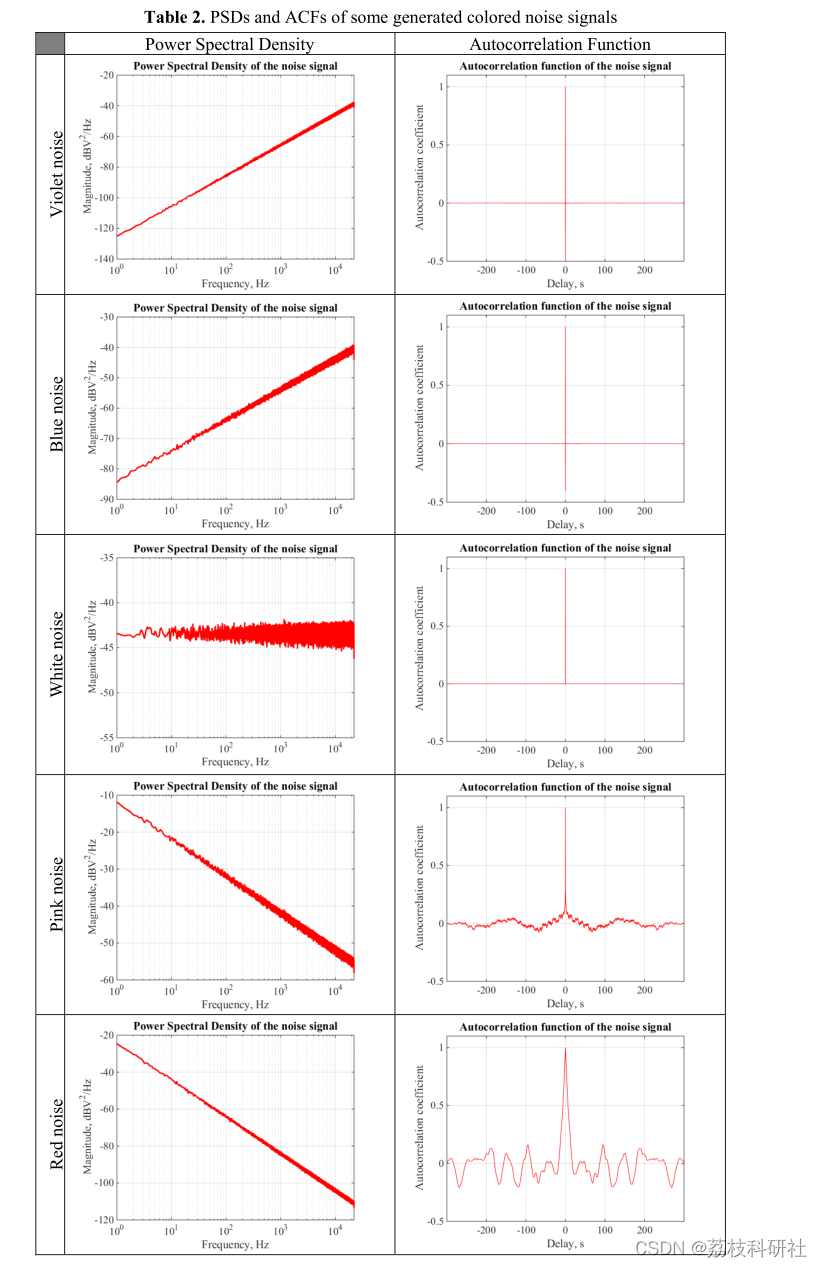
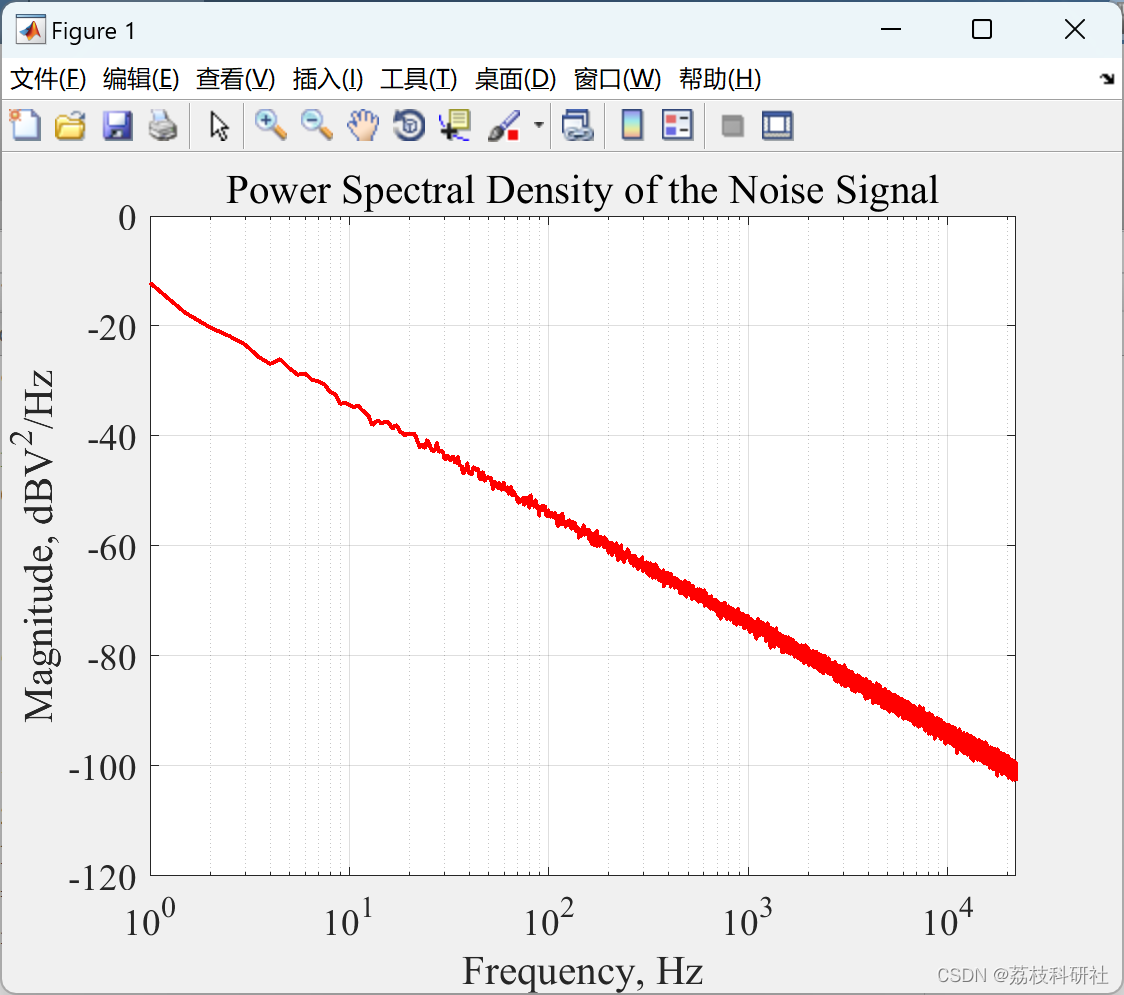
摘要:本文研究了具有任意谱斜率的幂律彩色数字噪声信号(序列)的生成。首先,简要介绍了一些噪声特征的背景信息。在此基础上,提出了一种基于白噪声信号的产生、频域变换、频谱处理和逆变换回时域的方法。进行了计算机模拟以确认算法的一致性,包括功率谱密度的估计和自相关性,以及与相应的内置Matlab®函数相比其优异性能的示例。
原文摘要:
Abstract: - The present paper addresses the generation of power-law, colored digital noise signals (sequences) with arbitrary spectral slope. In the beginning, brief background information is given about some noise features. Further, a newly proposed method is described, based on generation of a white noise signal, its transformation into the frequency domain, spectral processing and inverse transform back into the time domain. Computer simulations are performed to confirm the consistency of the algorithm, including estimation of the power spectral density and the autocorrelation, along with example of its outperformance in comparison with the corresponding in-built Matlab® function.
Keywords: - colored noise, pink noise, red noise, blue noise, violet noise, generation
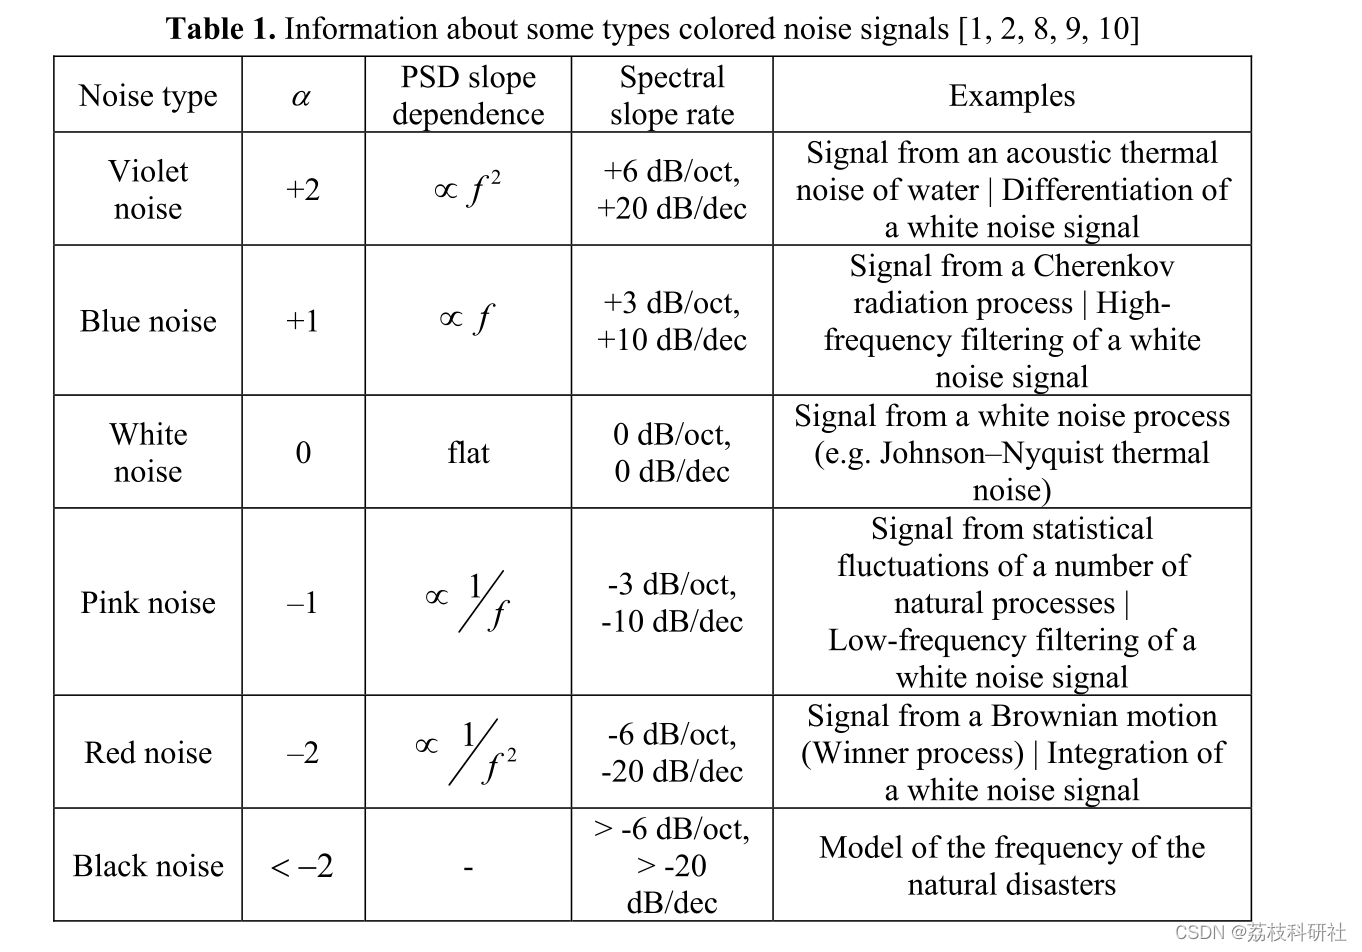
图1所示。提出了彩色噪声生成过程的算法。所需要的彩色噪声信号的产生是通过白噪声信号的频谱处理得到的:
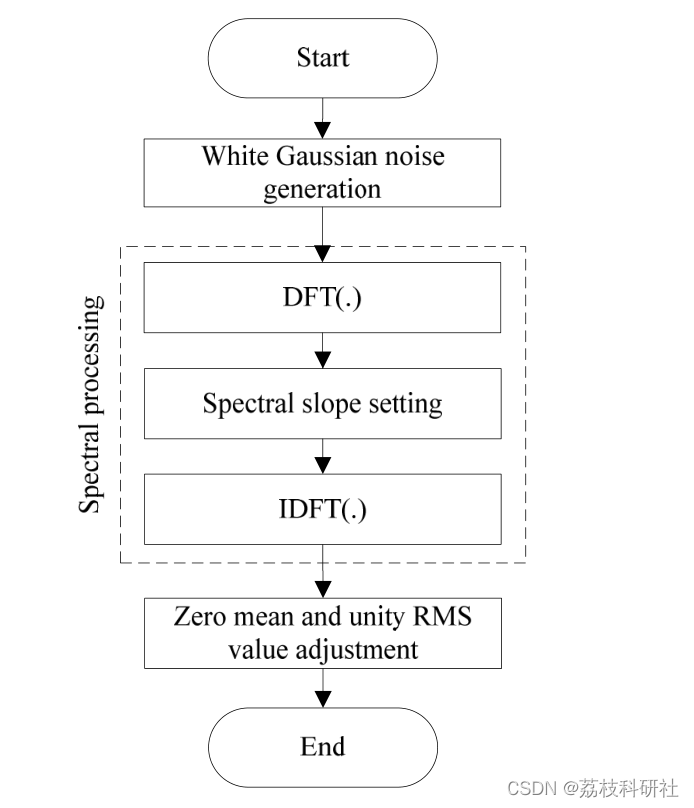
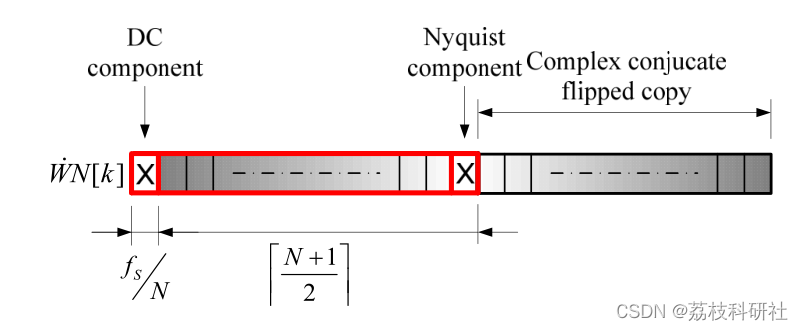
图2。信号离散谱的结构。光谱的左半部分(位于DC和奈奎斯特分量之间)是唯一的。右半部分是左半部分的共轭翻转副本,不包括DC和奈奎斯特分量它们是唯一的:
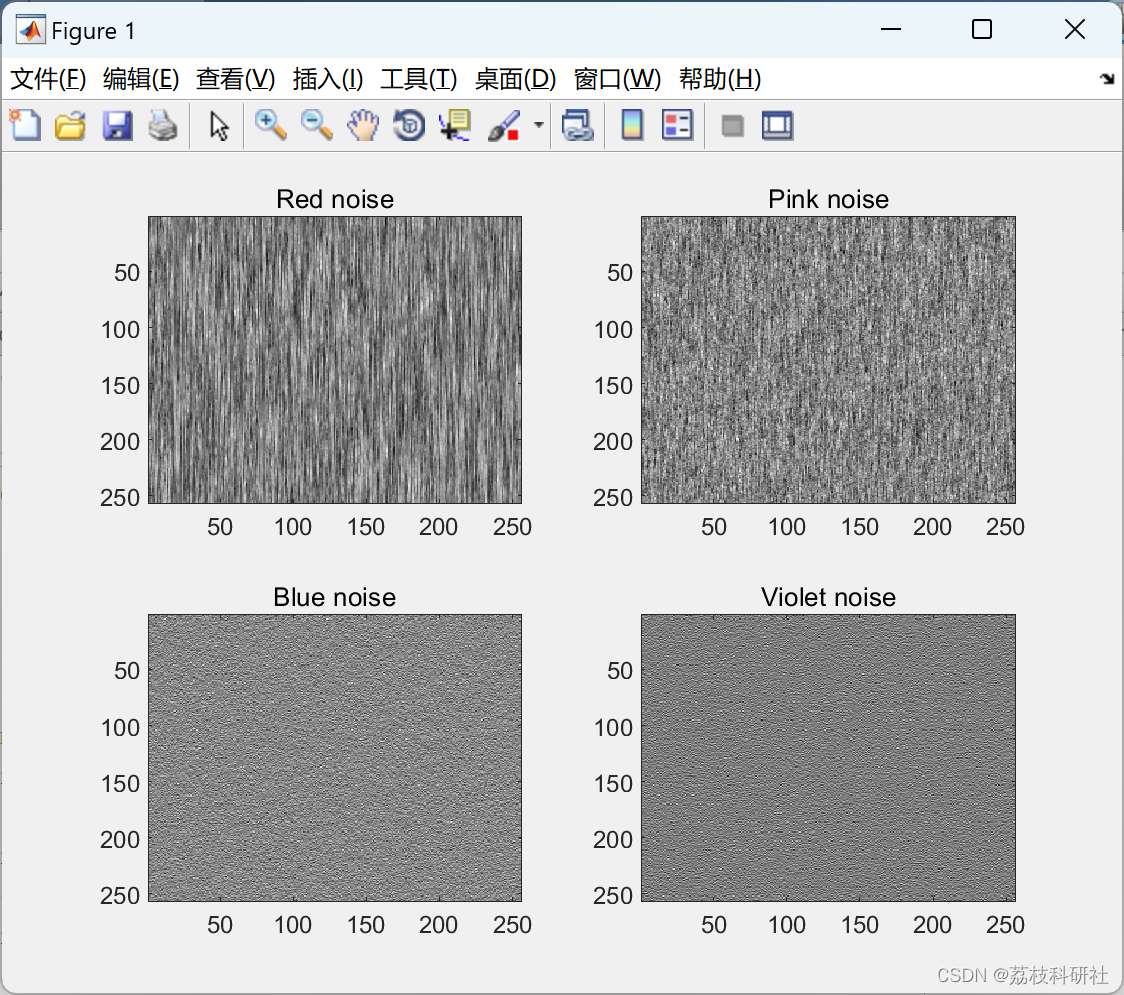
1) 粉红(闪烁)噪声 - 功率谱密度斜率 -3 dB/倍频程,-10 dB/十倍频程。
2) 红色(布朗)噪声 - 功率谱密度斜率 -6 dB/倍频程,-20 dB/十倍频程。
3) 蓝噪声 - 功率谱密度斜率 +3 dB/倍频程,+10 dB/十倍频程。
4) 紫色(紫色)噪声 - 功率谱密度斜率 +6 dB/倍频程,+20 dB/十倍频程。
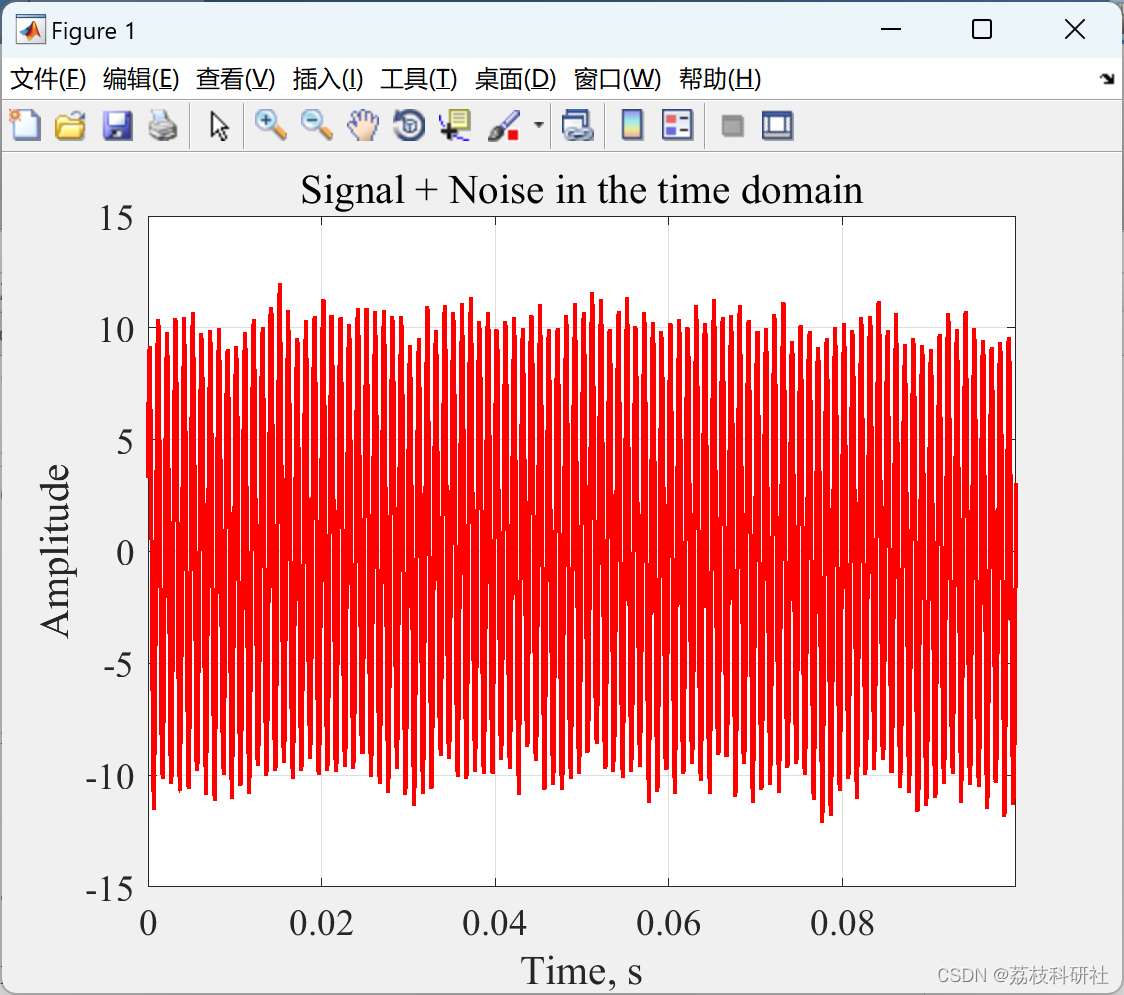
给出了一些示例来阐明函数的用法。为方便起见,输入和输出参数在每个函数的开头给出。生成的噪声信号具有单位标准差和零平均值。
📚2 运行结果
部分代码:
% function: x = pinknoise(N)
%
% Input:
% N - number of samples to be returned in the noise column vector
% alpha - PSD spectral slope
%
% Output:
% x - column vector of pink noise samples with unity
% standard deviation and zero mean value
%
% The function generates a column vector of pink (flicker) noise
% samples. In terms of power at a constant bandwidth, the pink
% noise falls off by -3 dB/oct i.e., -10 dB/dec.
function x = pinknoise(N)
% input validation
validateattributes(N, {'double'}, ...
{'scalar', 'integer', 'nonnan', 'finite'}, ...
'', 'N', 1)
% set the PSD slope
alpha = -1;
% convert from PSD (power specral density) slope
% to ASD (amplitude spectral density) slope
alpha = alpha/2;
% generate AWGN signal
x = randn(1, N);
% calculate the number of unique fft points
NumUniquePts = ceil((N+1)/2);
% take fft of x
X = fft(x);
% fft is symmetric, throw away the second half
X = X(1:NumUniquePts);
% prepare a vector with frequency indexes
n = 1:NumUniquePts;
% manipulate the left half of the spectrum so the spectral
% amplitudes are proportional to the frequency by factor f^alpha
X = X.*(n.^alpha);
% perform ifft
if rem(N, 2) % odd N excludes Nyquist point
% reconstruct the whole spectrum
X = [X conj(X(end:-1:2))];
% take ifft of X
x = real(ifft(X));
else % even N includes Nyquist point
% reconstruct the whole spectrum
X = [X conj(X(end-1:-1:2))];
% take ifft of X
x = real(ifft(X));
end
% ensure zero mean value and unity standard deviation
x = x - mean(x);
x = x/std(x, 1);
x = x(:);
end
🎉3 参考文献
部分理论来源于网络,如有侵权请联系删除。


 5917
5917


 被折叠的 条评论
为什么被折叠?
被折叠的 条评论
为什么被折叠?
 到【灌水乐园】发言


