library("ggplot2")
library("ggbreak")
library(RColorBrewer)
top.mar=0.2
right.mar=0.2
bottom.mar=0.2
left.mar=0.2
mytheme<-theme_classic()+
theme(text=element_text(family = "sans",colour ="black",size = 12),
legend.text=element_text(colour ="black",size = 8),
legend.title=element_text(colour ="black",size = 10),
legend.key.size=unit(4,units = "mm"),
legend.position=c(0.10,0.88),
axis.line = element_line(size =1,colour = "black"),
axis.ticks = element_line(size = 1,colour = "black"),
axis.ticks.length = unit(1.5,units = "mm"),
plot.margin=unit(x=c(top.mar,right.mar,bottom.mar,left.mar),
units="inches"))
dt <- read_excel('图2b.xlsx')
colnames(dt)
dt$day <- factor(dt$day,levels=dt$day)
p <- ggplot(dt,aes(x=day,y=value,fill=factor(day)))
p1 <- p+geom_bar(position = "dodge",
stat = "identity",
width = 0.5,show.legend = FALSE)+
geom_errorbar(
aes(
x = day,
ymin = value - sd,
ymax = value + sd
),
width = 0.1,
color = 'black',
position = position_dodge(0.5),
size = 0.8
)+
scale_y_continuous(limits = c(0, 120),
breaks = c(0,5,10,15,20),
label = c("0","5","10","15","20"))+
scale_y_break(c(20, 60),scales = "free",
ticklabels=c(60,80,100,120),
expand=expansion(add = c(0, 0)),
space = 1)+
mytheme+
scale_fill_manual(values = brewer.pal(7,'Dark2'))+
theme(axis.text = element_text(colour = 'black',size = 20),
text = element_text(colour = 'black',size = 20))+
labs(x = '',
y ='')+
theme(axis.line.y.right = element_line(colour = "white"),
axis.text.y.right = element_text(colour = 'white'),
axis.ticks.y.right = element_line(colour = 'white'))
p1
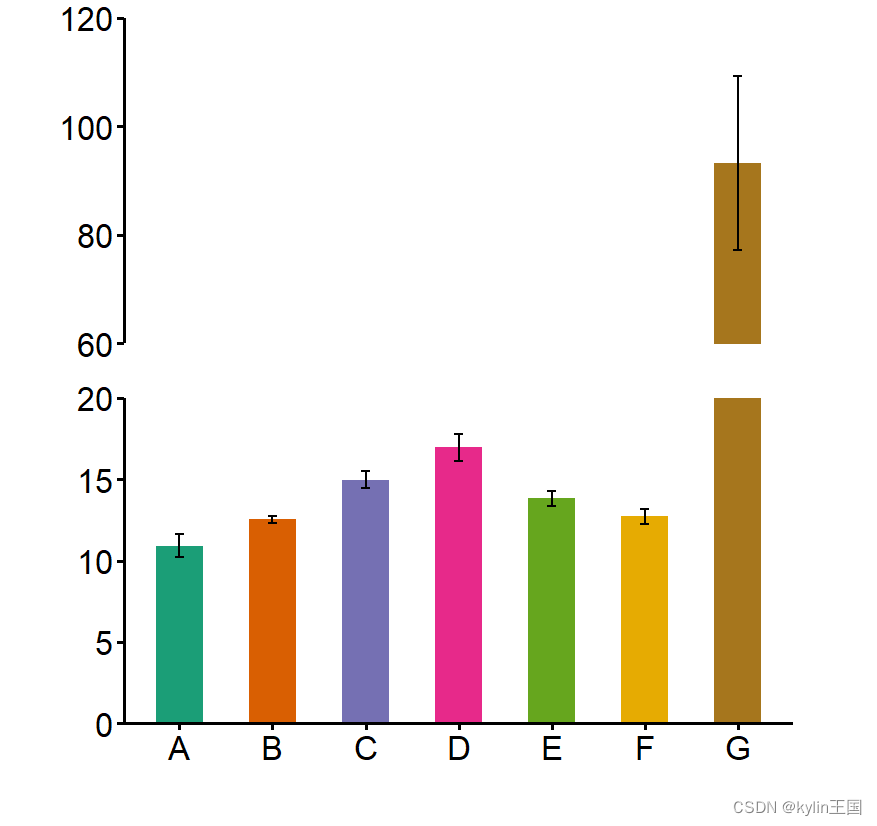


 本文介绍如何使用R语言中的ggplot2包绘制带有误差线的条形图,并展示了如何自定义图表主题,包括图例位置、字体样式、坐标轴等细节。


 768
768

 被折叠的 条评论
为什么被折叠?
被折叠的 条评论
为什么被折叠?
 到【灌水乐园】发言


