


Matplotlib——绘制多个子图,多子图有图例分颜色,搞定所有matplotlib绘制子图需要考虑的问题
一、代码实现
1.1 导入包
import matplotlib.pyplot as plt
import numpy as np
1.2 画图
# 设置整个图的尺寸为3:2格式
fig, axes = plt.subplots(2, 3, figsize=(12, 8))
plt.subplots_adjust(hspace=0.3, wspace=0.3, bottom=0.2)

# 定义线条样式和颜色
line_styles = ['-', '--']
line_colors = ['blue', 'r']

# plot 1:
x = np.array([0, 6])
y1 = np.array([0, 100])
y2 = np.array([20, 120])
axes[0, 0].plot(x, y1, line_styles[0], color=line_colors[0], label="Line 1")
axes[0, 0].plot(x, y2, line_styles[1], color=line_colors[1], label="Line 2")
axes[0, 0].set_xlabel("X")
axes[0, 0].set_ylabel("Y")
axes[0, 0].set_title("plot 1")

# plot 2:
x = np.array([1, 2, 3, 4])
y1 = np.array([1, 4, 9, 16])
y2 = np.array([2, 6, 12, 20])
axes[0, 1].plot(x, y1, line_styles[0], color=line_colors[0], label="Quadratic 1")
axes[0, 1].plot(x, y2, line_styles[1], color=line_colors[1], label="Quadratic 2")
axes[0, 1].set_xlabel("X")
axes[0, 1].set_ylabel("Y")
axes[0, 1].set_title("plot 2")

# plot 3:
x = np.array([1, 2, 3, 4])
y1 = np.array([3, 5, 7, 9])
y2 = np.array([4, 6, 8, 10])
axes[0, 2].plot(x, y1, line_styles[0], color=line_colors[0], label="Linear 1")
axes[0, 2].plot(x, y2, line_styles[1], color=line_colors[1], label="Linear 2")
axes[0, 2].set_xlabel("X")
axes[0, 2].set_ylabel("Y")
axes[0, 2].set_title("plot 3")

# plot 4:
x = np.array([1, 2, 3, 4])
y1 = np.array([4, 5, 6, 7])
y2 = np.array([5, 6, 7, 8])
axes[1, 0].plot(x, y1, line_styles[0], color=line_colors[0], label="Linear 1")
axes[1, 0].plot(x, y2, line_styles[1], color=line_colors[1], label="Linear 2")
axes[1, 0].set_xlabel("X")
axes[1, 0].set_ylabel("Y")
axes[1, 0].set_title("plot 4")

# plot 5:
x = np.array([1, 2, 3, 4])
y1 = np.array([4, 5, 9, 7])
y2 = np.array([5, 6, 8, 6])
axes[1, 1].plot(x, y1, line_styles[0], color=line_colors[0], label="Cubic 1")
axes[1, 1].plot(x, y2, line_styles[1], color=line_colors[1], label="Cubic 2")
axes[1, 1].set_xlabel("X")
axes[1, 1].set_ylabel("Y")
axes[1, 1].set_title("plot 5")

# plot 6:
x = np.array([1, 2, 3, 4])
y1 = np.array([4, 2, 6, 7])
y2 = np.array([5, 3, 7, 8])
axes[1, 2].plot(x, y1, line_styles[0], color=line_colors[0], label="Nonlinear 1")
axes[1, 2].plot(x, y2, line_styles[1], color=line_colors[1], label="Nonlinear 2")
axes[1, 2].set_xlabel("X")
axes[1, 2].set_ylabel("Y")
axes[1, 2].set_title("plot 6")

# 添加总体图例
lines = [plt.Line2D([0], [0], color=line_colors[i], linestyle=line_styles[i]) for i in range(len(line_colors))]
fig.legend(lines, ["Line 1", "Line 2"], loc="lower center", ncol=2, bbox_to_anchor=(0.5, 0.05))
plt.subplots_adjust(bottom=0.15)

plt.show()
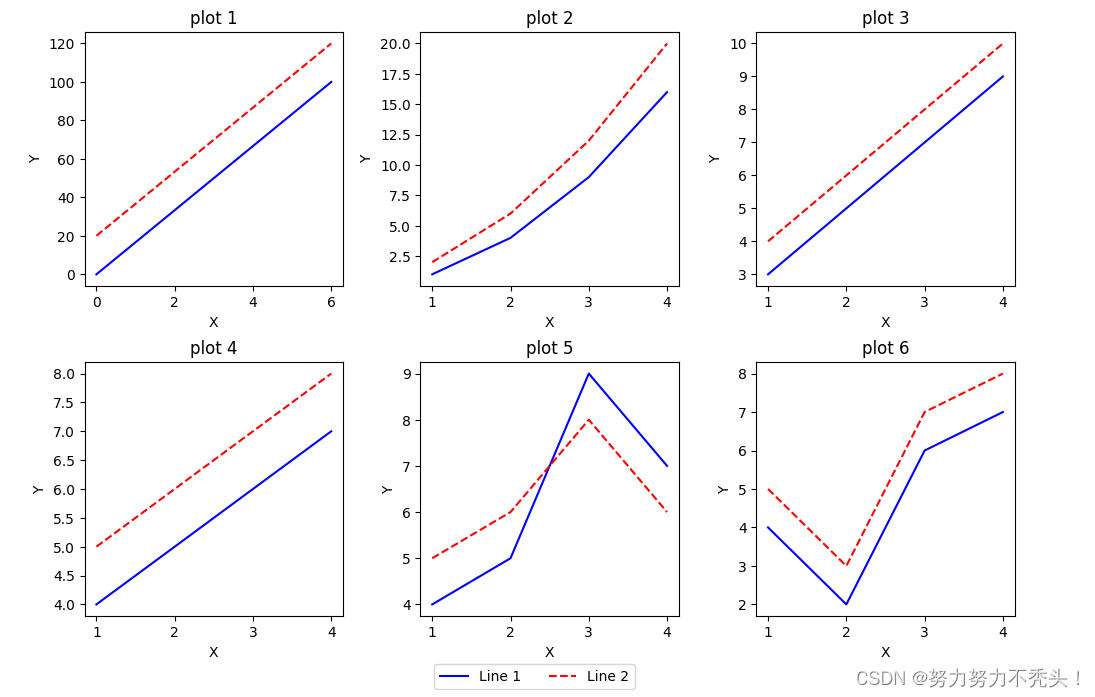
1.3 绘制结果


 992
992

 被折叠的 条评论
为什么被折叠?
被折叠的 条评论
为什么被折叠?
 到【灌水乐园】发言


