


更多精彩内容请关注微信公众号:GEEer成长日记
今天我们介绍Modis_LST产品MODIS/006/MOD11A1,这款产品目前来说使用率很高,而且有每日数据,经过很多校正得到的。
之后我们将介绍Landsat产品在LST计算方面的研究~
MODIS/006/MOD11A1
先看看官方介绍:The MOD11A1 V6 product provides daily land surface temperature (LST) and emissivity values in a 1200 x 1200 kilometer grid. The temperature value is derived from the MOD11_L2 swath product. Above 30 degrees latitude, some pixels may have multiple observations where the criteria for clear-sky are met. When this occurs, the pixel value is the average of all qualifying observations. Provided along with both the day-time and night-time surface temperature bands and their quality indicator layers are MODIS bands 31 and 32 and six observation layers.
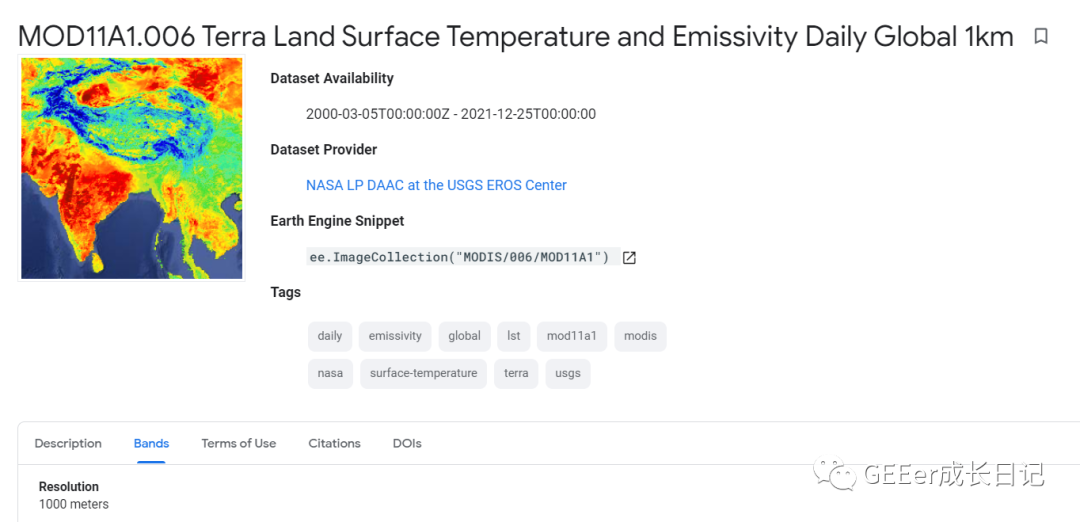
MODIS/006/MOD11A1数据介绍
https://developers.google.com/earth-engine/datasets/catalog/MODIS_006_MOD11A1#description
分辨率:1000m
波段:白天和夜晚LST都有
我们以白天的LST为研究目标,如果大家研究夜间LST的话,改波段名称即可。下面的方法是小编在论坛看到的,比我自己写的要严谨很多,因此分享给大家。一起进步呀~
//还是老样子哈,以广东省为目标
var geometry = ee.FeatureCollection('users/ZhengkunWang/guangdongsheng')
Map.centerObject(geometry,7)

// Get  temperature data for 1 year.
var modis = ee.ImageCollection('MODIS/006/MOD11A1');
var modisLST = modis.filterBounds(geometry)
                    .filterDate('2020-01-01', '2020-12-31')
                    .select('LST_Day_1km');

// Convert temperature to Celsius.
modisLST = modisLST.map(function(img){
  var date = img.get('system:time_start');
  return img.multiply(0.02).subtract(273.15).set('system:time_start', date);
});
Map.addLayer(modisLST.mean().clip(geometry), {min: 10, max: 30, palette: ['green','yellow', 'red']},'LST');
计算每日地表温度均值。
// Create a function that takes an image, calculates the mean over a
// geometry and returns the value and the corresponding date as a
// feature.
var createTS = function(img){
  var date = img.get('system:time_start');
  var value = img.reduceRegion(ee.Reducer.mean(), geometry).get('LST_Day_1km');
  var ft = ee.Feature(null, {'system:time_start': date,
                             'date': ee.Date(date).format('Y/M/d'),
                             'value': value});
  return ft;
};

// Apply the function to each image in modisLST.
var TS = modisLST.map(createTS);
print('TS', TS);

// Create a graph of the time-series.
var graph = ui.Chart.feature.byFeature(TS, 'system:time_start', 'value');

print(graph.setChartType("ColumnChart")
           .setOptions({vAxis: {title: 'LST [deg. C]'},
                        hAxis: {title: 'Date'}}));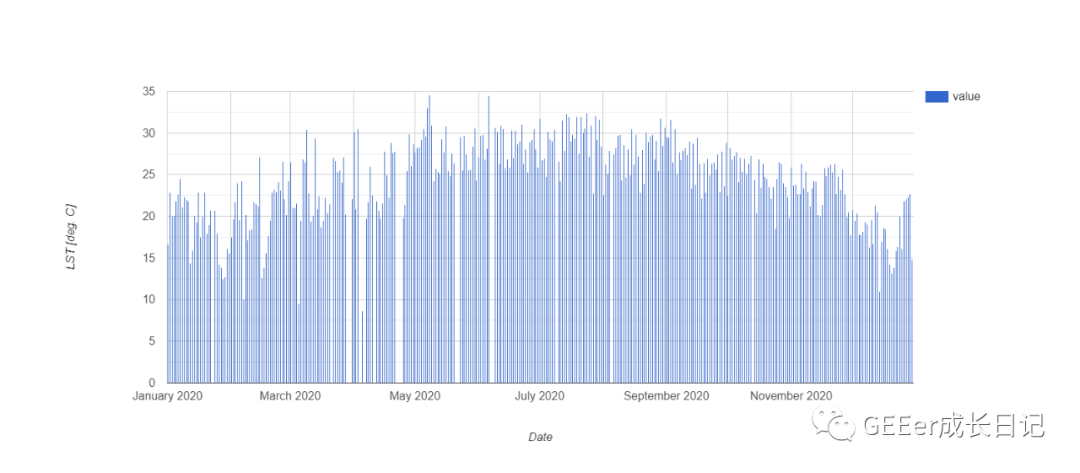
接着计算月均值。并查看影像的坐标系。按照原始坐标系进行月均值计算和显示。
//** Extract projection of MODIS imagery, for reducing regions later on
//   (or set/select the desired projection/crs)
var MODISproj = ee.Image(modisLST.first()).projection();
print('MODISproj:', MODISproj);

//** Create a list of months to map over
var monthList = ee.List.sequence({start:1,end:12,step:1});
print('monthList:', monthList);

//** Function that takes the images for a specified month, calculates the
//   mean over that month, then over a geometry, and returns a value
//   alongside the first date as that month as a time stamp property
var createMonthTS = function(month){
  //--- Define start and end of current month search window (end is exclusive)
  var start = ee.Date.fromYMD(2020, month, 1);
  var end = start.advance(1, 'month');
  //--- Filter by start and end dates
  var monthColl = modisLST.filterDate(start, end);
  //--- First reduce collection with mean reducer, then extract value from geometry
  var monthMean = monthColl.mean();
  var meanVal = monthMean.reduceRegion({
    reducer: ee.Reducer.mean(),
    geometry: geometry,
    crs: MODISproj});

  //--- Create feature with desired data/properties and empty geometry
  var ft = ee.Feature(null, {
    'system:time_start': ee.Image(monthColl.first()).get('system:time_start'),
    'date': start.format('Y/M/d'),
    'value': meanVal.get('LST_Day_1km')
  });
  return ft;
};

//** Map funciton over month list; recast as feature colleciton
var monthTS = ee.FeatureCollection(monthList.map(createMonthTS));
print('monthTS:', monthTS);

//** Create new graph for monthly temperatures
var monthGraph = ui.Chart.feature.byFeature({
  features:monthTS,
  xProperty:'system:time_start',
  yProperties: 'value'});

//** Print graph to console
print(monthGraph.setChartType("ColumnChart")
           .setOptions({vAxis: {title: 'LST [deg. C]'},
                        hAxis: {title: 'Date'}}));
结果如图:
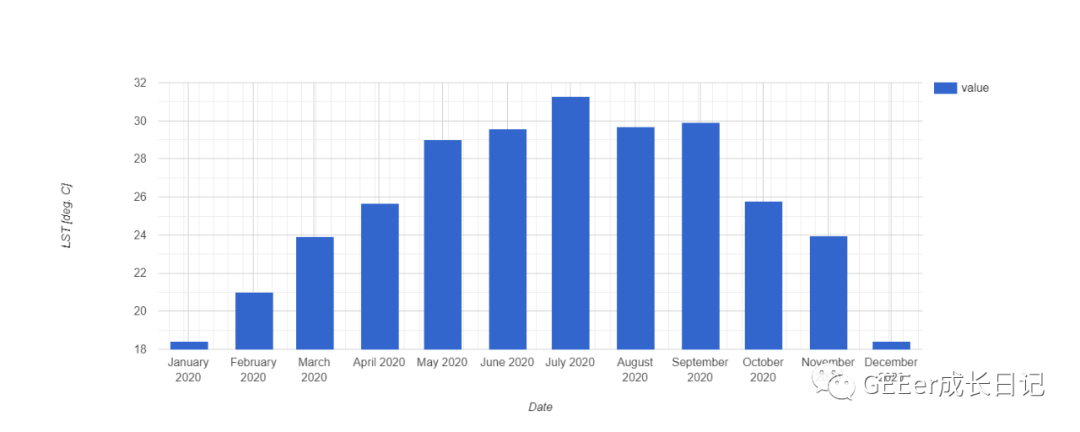
这串代码有很多值得我们学习的地方:查看影像的坐标系,因为我们之后会介绍转换坐标系的方法,前提是我们先学会查看当前坐标系。计算月平均值的方法也值得我们学习,我们之前介绍的方法都是直接统计影像的面平均值再展示,而本文是先计算平均值,构成特征集合再进行显示。还有柱状图的显示设置也值得我们学习……
本期我们以分享为主,跟大家一起进步,至于有同学需要下载每日数据或月平均影像,相关方法我们已经在之前的文章中已经介绍过了。大家多回去看看之前的文章。
公众号回复:010301 即可获取上述代码。如果真的可以帮到你,记得给小编点个赞哦~
更多精彩内容请关注微信公众号:


 1877
1877

 被折叠的 条评论
为什么被折叠?
被折叠的 条评论
为什么被折叠?
 到【灌水乐园】发言


