Echarts笔记——折线图/柱状图(1)设置Y轴双坐标轴,图表参考右坐标轴
position: "right", # y 轴的位置,参数 "left","right"。
yAxisIndex: 1, # y轴的 index定位索引 ,默认值为0 ,参数类型:number。
<!DOCTYPE html>
<html lang="en">
<head>
<meta charset="UTF-8">
<title>Title</title>
<script src="../../js/echarts.min.js"></script>
<script src="../../js/jquery.min.js"></script>
</head>
<body>
<div id="main" style="width: 1200px; height: 800px;"></div>
<style>
#main {
margin-top: 100px;
margin-left: 100px;
}
</style>
</body>
<script type="text/javascript">
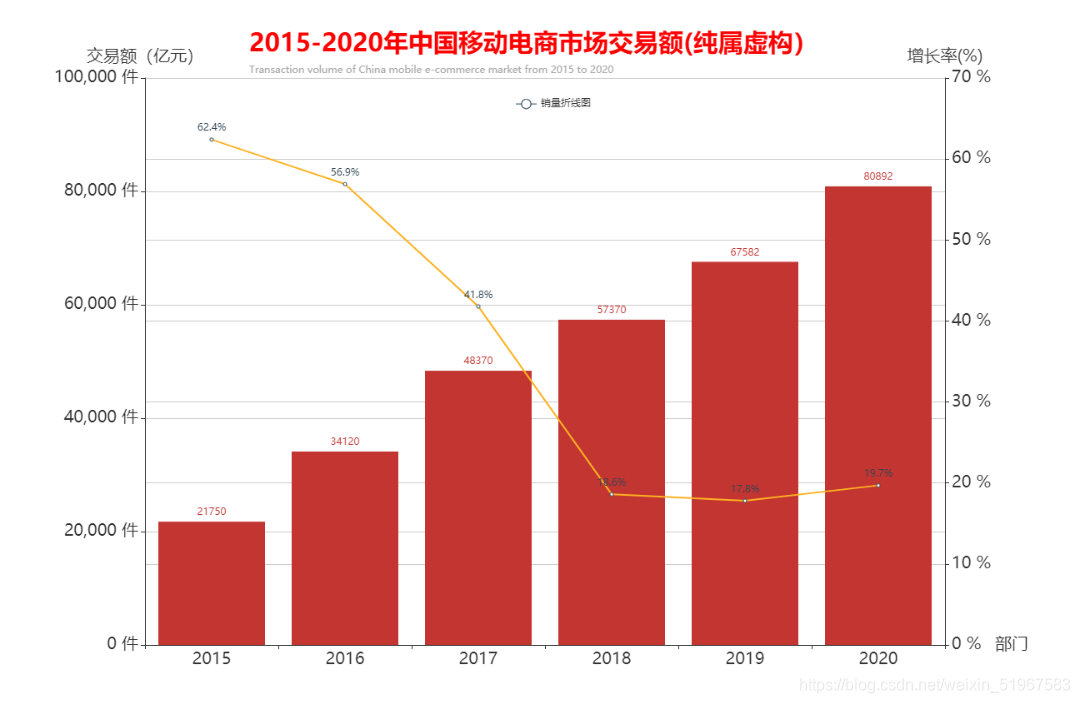
line_Data = [62.4, 56.9, 41.8, 18.6, 17.8, 19.7]
bar_Data = [21750, 34120, 48370, 57370, 67582, 80892]
x_Data = ['2015', '2016', '2017', '2018', '2019', '2020']
// 基于准备好的dom,初始化echarts实例
var myChart1 = echarts.init(document.getElementById('main'))
$(function (ec) {
var option = {
title: {
text: '2015-2020年中国移动电商市场交易额(纯属虚构)',
subtext: "Transaction volume of China mobile e-commerce market from 2015 to 2020",
left: '20%',
textStyle: {
color: 'red',
fontSize: 30
}
},
legend: {
right: '45%',
top: "10%"
},
xAxis: {
name: '部门',
type: 'category',
data: x_Data,
nameGap:60, // 坐标轴名称与轴线之间的距离。
axisLabel: { // x轴标签样式
textStyle: {fontSize: 20}
},
nameTextStyle: { // 坐标轴名字样式
fontSize: 20
},
},
yAxis: [
{
name: '交易额(亿元)',
type: 'value',
min: 0,
max: 100000,
axisLabel: { // 坐标轴标签样式设置
textStyle: {fontSize: 20},
formatter: '{value} 件', // 给坐标轴标签加单位
},
nameTextStyle: {fontSize: 20},
}, {
name: "增长率(%)",
type: "value",
min: 0,
max: 70,
position: "right",
formatter: "{value}%",
axisLabel: {
textStyle: {fontSize: 20},
formatter: '{value} %', // 给坐标轴标签加单位
},
nameTextStyle: {fontSize: 20},
itemStyle: {
color: "#ffd07a"
},
}
],
series: [
{
type: "bar",
data: bar_Data,
label: {
show: true,
position: "top"
}
},
{
name: '销量折线图',
type: 'line',
data: line_Data,
barWith: "40%",
label: {
show: true,
position: "top",
formatter: "{c}%"
},
lineStyle: {
color: "#ffb122"
},
yAxisIndex: 1
},
]
};
myChart1.setOption(option)
})
</script>
</html>


 3776
3776

 被折叠的 条评论
为什么被折叠?
被折叠的 条评论
为什么被折叠?
 到【灌水乐园】发言


