


Given a scenario, what are the data science questions you can ask, what datasets can you use, and what methods can you use to conduct your analysis.
给定一个场景,您可以提出哪些数据科学问题,可以使用哪些数据集,以及可以使用哪些方法来进行分析。
1. 什么是数据科学?
- The study of extracting value from data. 从数据中提取价值的研究。
- Data science is a field focused on developing a set of principles for identifying and creating useful data that can be analyzed and interpreted to give insight into the conditions, processes, and behaviors of the world we live in. 数据科学是一个专注于开发一套识别和创建有用数据的原则的领域,这些数据可以被分析和解释,从而洞察我们生活的世界的条件、过程和行为。
2. 一些不同
3. 数据科学例子
- Domain specific data science question: How have characteristics of different communities and measurements of different types of pollutants in these communities changed as government standards and regulations have changed? 随着政府标准和法规的变化,不同社区的特征和不同类型污染物的测量方法有何变化?
- Domain specific data science question: How can we use publicly available data to improve emergency response? 我们如何利用可公开获得的数据来改善应急反应?
- Domain specific data science question: How can we use new data sources to help determine when, where, and if people will migrate? 我们如何使用新的数据源来帮助确定人们何时、何地以及是否会迁移?
- Domain specific data science question: How can we use literature at scale to determine the most influential writers of the 19th century 我们如何利用文学的规模来确定19世纪最有影响力的作家
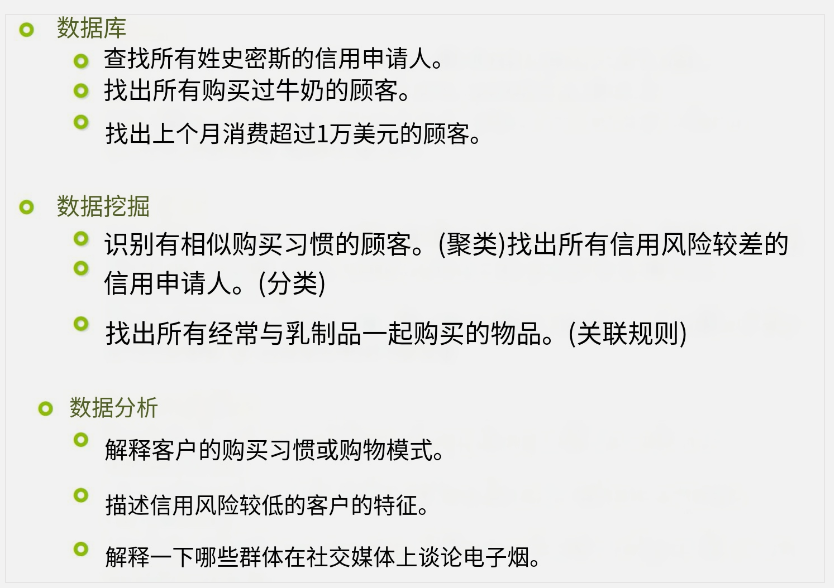
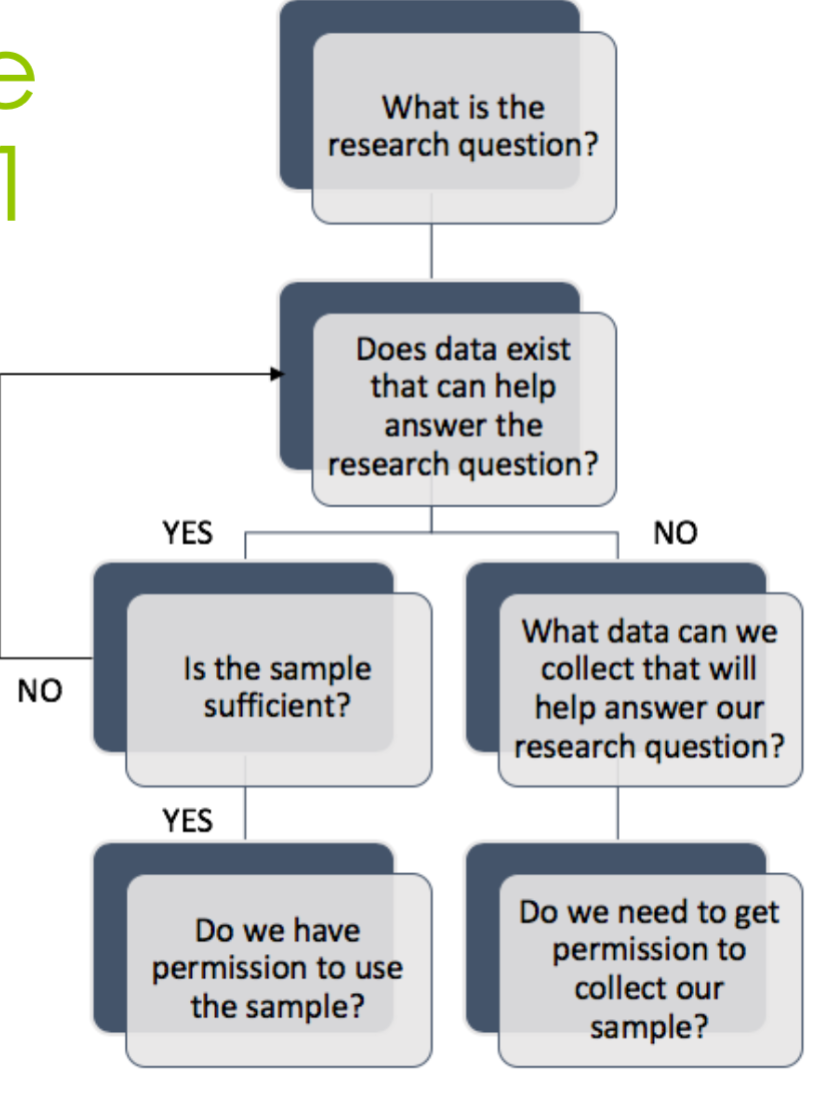
4. 设计一个数据科学学习 Part 1
5. Data Ethic 数据道德
A set of principles and processes that guide the ethical collection, processing, analysis, use, and application of data having an effect on human lives and society. 对人类生活和社会有影响的数据进行道德化的收集、处理、分析、使用和应用的一套原则和过程。
- 个人隐私权
- 数据误用
- 算法倾斜
- 对人类社会的发展和影响
- 知情同意, 数据授权
- 数据安全
- 合规性
- 透明度
6. Exploratory analysis 探索性分析
– Attempt to understand your data by describing it in different ways (histograms, clusters, correlations, etc.) 尝试用不同的方式来描述数据(直方图、聚类、相关性等),从而理解数据。
7. Predictive Modeling 预测建模
Machine Learning – Designed to predict or classify with the most accuracy even if the data
does not follow a known distribution. 机器学习 - 即使数据不遵循已知分布,也能以最准确的方式预测或分类。
Statistical models – Designed to infer the underlying generative process. Statistical models make explicit assumptions about the data generating process and the distribution. 统计模型 - 用来推断潜在的生成过程。统计模型对数据的生成过程和分布作出明确的假设。
8. 数据科学挑战
volumn 规模
Variety 多样化
Velocity 速度
Veracity 真实性
9. Predicvtive vs Descriptive
描述性分析 (Descriptive Analysis)
描述性分析是对已有数据的整理、总结、展示和解释,以便更好地理解数据的特征、结构和模式。它是对数据的静态观察,旨在提供数据的基本信息,而不试图做出进一步的推断或预测。描述性分析通常包括以下内容:
-
中心趋势测量(Measures of Central Tendency):例如均值、中位数和众数,用于描述数据集的核心位置。
-
离散趋势测量(Measures of Dispersion):例如标准差和范围,用于描述数据的分散程度。
-
数据分布和形状(Data Distribution and Shape):包括频率分布表、直方图等,用于描述数据的分布特征。
-
关联和相关性(Correlations):用于了解不同变量之间的关系。
-
可视化展示(Data Visualization):通过图表、图形等方式展示数据,以便更直观地理解
预测性分析 (Predictive Analysis)
预测性分析是通过对已有数据的建模和分析,来进行对未来事件或趋势的预测。它是一种基于数据的动态分析,旨在通过已知信息来预测未来可能发生的情况。预测性分析通常包括以下内容:
-
建模和算法选择(Modeling and Algorithm Selection):选择适当的数学模型和算法,以便根据历史数据进行预测。
-
训练模型(Model Training):使用历史数据来训练模型,使其能够理解和捕获数据中的模式。
-
验证和评估(Model Validation and Evaluation):使用一部分数据来验证模型的准确性和可靠性。
-
预测和应用(Prediction and Application):使用训练好的模型来预测未来事件或趋势,并根据预测结果做出相应的决策
区别:
-
描述性分析是对已有数据进行整理和总结,目的是更好地理解数据的特征和结构。预测性分析则是基于已有数据建立模型,以便预测未来可能发生的情况。
-
描述性分析侧重于提供对数据的静态观察,不做进一步的推断或预测。预测性分析则是动态的,通过建模和分析来预测未来情况。
-
描述性分析通常包括统计量、可视化等方法,而预测性分析需要使用建模技术,如回归分析、机器学习等。
10. 数据科学的基本流程
-
问题定义:明确定义要解决的问题或目标。
-
数据收集:收集与问题相关的数据,可以是结构化数据(如表格数据)或非结构化数据(如文本、图像等)。
-
数据清洗:处理缺失值、异常值等,确保数据质量。
-
数据分析:对数据进行探索和分析,了解数据的特征、分布等。
-
模型构建:选择合适的建模技术,构建用于解决问题的模型。
-
模型评估:评估模型的性能,通常使用各种指标来衡量模型的准确性和效果。
-
部署:将模型部署到实际应用中,让其可以对新数据进行预测或分类。
11. Understanding the data 明白数据
Before conducting any analysis, we need to:
Understand what type of data we have 数据类型
Understand the different representations of the data 数据的不同表示
Determine whether the different values are discrete or continuous 连续或者离散
Determine if the attribute values are nominal, ordinal, interval, ratio, etc. 标称的、序数的、间隔的、比例的
Preprocess the data for data analytics
12. Type of data 数据类型
- Record data: Data that consists of a collection of records, each of which consists of a fixed set of attributes 由记录集合x 组成的数据,每个记录集合由一组固定的属性组成
- Documents: Each document can be viewed as a term (word) vector. 每个文档都可以看作是一个术语(词)向量。
在一个术语向量中:
Each term is a component (attribute/variable) of the vector, 每一项是向量的一个分量(属性/变量)
The value of each component is the number of times the corresponding word occurs in the document. 每个分量的值是对应的单词在文档中出现的次数。
The first vector here is <3, 0, 5, 0, 1, 4, 0, 1, 1, 3>
- Transaction Data :A special type of record (row) data, where each record (transaction/row)
involves a set of items. 事务数据:一种特殊类型的记录(行)数据,其中每条记录(事务/行)涉及一组项。(key-value)
- 图片数据
A graph can be generated from any data that has objects and connections betweenthose objects. 图可以由任何具有对象和这些对象之间的连接的数据生成。
- 网络数据
Network data must be clearly define vertices (nodes) and relationships (edges). 网络数据必须明确定义顶点(节点)和关系(边)。
- Ordered Data
Data that contains an ordering that is important to preserve 包含需要保存的重要顺序的数据
DNA
- Spatio-Temporal Data
- Data Matrix Concept
If data objects have the same fixed set of numeric attributes, then the data objects can be thought of as points in a multi-dimensional space, where each dimension represents a distinct attribute. 如果数据对象具有相同的固定数字属性集,则可以将数据对象视为多维空间中的点,其中每个维度表示一个不同的属性。
13. 我们怎么获得数据?
1. Web scraping 网页抓取
– “grabbing data” from the webpage directly. 直接从网页“抓取数据”
抓取规则
检查场地的条款和条件。
要小心——webquest会走得很快——换句话说——大多数有api的站点限制了你可以发出的请求的数量。
网站布局改变导致scraper断裂。有时候你需要进行更新。
网站页面不一致。预计必须清理数据
2. Using company provided APIs 使用公司提供的api
– “URL Get/Post based”. “基于URL的获取/发布”
- end points
- API keys
- Oauth
A protocol that allows for secure authorization using standard methods 允许使用标准方法进行安全授权的协议
这是访问受保护数据的标准方式
3. Using online databases and bulk downloads 使用在线数据库和批量下载
– “using ready-made databases” “使用现成的数据库”
Data Cleaning 数据清洗
- 数据一般是:
incomplete: lacking attribute values, lacking certain attributes of interest, or containing only aggregate data 不完整: 缺少属性值,缺少某些感兴趣的属性,或者只包含聚合数据
noisy: containing errors or outliers 噪声: 包含错误或异常值的
inconsistent: containing discrepancies in codes or names 不一致的: 包含在代码或名称上的不一致
案例:
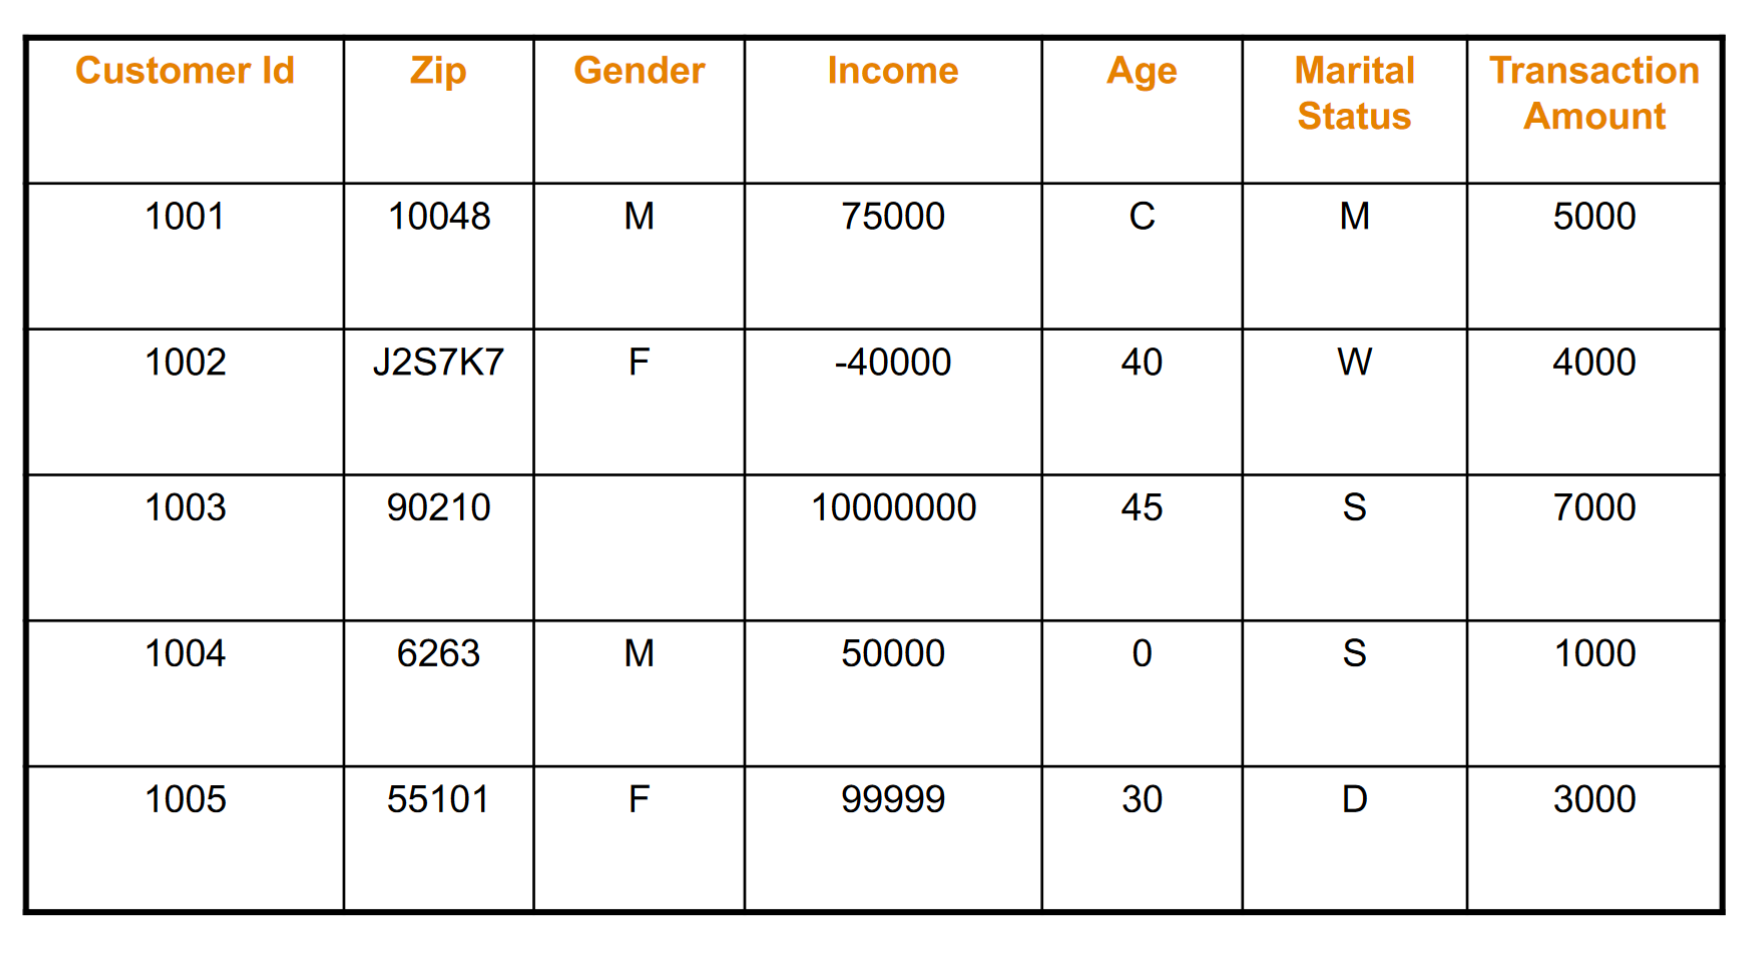
缺失,J2S7K7, -40000 10000000, C, 0
- 主要任务:
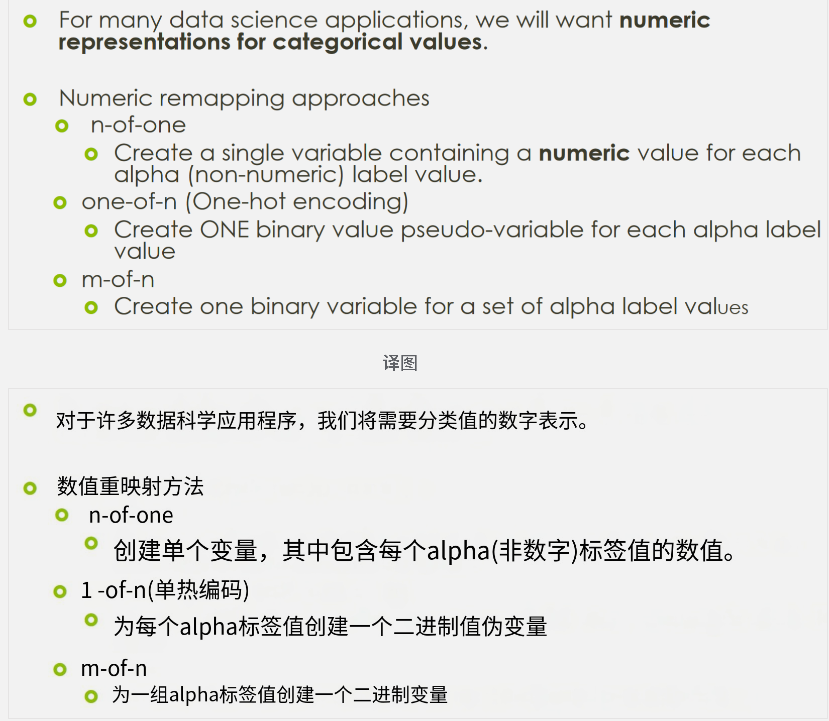
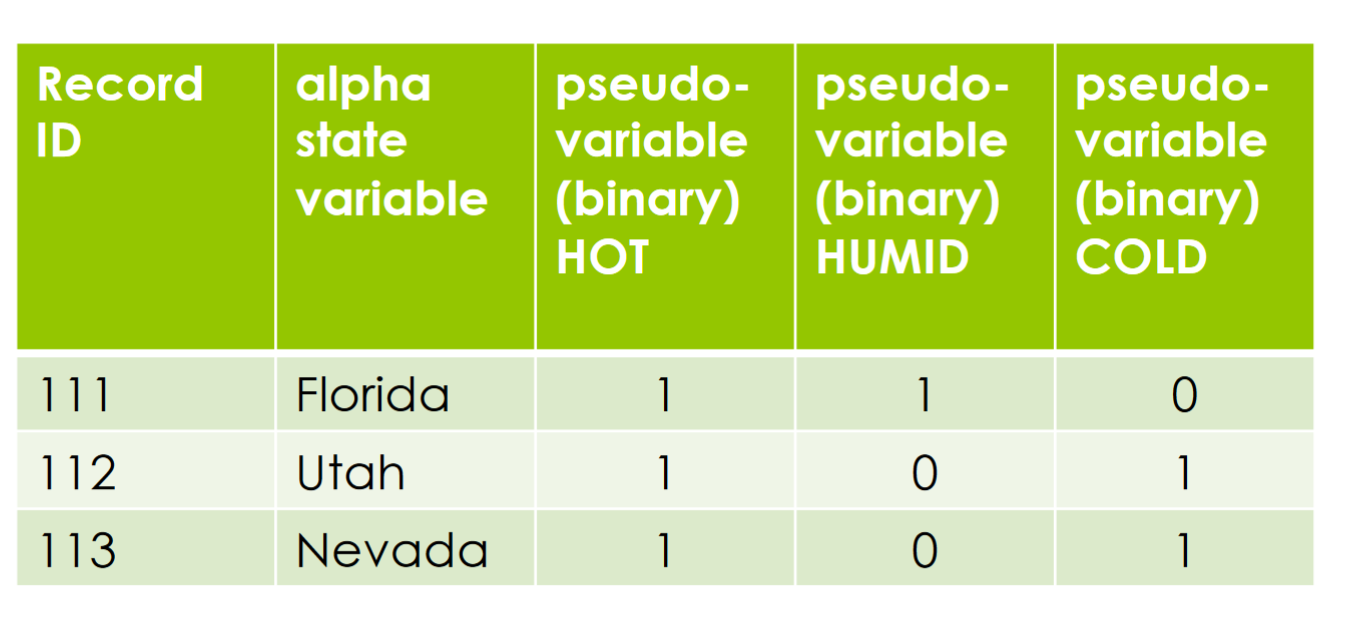
1. Value re-assignment – feature engineering 值重新分配 - 特征工程
- Normalization 归一化
Useful when dealing with attributes having different scales 在处理具有不同规模的属性时非常有用
Removing units of measure to allow for easier comparison of multi-dimensional data 删除度量单位,以便更容易地比较多维数据
Every dimension (attribute) is constructed so that its maximum and minimum values are the same. 构造每个维度(属性),使其最大值和最小值相同
Typically 0 is the minimum and 1 is the maximum. This creates a unit state space. 通常情况下,0是最小值,1是最大值。这将创建一个单位状态空间。
方法:1. Min-Max Normalization 2. Z-score Normalization 3. Decimal Scaling (移动小数点,例如最大是3,所以Vi/10^3)
2. Data cleaning 数据清理
Fill in missing values, smooth noisy data, identify or remove outliers, remove bad data / duplicates, and resolve inconsistencies 填充缺失值,平滑噪声数据,识别或删除异常值,删除坏数据/重复数据,并解决不一致。
数据清理的任务:1. Identify outliers 确认异常值 2. Fill in missing values 填补缺失值 3. Smooth out noisy data 平滑数据 4. Correct inconsistent data 纠正不一致数据
1. 确认异常值
使用箱线图或者scatter plot散点图或histogram观察
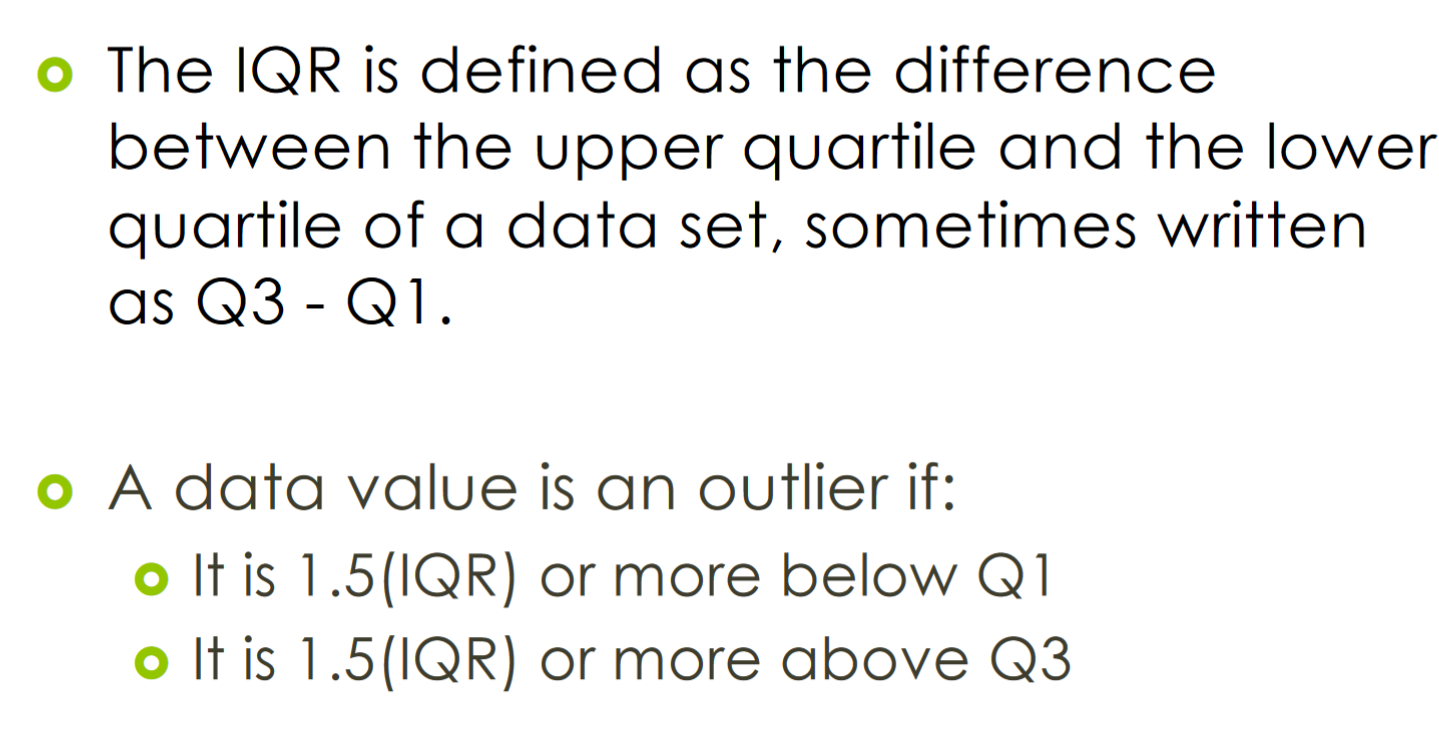
使用IQR探测:
2. Noise 噪声
audio
怎么处理noise data?
1. Binning: Looked at neighborhood and locally smooth data. 看了邻域和局部平滑数据
步骤:Sort data,Partition data into bins,Smooth data by bin mean or bin boundary depending on application. 对数据进行排序,将数据划分为bin,根据应用程序按bin均值或bin边界平滑数据
-
等宽(距离)分区:
- 将数据的取值范围均匀地分成N个间隔相等的区间。
- 每个区间的数据取值范围相同,但每个区间中的样本数可以不同。
- 如果A和B分别是属性的最低和最高值,那么每个区间的宽度将为:W = (B-A)/N。
- 这是一种直观简单的分区方法。
-
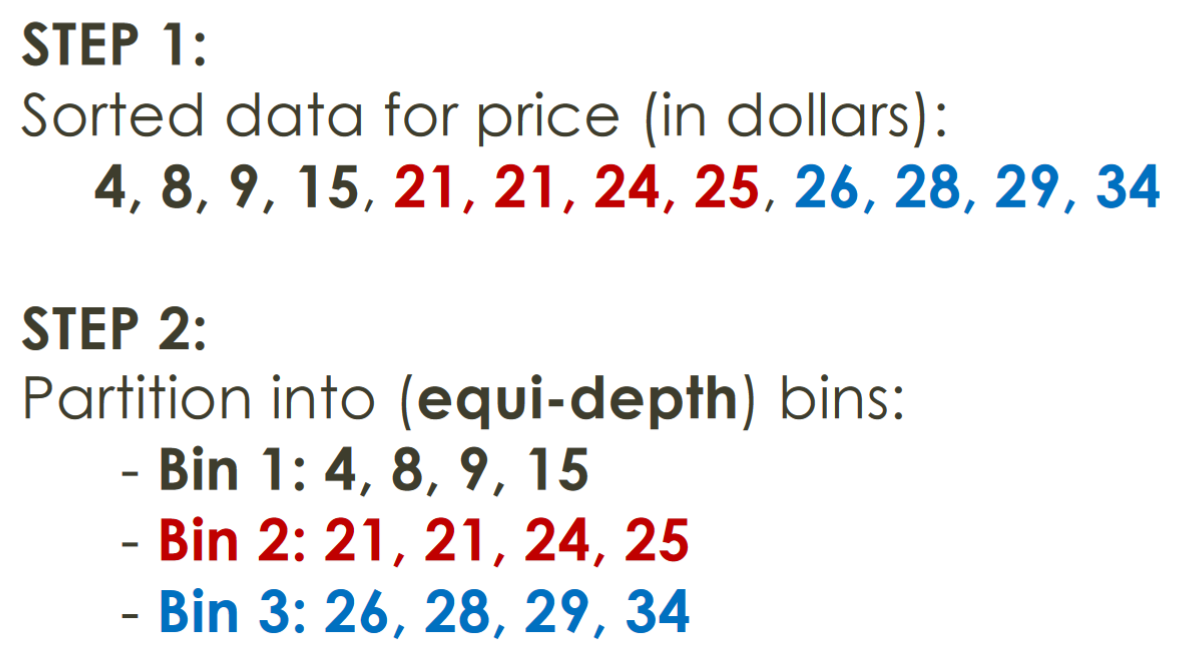
等深(频率)分区:
- 将数据的取值范围分成N个区间,每个区间中包含大致相同数量的样本。
- 这种方法有助于在不同区间中保持较好的数据分布。
步骤案例:
 最低0.47元/天 解锁文章


 1901
1901

 被折叠的 条评论
为什么被折叠?
被折叠的 条评论
为什么被折叠?
 到【灌水乐园】发言


