


作者,Evil Genius
前天清明节,我陪父母都回老家了,祭奠先人的同时,也是让自己能够完全冷静下来,不得不说老家是一个让人感到安宁的地方,连父母极度悲伤的情绪也得到了很大的缓解,姥姥还健在,看到母亲和姥姥见面的那一刻,其实自己也能感觉到,母亲也是个女儿。
游子们,尤其出身农村的游子们,如果有机会,多回家看看。
好了,今天我们分享的文献在Spatial transcriptomics reveals niche-specific enrichment and vulnerabilities of radial glial stem-like cells in malignant gliomas,2023年2月发表于NC,我精读了一下,有很多好的方法值得推荐。
文章大家可以好好看看,我在这里重点讲述分析方法,
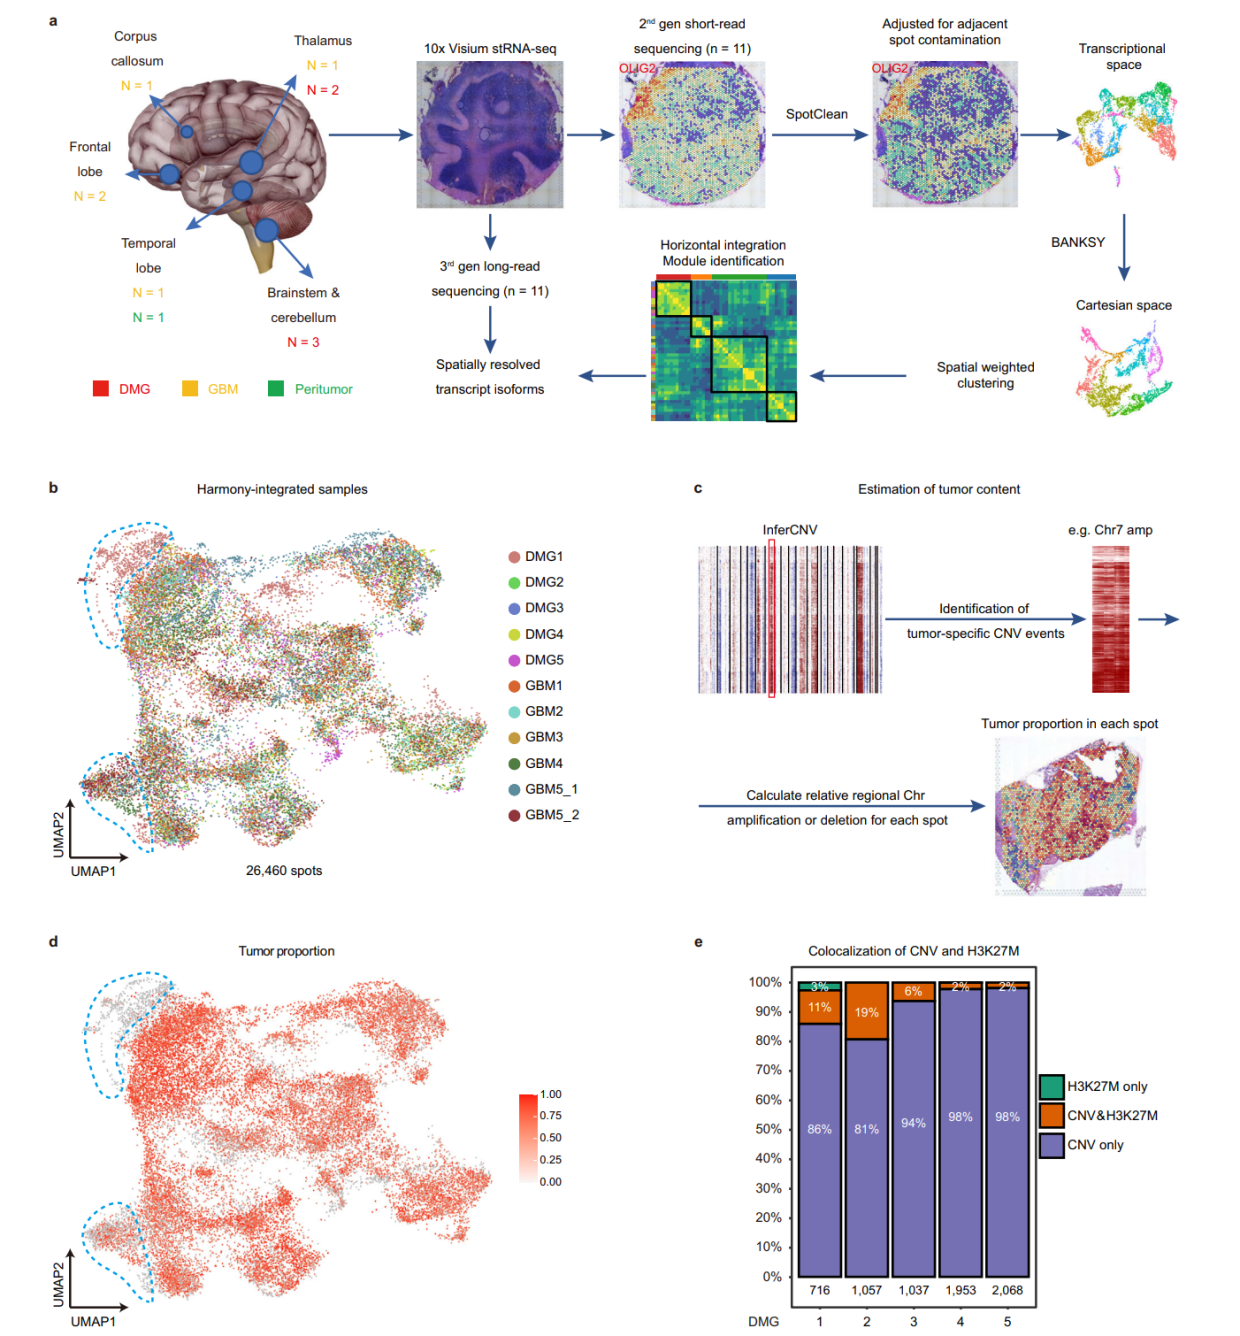
首先,空间转录组污染的问题,这个污染来源于周围spot转录本的弥散,去污的方法是SpotClean,这个方法我之前分享过,文章在10X空间转录组去污染分析之SpotClean
第二点,空间整合聚类的方法,不同于单细胞,空间具有形态学信息,因而聚类可以进行一定程度上的监督,我们来看作者的做法。
Spots from different samples are horizontally integrated in the transcriptional space by Harmony. To integrate both transcriptional space and Cartesian space for spatially informed spot clustering, we tested several recently developed spatially aware tools such as Seurat, BayesSpace,SpatialPCA, Spruce, SpatialDE, and BANKSY. Since the DMG1 sample contains a significant portion of normal cerebellum tissue with clearly demarcated anatomic domains, we used DMG1 as a benchmark to compare the clustering results, and found that the clusters generated by Banksy best correlate with anatomical domains in DMG1
整合的方法依据形态学的认知进行识别,正常的区域应当单独聚成一类,从这个方面也说明不见得引用率最多的方法就是最好的方法,适合数据特点的方法才是最好的。
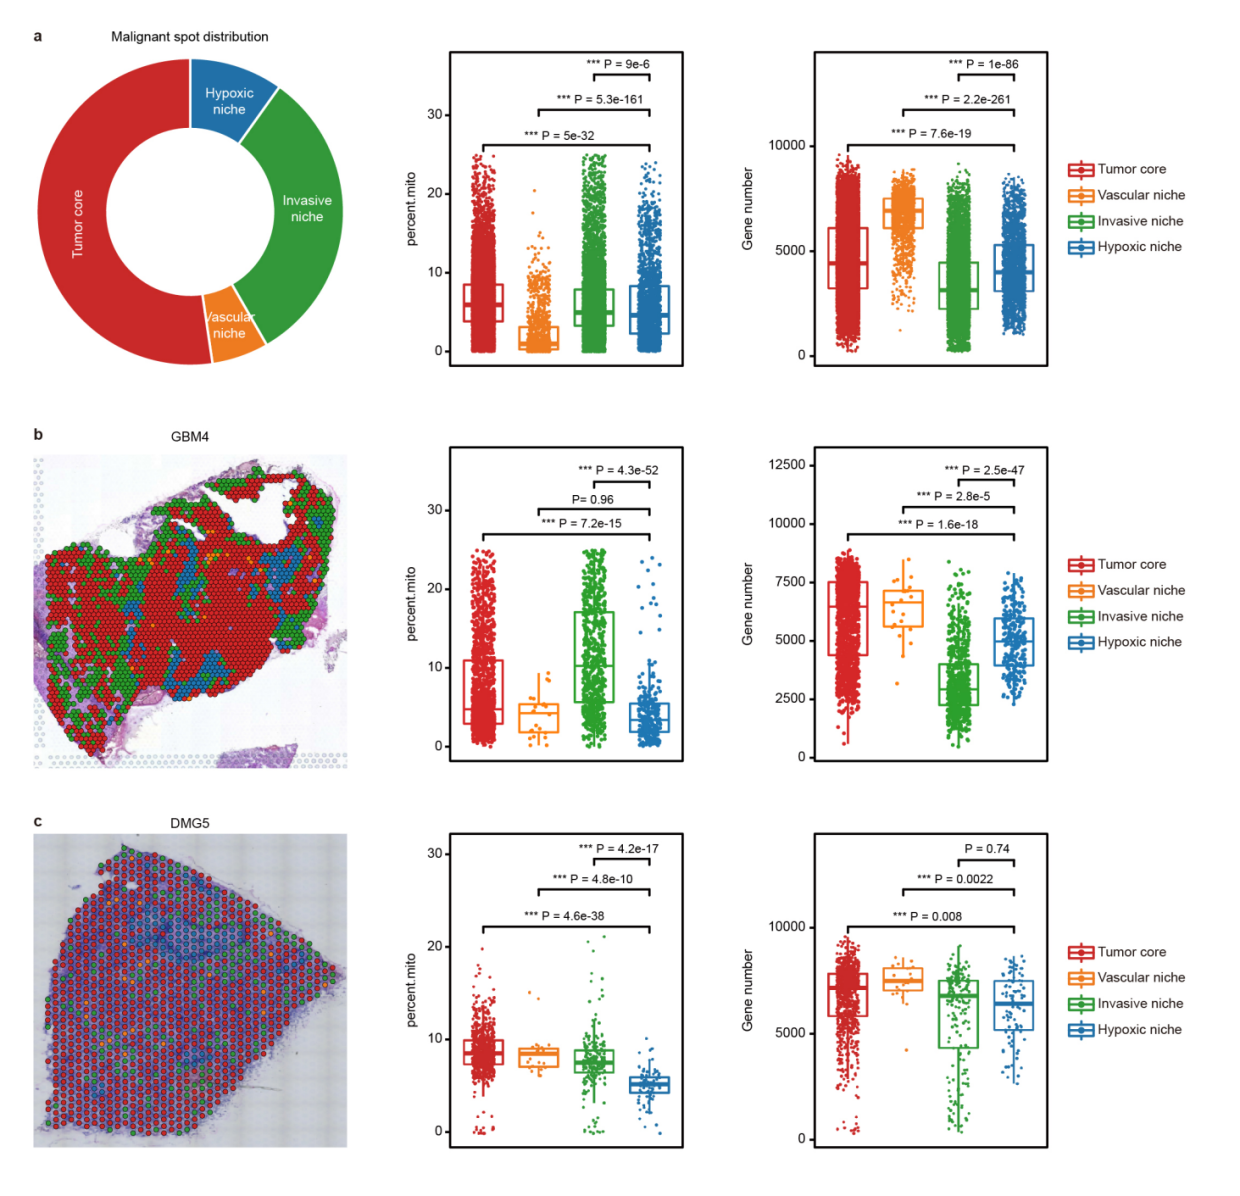
第三点,肿瘤spot的恶性程度评判,这个地方注意参考的选择
To identify malignant spots with relatively high tumor cell content, we performed inferCNV analysis using histologically normal peritumor tissue as a reference
上一篇刚讲过,如果怀疑肿瘤样本对自己取的正常组织会产生影响,那就使用inferCNV或者copyCAT来分析一下,如果没有明显的CNV事件,那么就多了一个证据断定样本来源于正常组织。当然这个会检出很多的CNV事件,那么这个事件,就可以进入下游的深入分析。
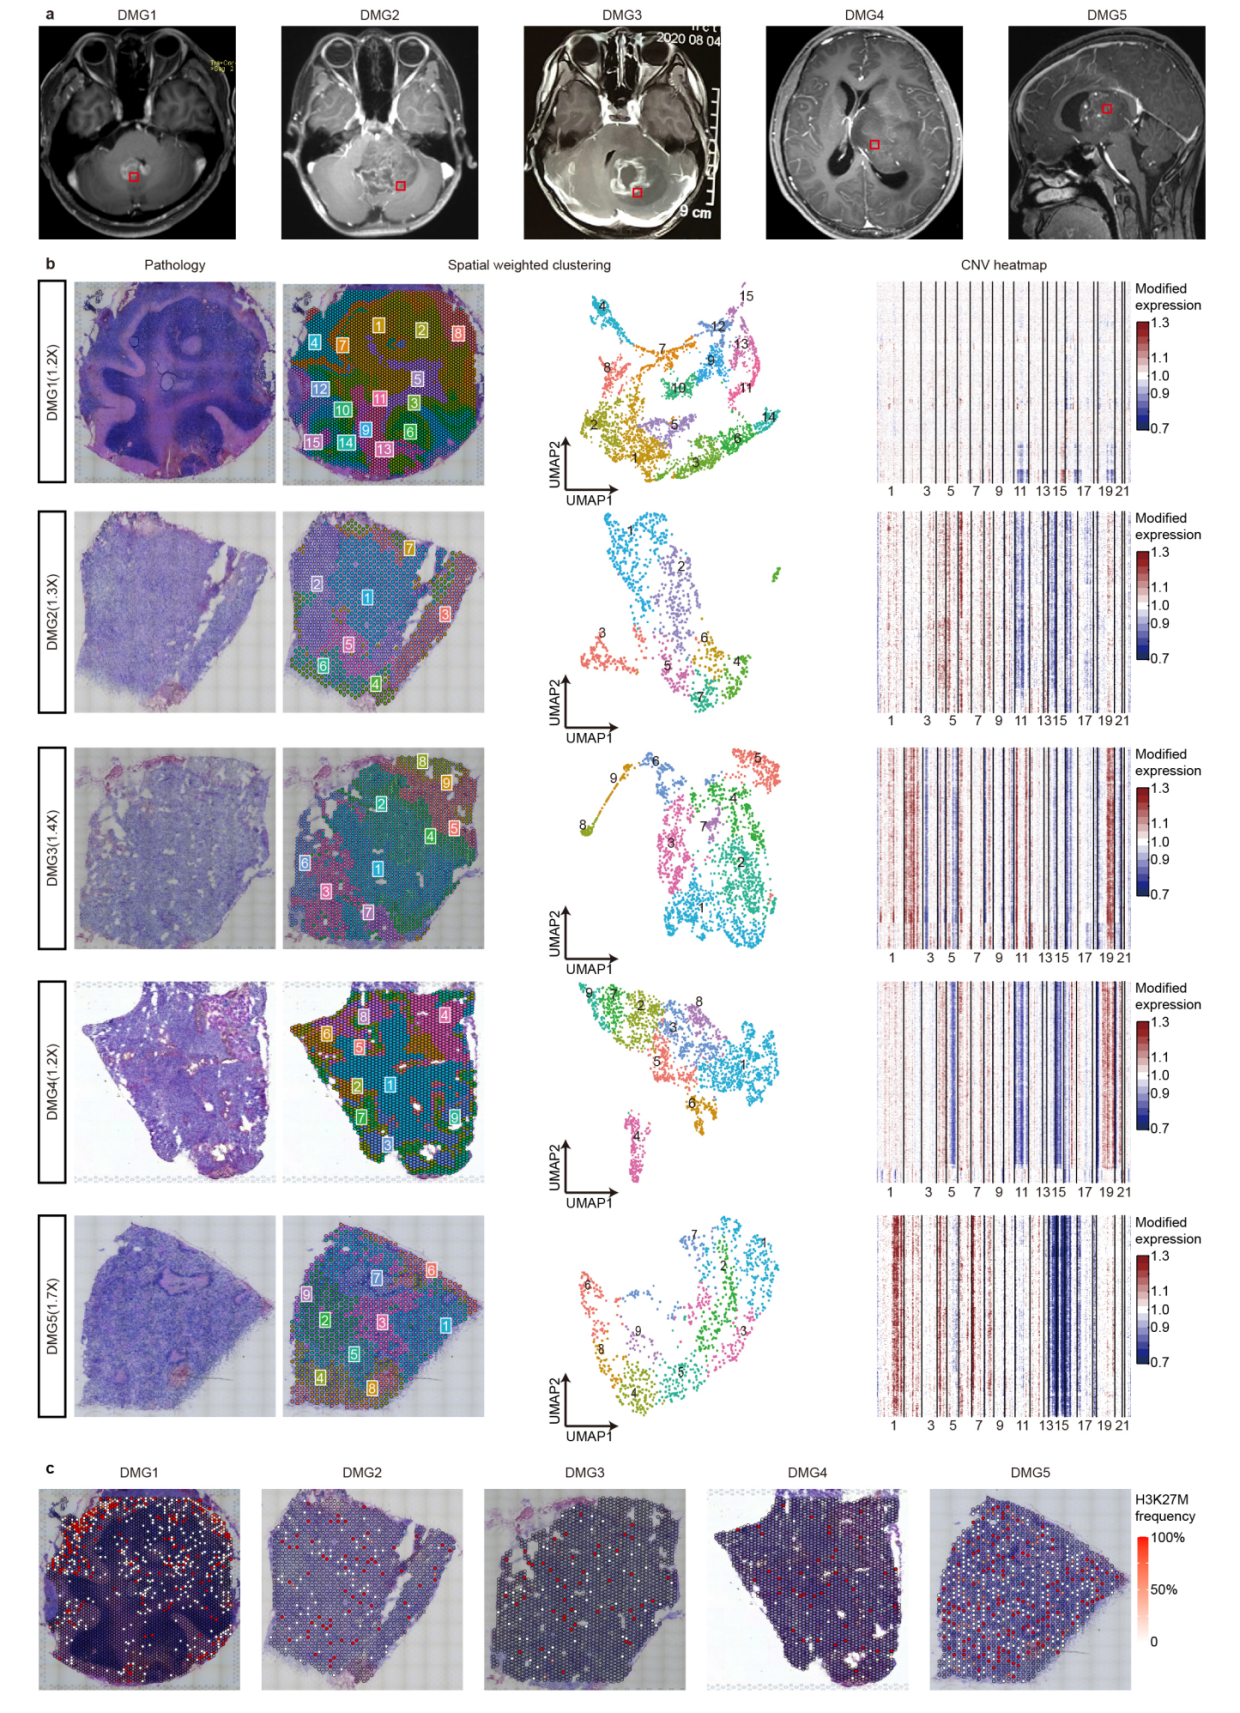
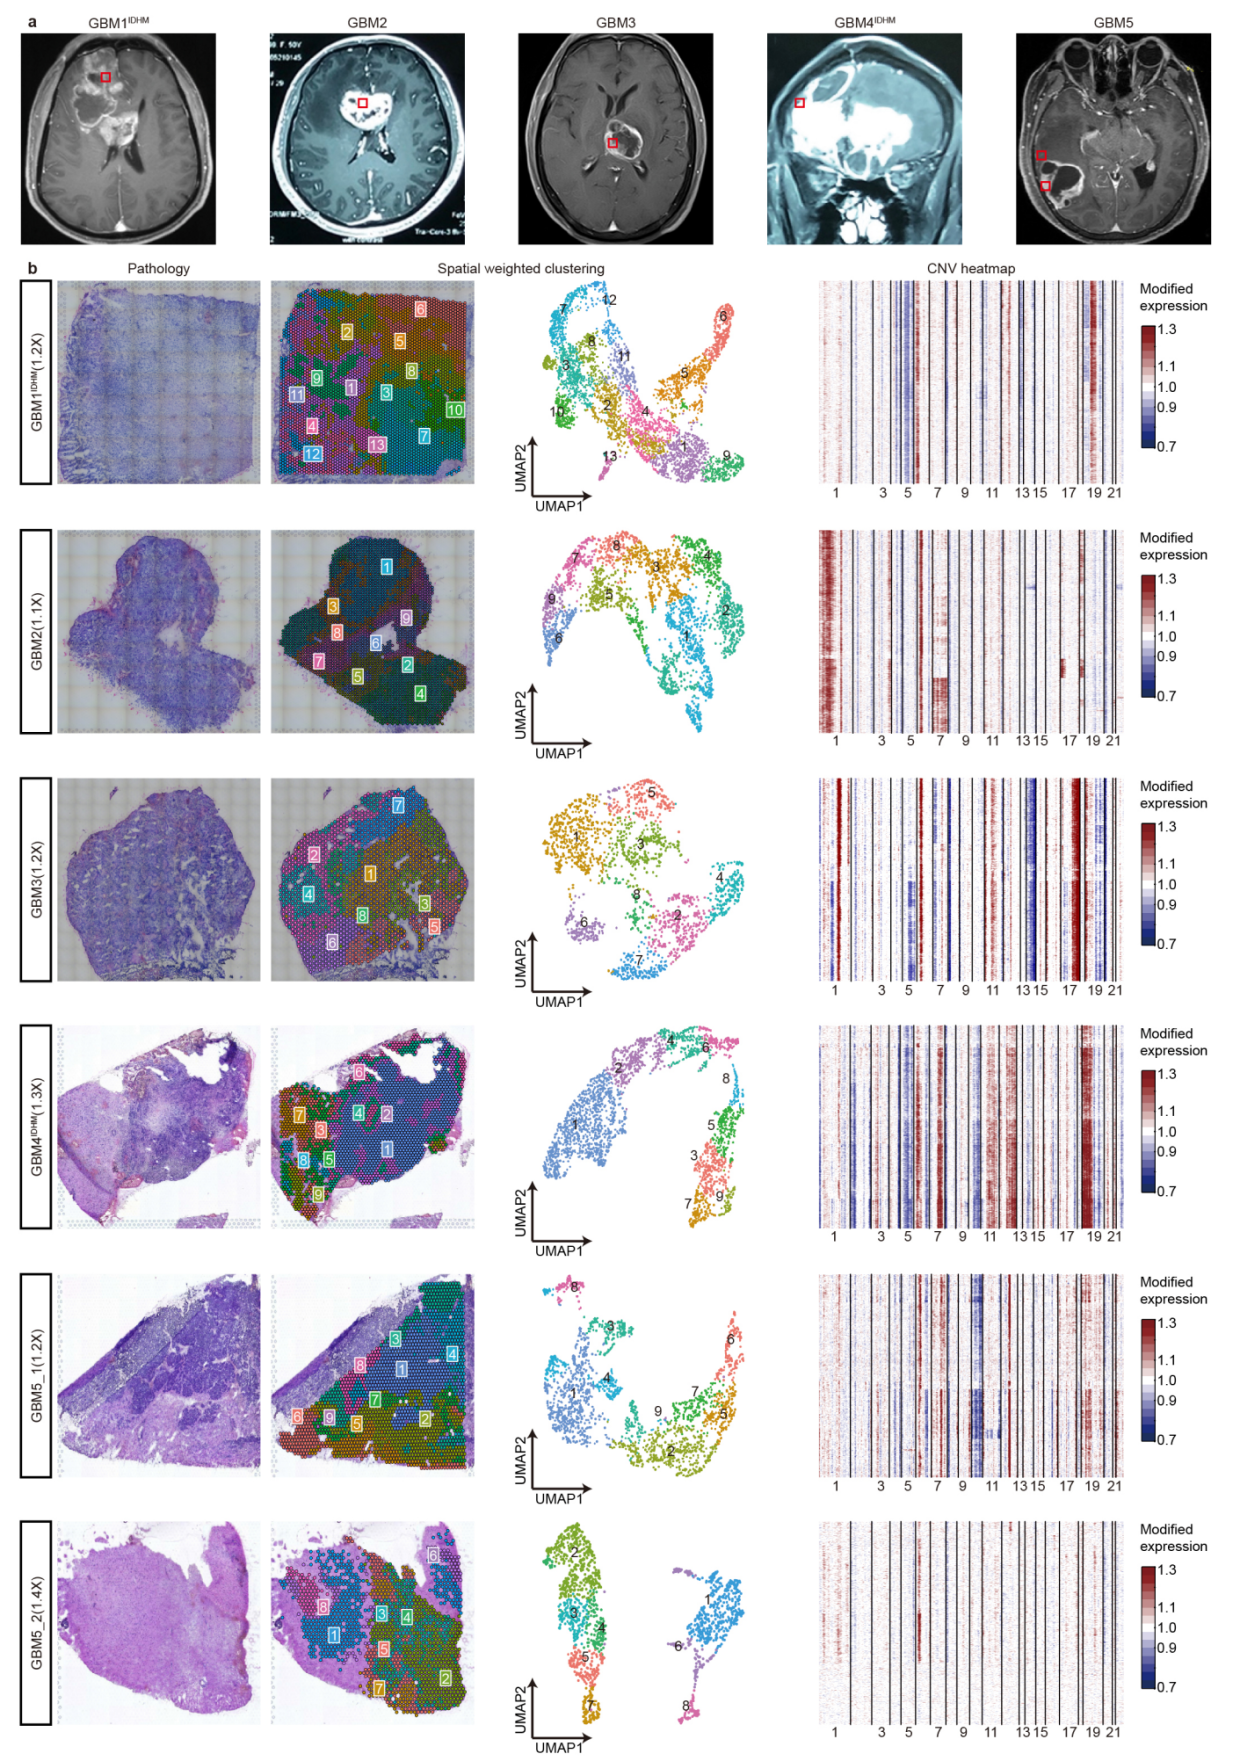
这个地方也可以看出,不同样本的聚类结果往往也有很大的差异,但是如果可以判断大致的形态学位置,那么认为这个聚类结果是正常的。
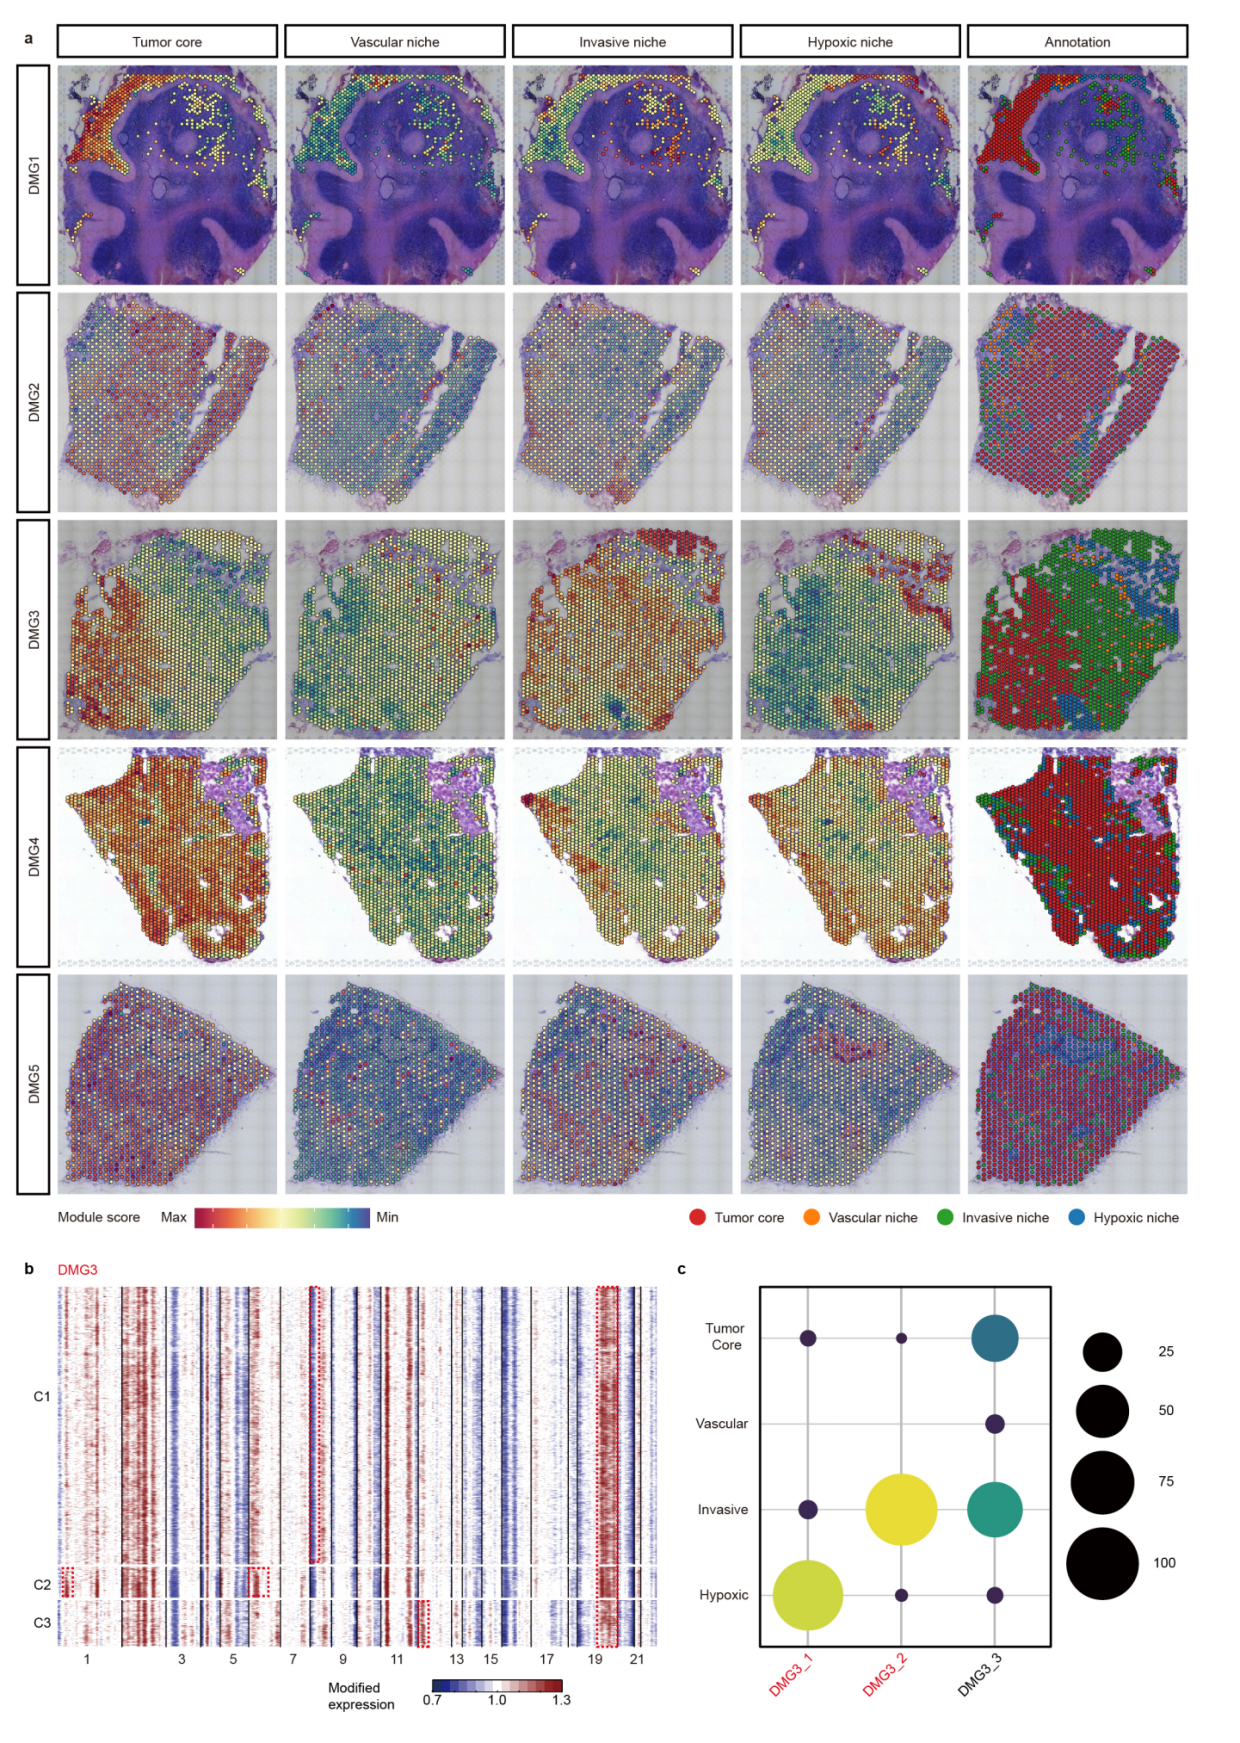
第四点,识别肿瘤转录的program,这也是文章中常见的分析内容,一般我们采用WGCNA或者NMF寻找,但是这是偷懒的方法,作者就做的非常精细。
we first analyzed patient samples individually to identify spatially informed marker gene sets. For each sample, we filtered out malignant spots, performed BANKSY to group them into spatially informed clusters, and identified marker genes for each cluster using the Seurat package27 (v4.0.4) (FindAllMarkers function, only. pos = T, p_val_adj < 0.05), while excluding marker genes that are shared by different clusters. For each cluster, we retained the top 50 marker genes based on log2FC. Clusters with fewer than 50 significant genes (log2FC > 0.25 and P.adj < 0.05) were removed. As a result, 48 spatially informed marker gene sets were identified across 10 tumor samples.
To horizontally integrate these gene sets into transcriptional modules, we tested three methods as follows and got consistent results.
(1) In the transcriptional space, we calculated the relative gene set expression score in each spot using the Seurat’s (v4.0.4) AddModule-Score function with default parameters. The gene set expression matrix was then used as input for Pearson correlation analysis. The resultant correlation coefficient matrix was subjected to hierarchical clustering using corrplot package-based hclust method, integrating the 48 spatially informed marker gene sets into four cluster modules.
(2) In the Cartesian space, while each spot is not spatially independent, spatially informed clusters obtained by Banksy can be considered independent to each other. Thus,we integrated spots fromthe same cluster in each sample into pseudobulks using Seurat’s (v4.0.4) AverageExpression function. For each pseudobulk, we calculated the relative expression of the aforementioned 48 marker gene sets using Seurat’s (v4.0.4) AddModuleScore function with the default parameters. The gene set expression matrix was then used as input for Pearson correlation analysis. The correlation coefficient matrix was
subjected to hierarchical clustering using corrplot (v0.92) packagebased hclust method, resulting in four modules highly similar to method 1 (Jaccard-Index 0.746).
(3) In the Cartesian space, since adjacent spots are not independent, we used Geographically Weighted Regression (GWR) for correlation analysis. We first calculated all 48 marker gene set scores for individual spots in each sample. Then we calculated the spatially weighted correlation coefficient between any two gene sets using the GWmodel(v2.2) and gwrr (v0.2-2) packages, individually for each sample. The resulting correlation array was reduced by mean to generate a single cross-sample correlation coefficient for any two gene sets. Finally, the correlation coefficient matrix was hierarchical clustered using the corrplot package-based hclust method, resulting in four modules similar to method 1 (Jaccard-Index 0.53). The mean values of the correlation coefficients were visualized by ComplexHeatmap64 R package (v2.0.0).
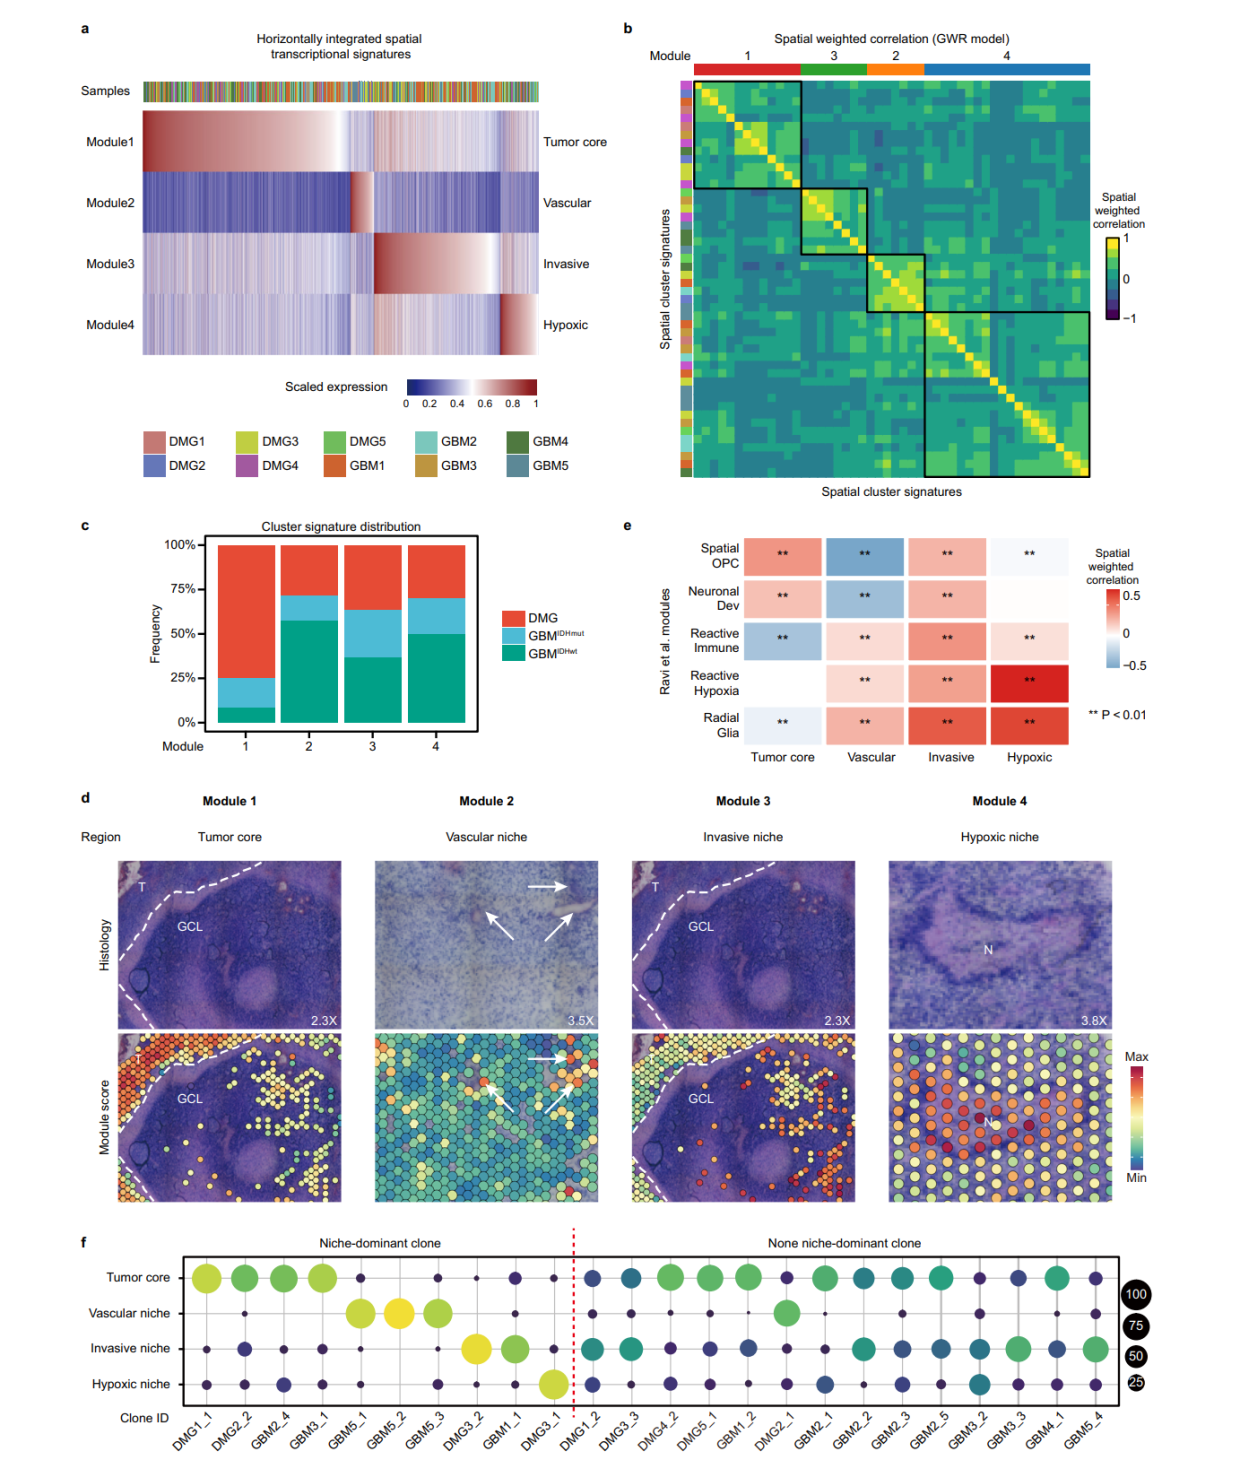
当然,最终的模块结果跟形态学是匹配的,这也是空间转录组需要告诉我们的信息。当然, 模块的分布与CNV事件的关联,也自然而然成为分析的重点。这里的模块分布,就意味着niche的分布。
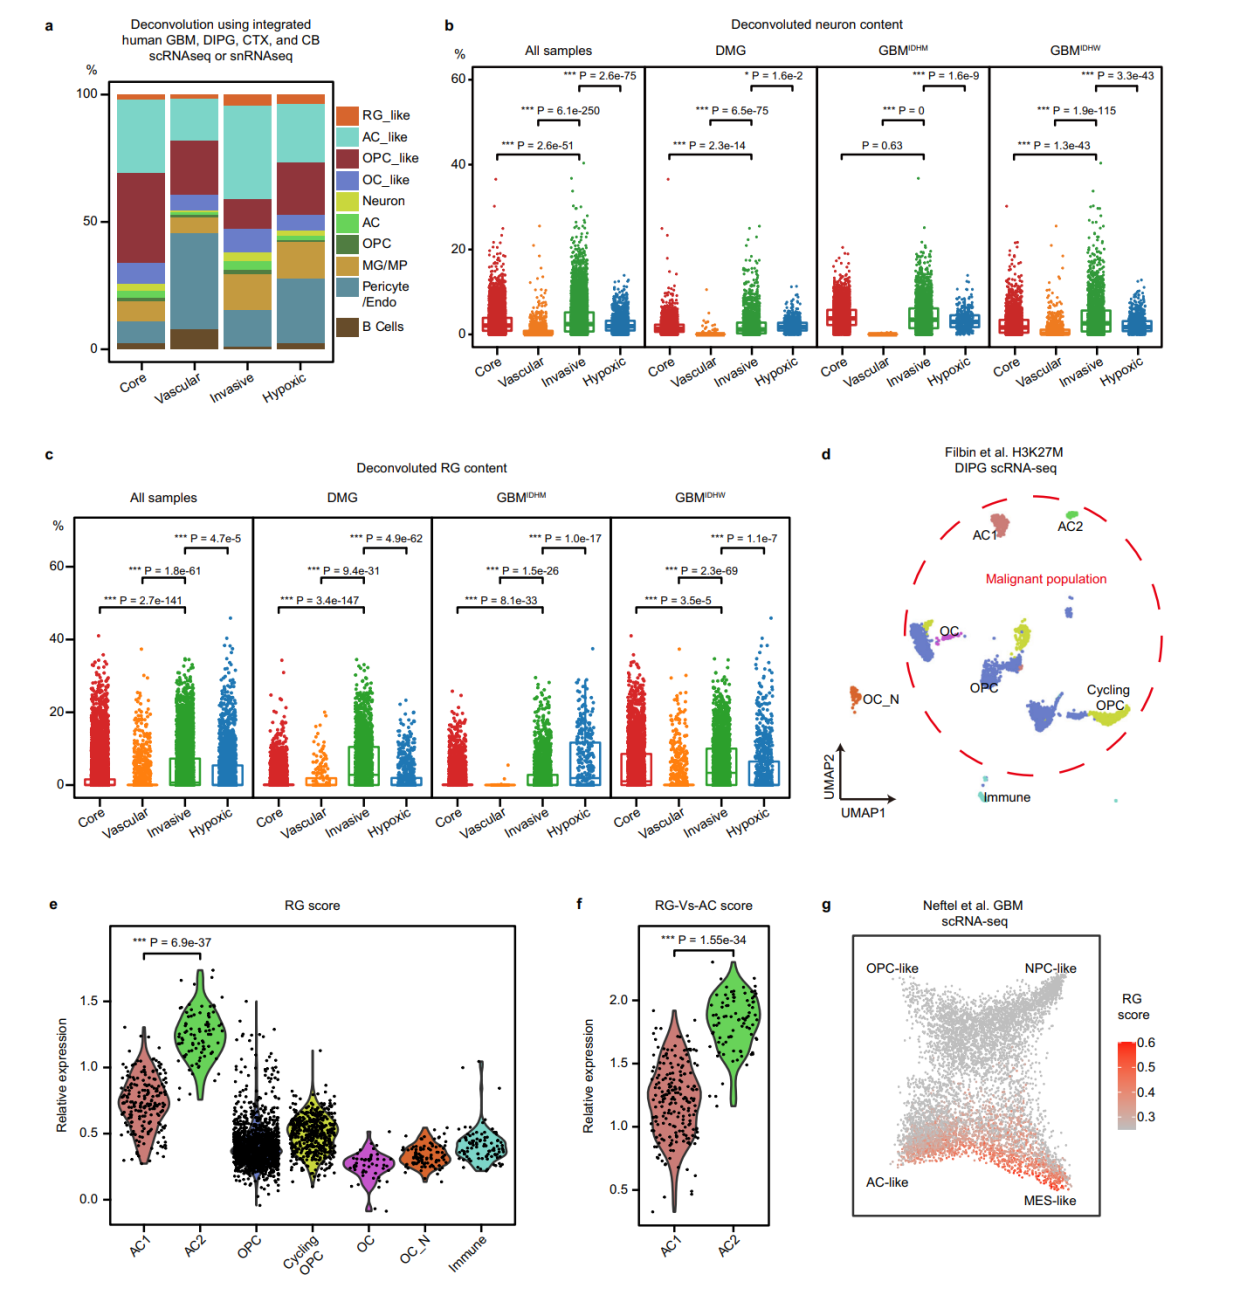
第五点,解卷积分析,这里也提醒我们,如果没有匹配的单细胞数据来运用的话,可以借助数据库的单细胞数据。分析niche的时候判断细胞类型的分布差异。这个地方就为生态位通讯提供了依据。
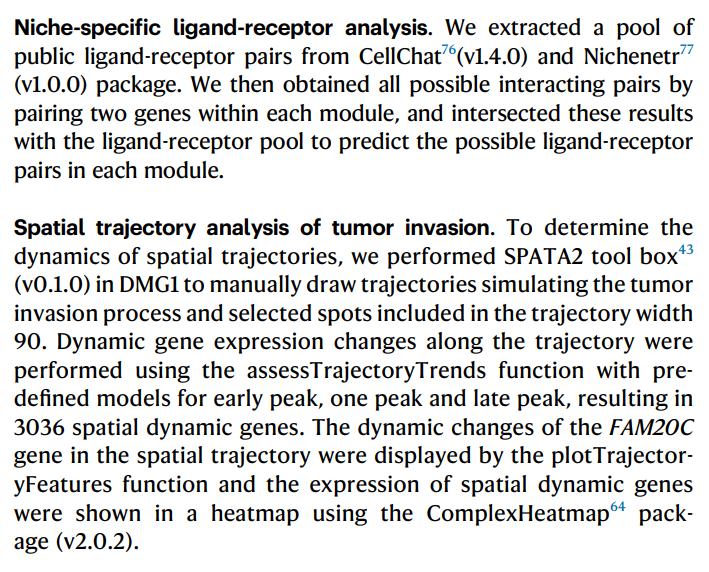
第六点,空间轨迹基因,identified genes specifically upregulated in each region based on their dynamic expression patterns.对于空间轨迹基因的变化,高度特异的区域基因在调节生态位program起到至关重要的作用。
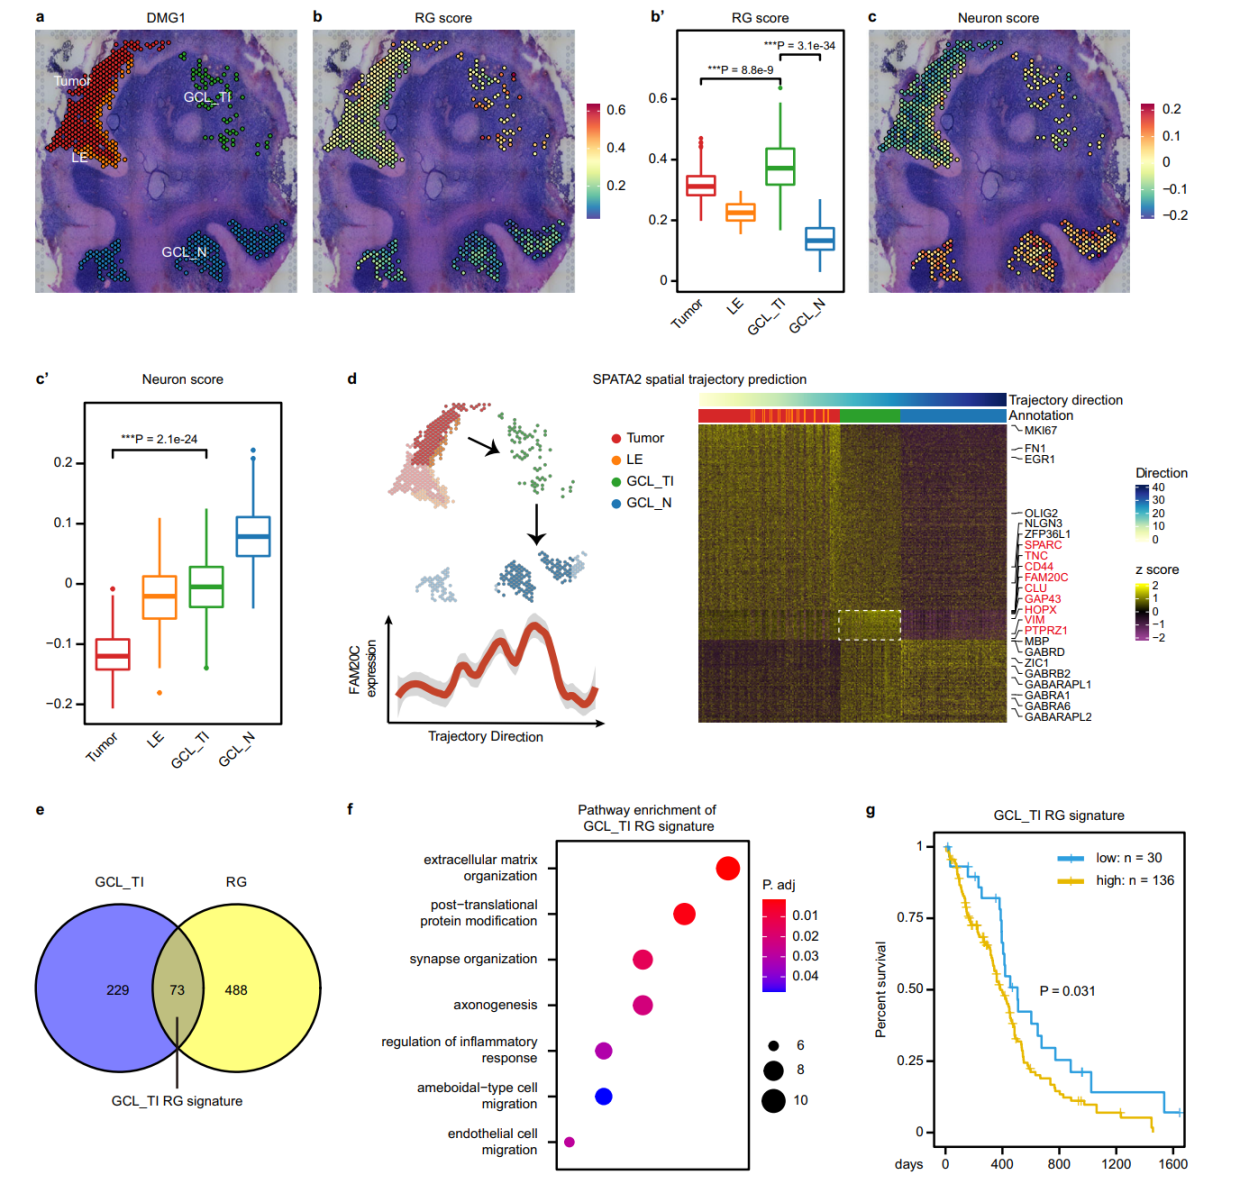
这种区域特异基因是我们关注的重点,当然,文章还有一些三代全长的分析内容,这部分就需要继续学习了。我们来看看重点的分析方法。
生活很好,有你更好


 948
948


 被折叠的 条评论
为什么被折叠?
被折叠的 条评论
为什么被折叠?
 到【灌水乐园】发言


